the Creative Commons Attribution 4.0 License.
the Creative Commons Attribution 4.0 License.
 | 27 Sep 2018
FerryBox data in the North Sea from 2002 to 2005
Susanne Reinke
Gisbert Breitbach
Michail Petschatnikov
Henning Wehde
Henrike Thomas
From 2002 to 2005 a FerryBox system was installed aboard two different ferries travelling between Cuxhaven (Germany) and Harwich (UK) on a daily basis. The FerryBox system is an automated flow-through monitoring system for measuring oceanographic and biogeochemical parameters installed on ships of opportunity. The variables were recorded in a time interval of 10–20 s, corresponding to a spatial resolution of about 100 m. The data set provides the parameters water temperature, salinity, dissolved oxygen and chlorophyll a fluorescence. There is a longer data gap between November 2002 and August 2003 in the time series due to a change of the vessel in October 2002. The data are available at https://doi.org/10.1594/PANGAEA.883824 (Petersen et al., 2017) and as part of the COSYNA (Coastal Observing System for Northern and Arctic Seas) data portal CODM at http://codm.hzg.de/codm (last access: September 2018) or https://doi.org/10.17616/R3K02T (Breitbach, 2018).


-
Repository reference: continuous thermosalinograph data
-
Available for the transect of Cuxhaven (Germany) to Harwich (UK)
-
Ship name: Admiral of Scandinavia and Duchess of Scandinavia
-
Date/time start: 1 March 2002
-
Date/time end: to 24 October 2005
Monitoring of a highly dynamic system such as coastal waters requires dense sampling in space and time in order to catch short-term events (e.g. storms, algal blooms), which might have a strong impact on the coastal ecosystem. Existing observations mostly lack the spatial coverage and temporal resolution required to determine the state of the marine environment and changes therein.
While running more or less the same track, in each transect the spatial and temporal resolution of observations is very high along the route of the ferries. The data of FerryBox systems are restricted to the track and to surface waters at a certain depth (inlet of the FerryBox typically in the range of 4–5 m). As the inlet was more at the rear end of the vessel the water layer down to the inlet was probably more or less fully mixed while the vessel was moving.
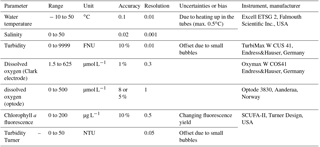
Table 1Specifications of sensors in the FerryBox system as reported by the manufacturer.
Here, we present a data set of surface water temperature, salinity, chlorophyll a fluorescence and dissolved oxygen from March 2002 to October 2005. All data were quality-checked for outliers (e.g. caused by air bubbles) and global and regional ranges, and were flagged according to the recommendations of SeaDataNet1. Due to a change of the vessel in October 2002 there is a data gap in the time series between November 2002 and August 2003.
FerryBox/study area
The route consists of the transect from Harwich (51.93∘ N, 1.31∘ E) to Cuxhaven (53.88∘ N, 8.71∘ E).
The FerryBox system was installed on the route between Cuxhaven (Germany) and Harwich (UK) on board of the ferry Admiral of Scandinavia (DFDS Seaways, Copenhagen, Denmark) from February 2002–October 2002 and on board of the ferry Duchess of Scandinavia (DFDS Seaways, Copenhagen, Denmark) from September 2003 to October 2005.
The FerryBox continuously measures oceanographic parameters in a flow-through system. The water intake was from the sea chest at the front of the ship's cooling system at a fixed depth (5 m) from where the water was pumped (centrifugal pump) continuously. A debubbling unit removes air bubbles which may enter the system during heavy seas. Water passes from the debubbler to the different sensors through an internal water loop. Biofouling is effectively prevented by automatic cleaning of the sensors with tap water, and by rinsing with acidified water after each cruise when the vessel is in the harbour. Sensors for temperature and salinity are included (Table 1). In addition, an oxygen sensor (Clark electrode and later on an oxygen optode) is installed. Furthermore turbidity and chlorophyll a fluorescence have been measured (Petersen et al., 2003, 2014). Chlorophyll a fluorescence data are provided in this data set which were not calibrated against chlorophyll a analysed in the lab. As the chlorophyll a fluorescence yield depends on several factors (light conditions, species and physiologic status of the algae) these chlorophyll data may have high uncertainties in comparison to total chlorophyll a. Furthermore long phytoplankton cell chains could get partly damaged by the centrifugal inlet pump which might change the chlorophyll a fluorescence yield. However, this impact is probably small as such an effect could never be approved using similar pumps on research vessels. Water samples directly taken from the FerryBox were compared with bottle samples from a Niskin water sampler and did not show significant differences in chlorophyll a fluorescence. The technical specifications of all sensors are summarized in Table 1.
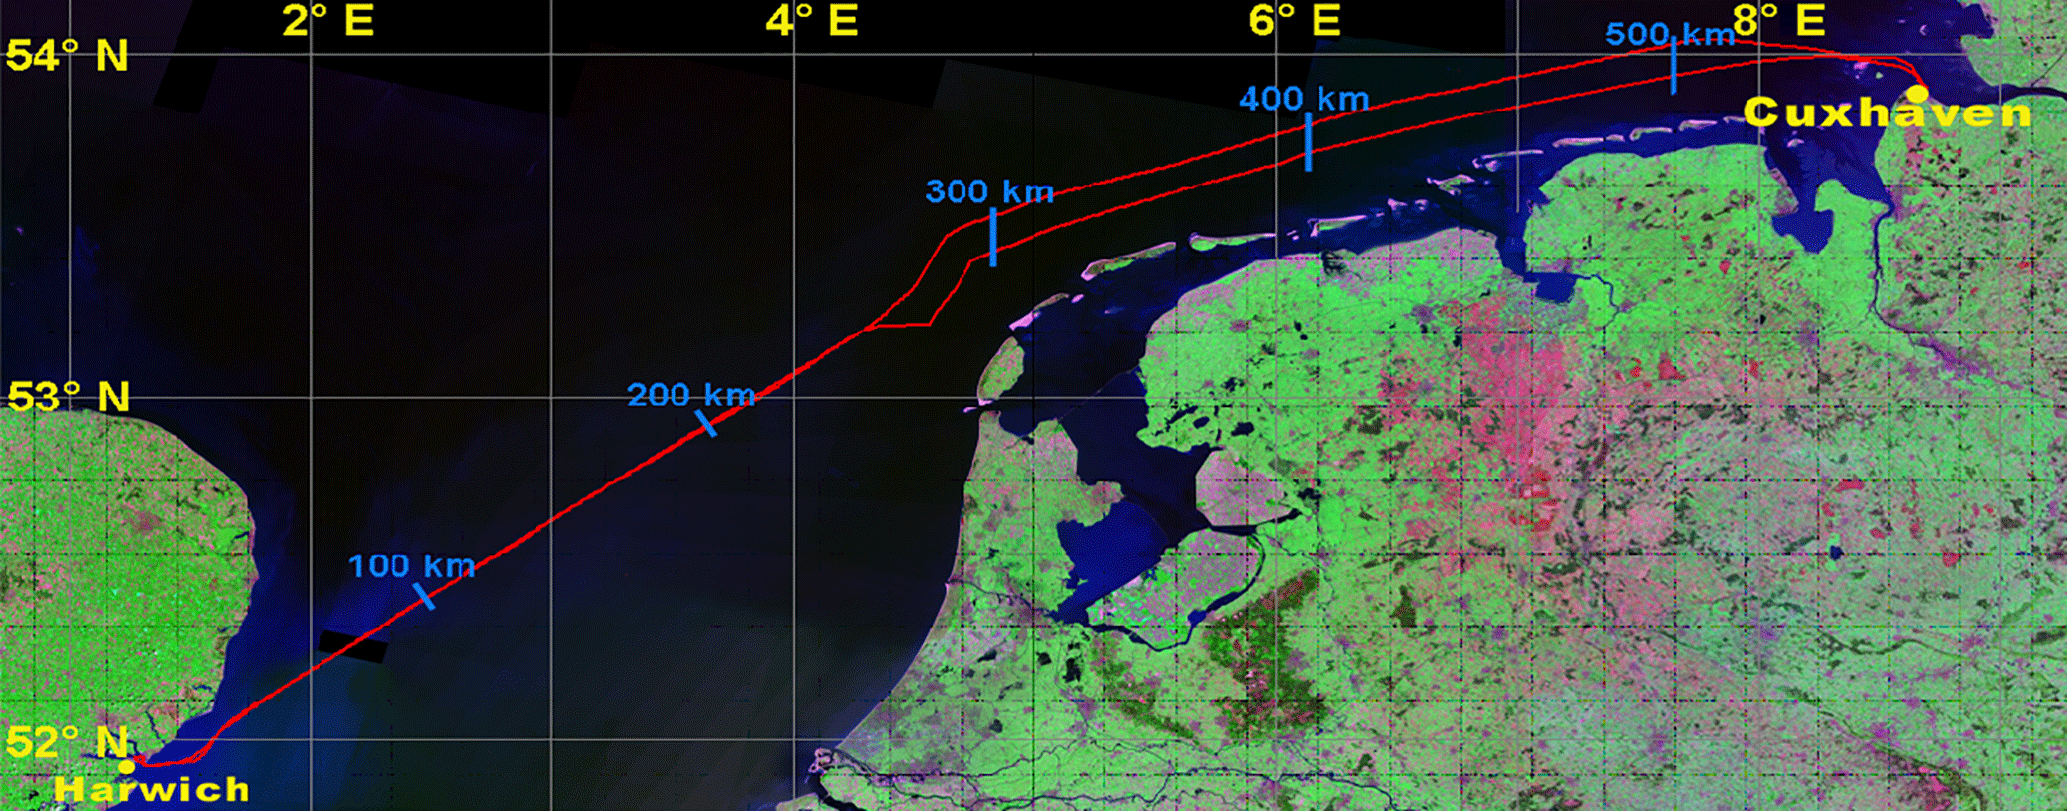
An automated refrigerated water sampler was used to collect seawater at predefined positions and/or in case of an event (e.g. a certain amount of chlorophyll a fluorescent signal) for subsequent laboratory analysis and quality assurance with focus on salinity measurements and partly chlorophyll a. Housekeeping parameters for diagnostics such as flow rates and pressures inside the water loops were measured to supervise the system. The ferry travelled across the southern part of the North Sea, covering the coastal zones of Germany and the Netherlands, and crossed the inflow of the English Channel into the North Sea. The map of the route is shown in Fig. 1. Routinely, the ferry travelled nightly between the two ports.
The FerryBox was maintained at least fortnightly and bottle samples were taken regularly from the automatic sampler for subsequent lab analysis.
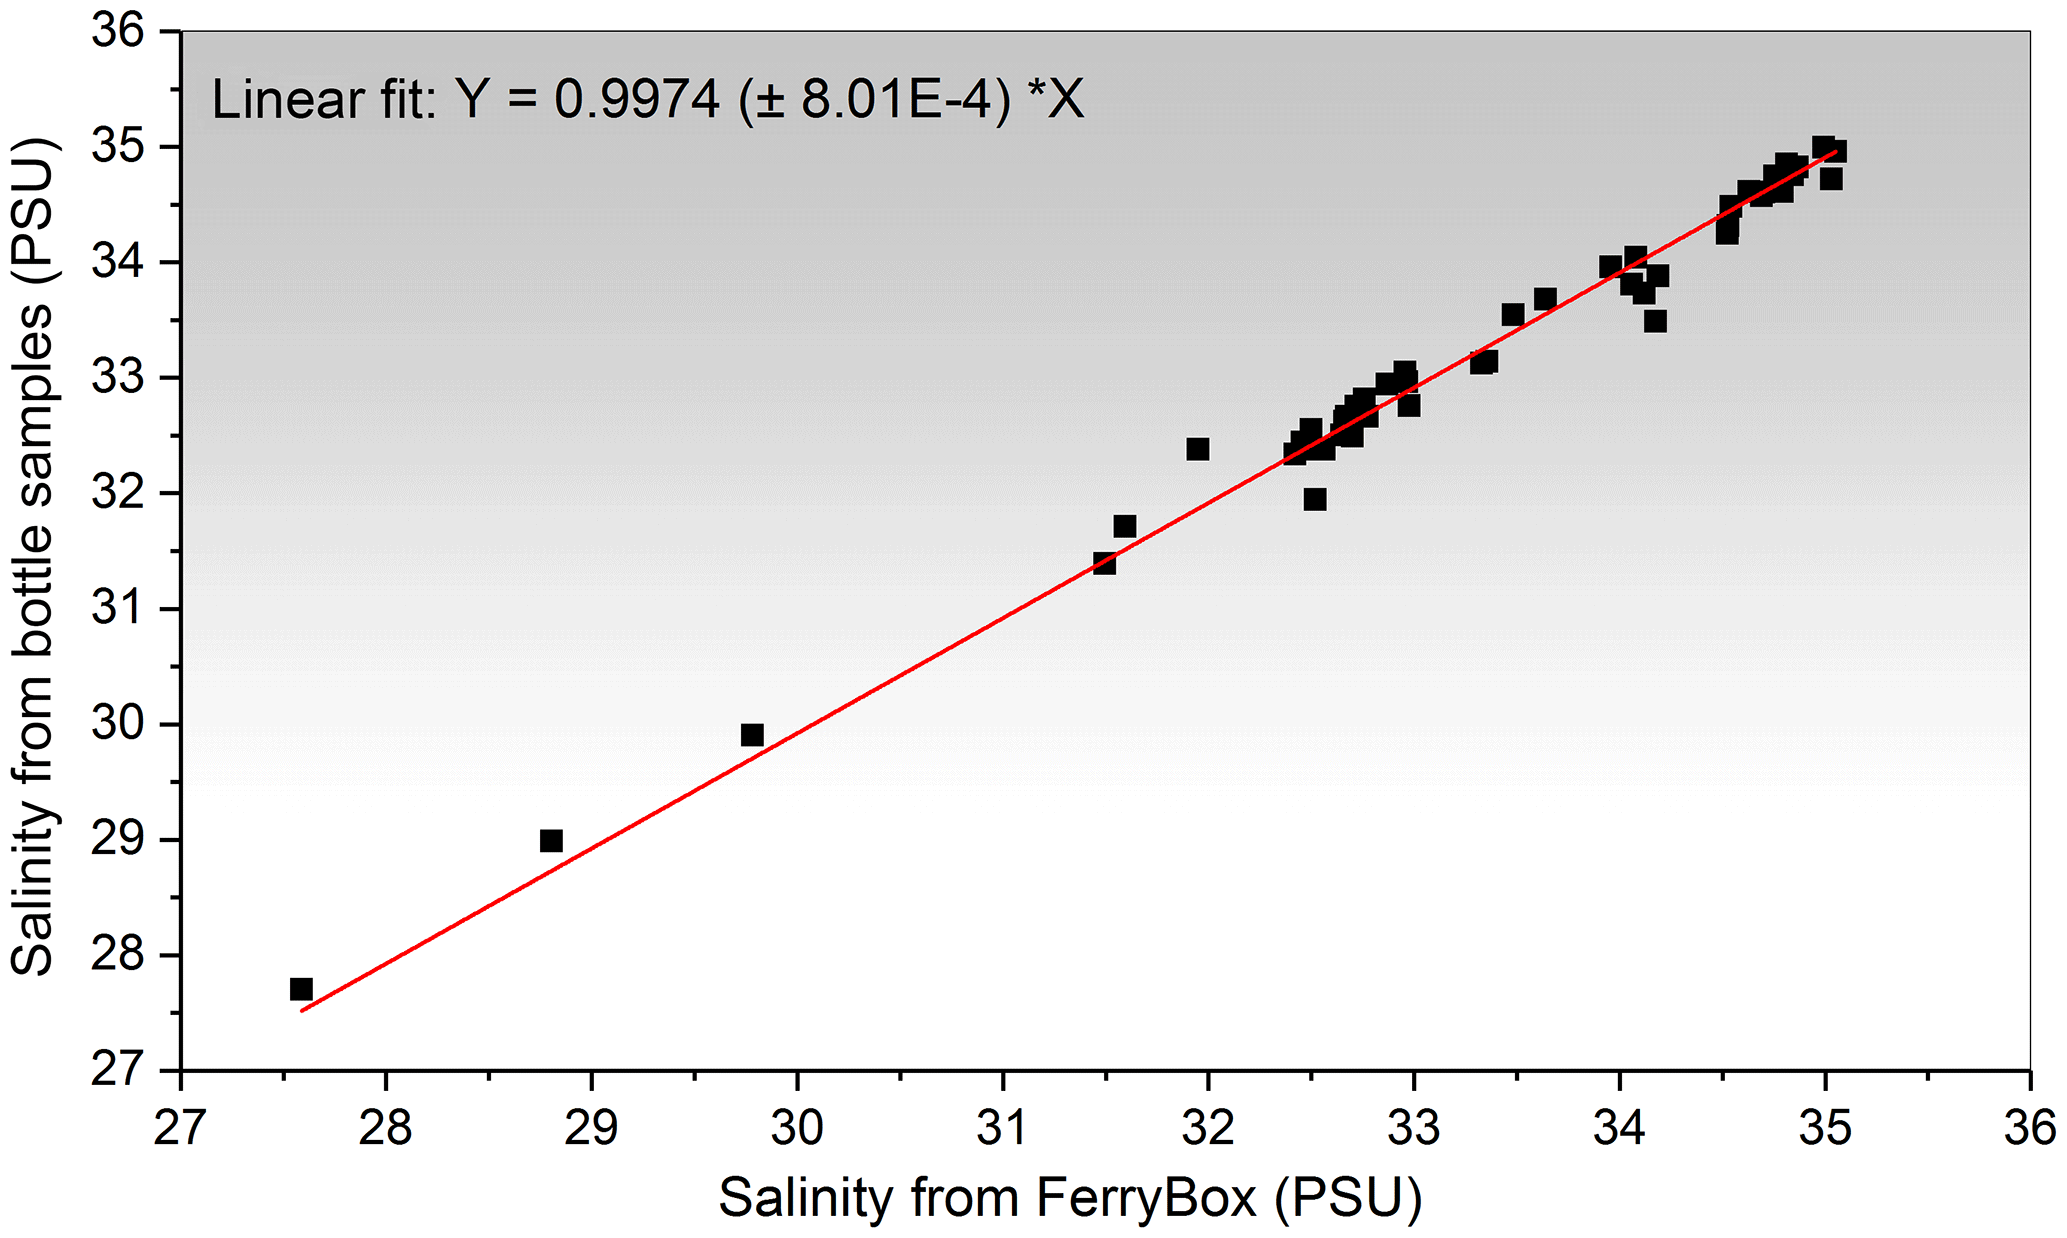
Figure 2Validation of salinity data: comparison of bottle samples measured in the lab with data obtained from FerryBox.
The water temperature measured by the FerryBox has a bias due to heating up by the pump and in the tubes connecting to the FerryBox. The temperature offset between the intake and the FerryBox was maximally up to 0.4 ∘C, based on measurements with a sensor at the intake and the sensor in the FerryBox. Due to ship movement the distance of two subsequent measurements was approximately 100 m. Bottle samples for measuring salinity in the lab were collected in 1 L glass bottles and determined with a lab salinometer (8410A Portable Salinometer, OSIL, UK). The lab salinometer was calibrated at the beginning and at the end of each run by certified reference material. An example of validation of the salinity data by analysis of bottle samples is shown in Fig. 2 from three cruises in 2005. The agreement with the underway measurements of the FerryBox was always very good and the uncertainty (root mean square error) was 0.08 %, which means an error of ±0.03 PSU at 35 PSU.
The oxygen sensor (Clark electrode) was regularly calibrated against 100 % water-saturated air during maintenance intervals. According to the manufacturer, the accuracy is ±1 % of the measured value. In the field the accuracy was in the order of 1–2 %. As biofouling was prevented by automated regular cleaning of the entire system the oxygen sensor remained quite stable between the maintenance intervals. Underway oxygen samples (Winkler samples) could not be taken because this requires manual sampling and the system was always operated unattended during the cruises. From October 2004 a second oxygen sensor (optode, Aanderaa) was installed for first testing this new type of oxygen sensor. However, here only the data from the Clark electrode are provided.
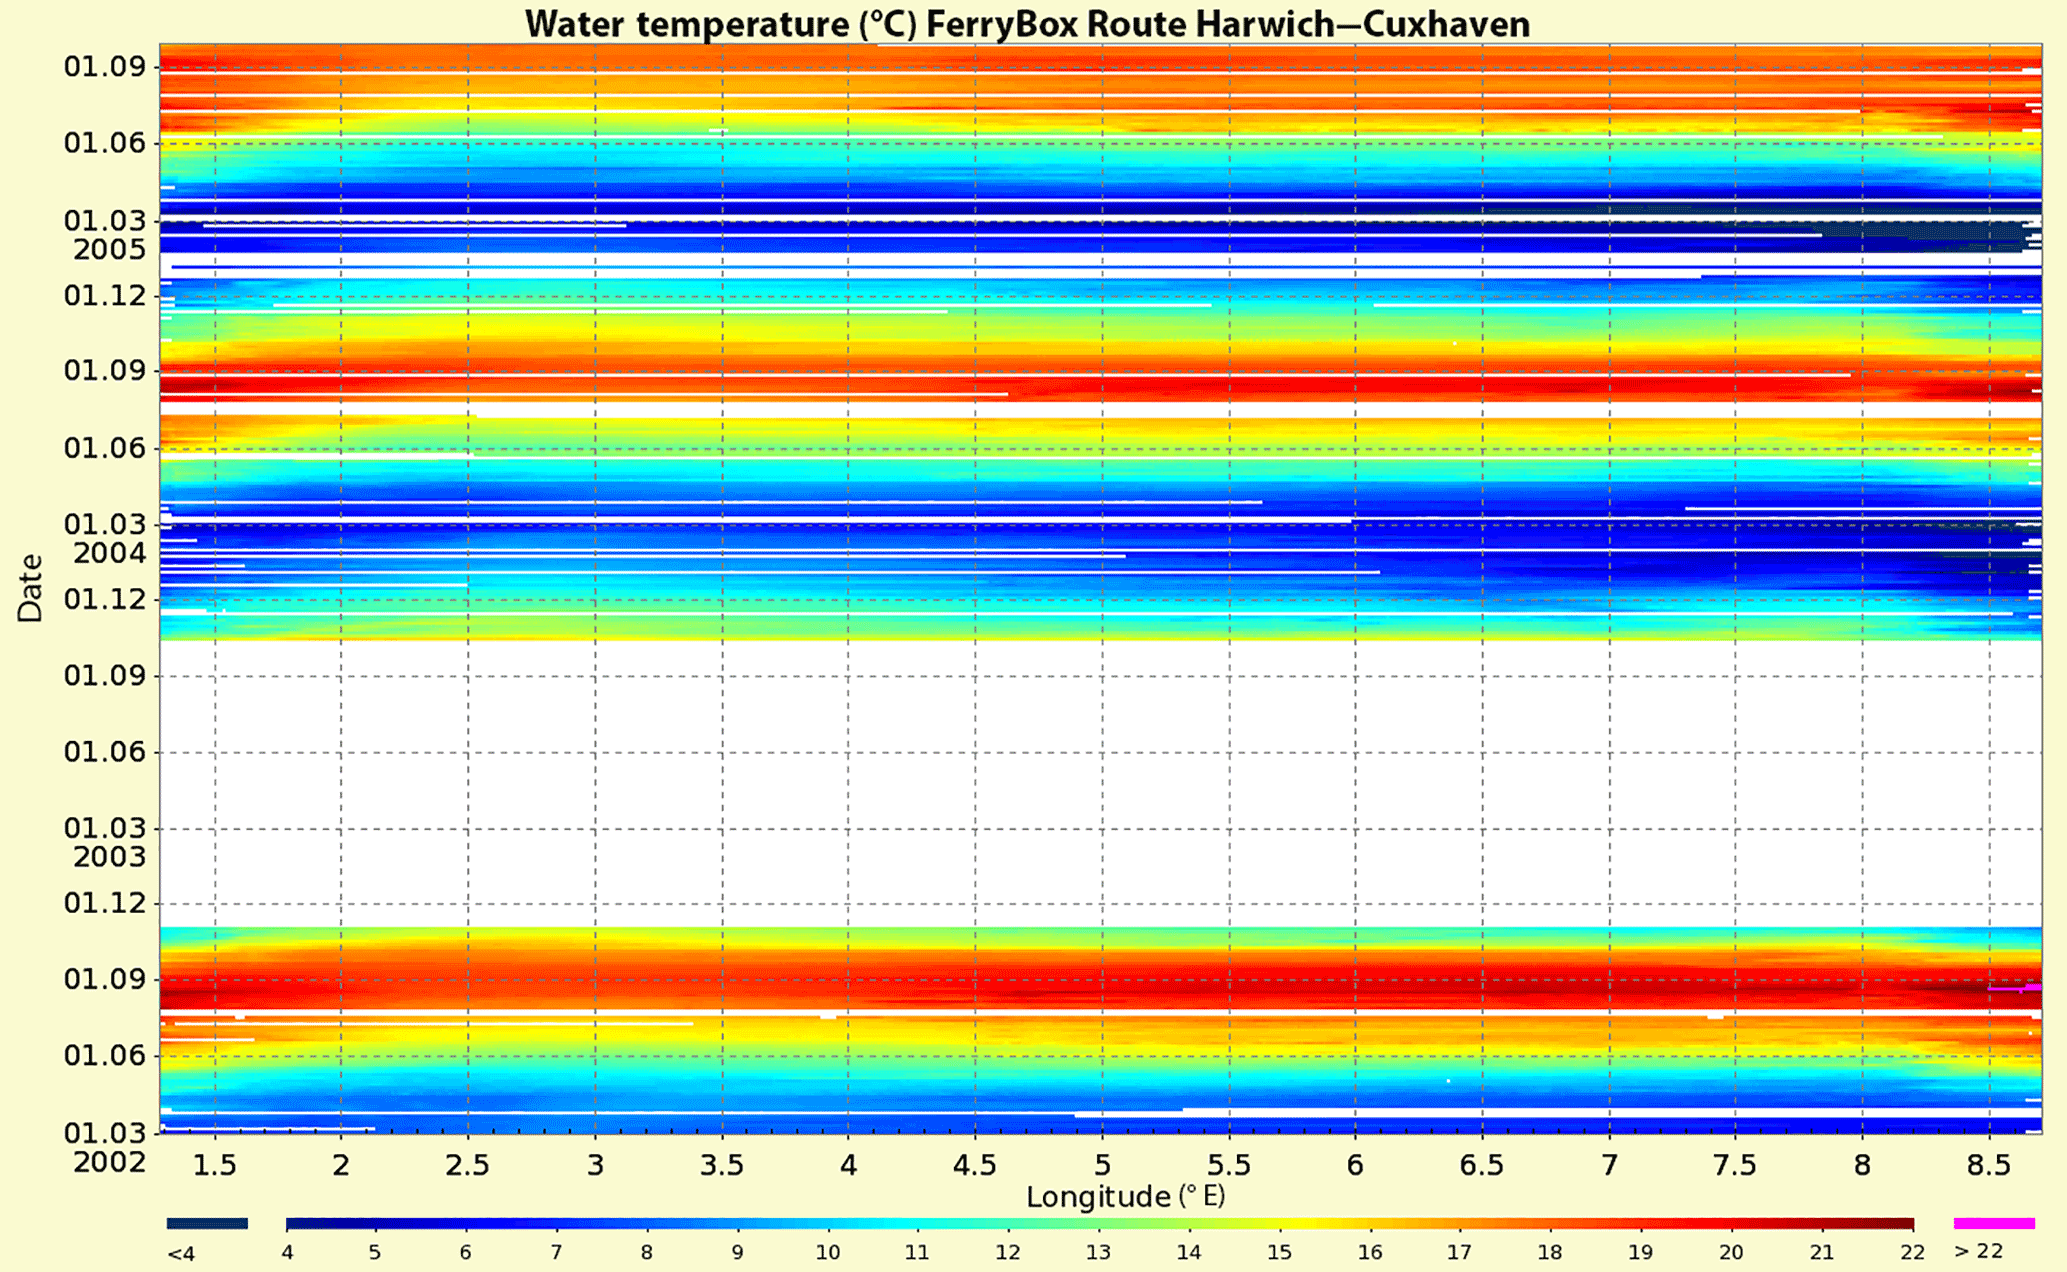
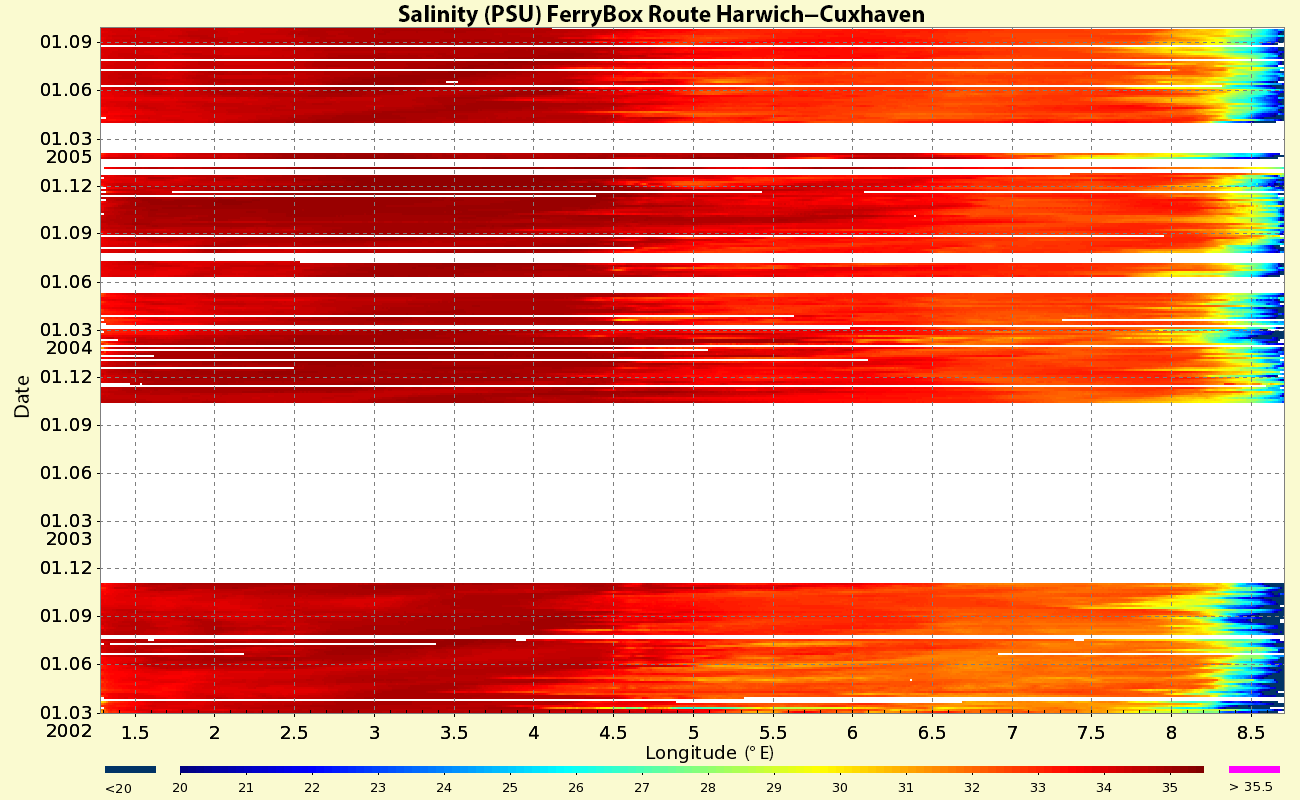
The data were imported into the HZG FerryBox database and are used as a part of COSYNA (Coastal Observing System for Northern and Arctic Seas) described in Baschek et al. (2017). Data are accessible via the COSYNA data portal (http://codm.hzg.de/codm, last access: September 2018) described in Breitbach et al. (2016) as well as by accessing the FerryBox database (http://ferrydata.hzg.de, last access: September 2018) directly. Figures 3 and 4 (water temperature and salinity), Figs. 5 and 6 (oxygen saturation and chlorophyll a fluorescence) and Fig. 7 (uncalibrated turbidity data from the SCUFA-II sensor) give an overview for all data using the scatter plot feature of the web interface of the FerryBox database. It is also possible to visualize transect data with the Sensor Observation Service (SOS) using the FerryBox database (e.g. SOS ferry data).
From the COSYNA database all data with the exception of the turbidity data (no calibration data available) were exported in netCDF format following OceanSites conventions2 to be compliant with CMEMS (Copernicus Marine Environment Monitoring Service). These netCDF files were used to import the data into PANGAEA (https://www.pangaea.de, last access: September 2018). These data were quality-controlled by applying automatic tests for spikes, for reliable range and for position. Furthermore, the data were manually checked for disturbances by air bubbles and for control parameters to be within the tolerance limits. All data are flagged compliant to SeaDataNet quality control standards3 (meaning of the flags: 0 is no quality check, 1 is good data, 2 is probably good data, 3 is bad data, potentially correctable, 4 is bad data).

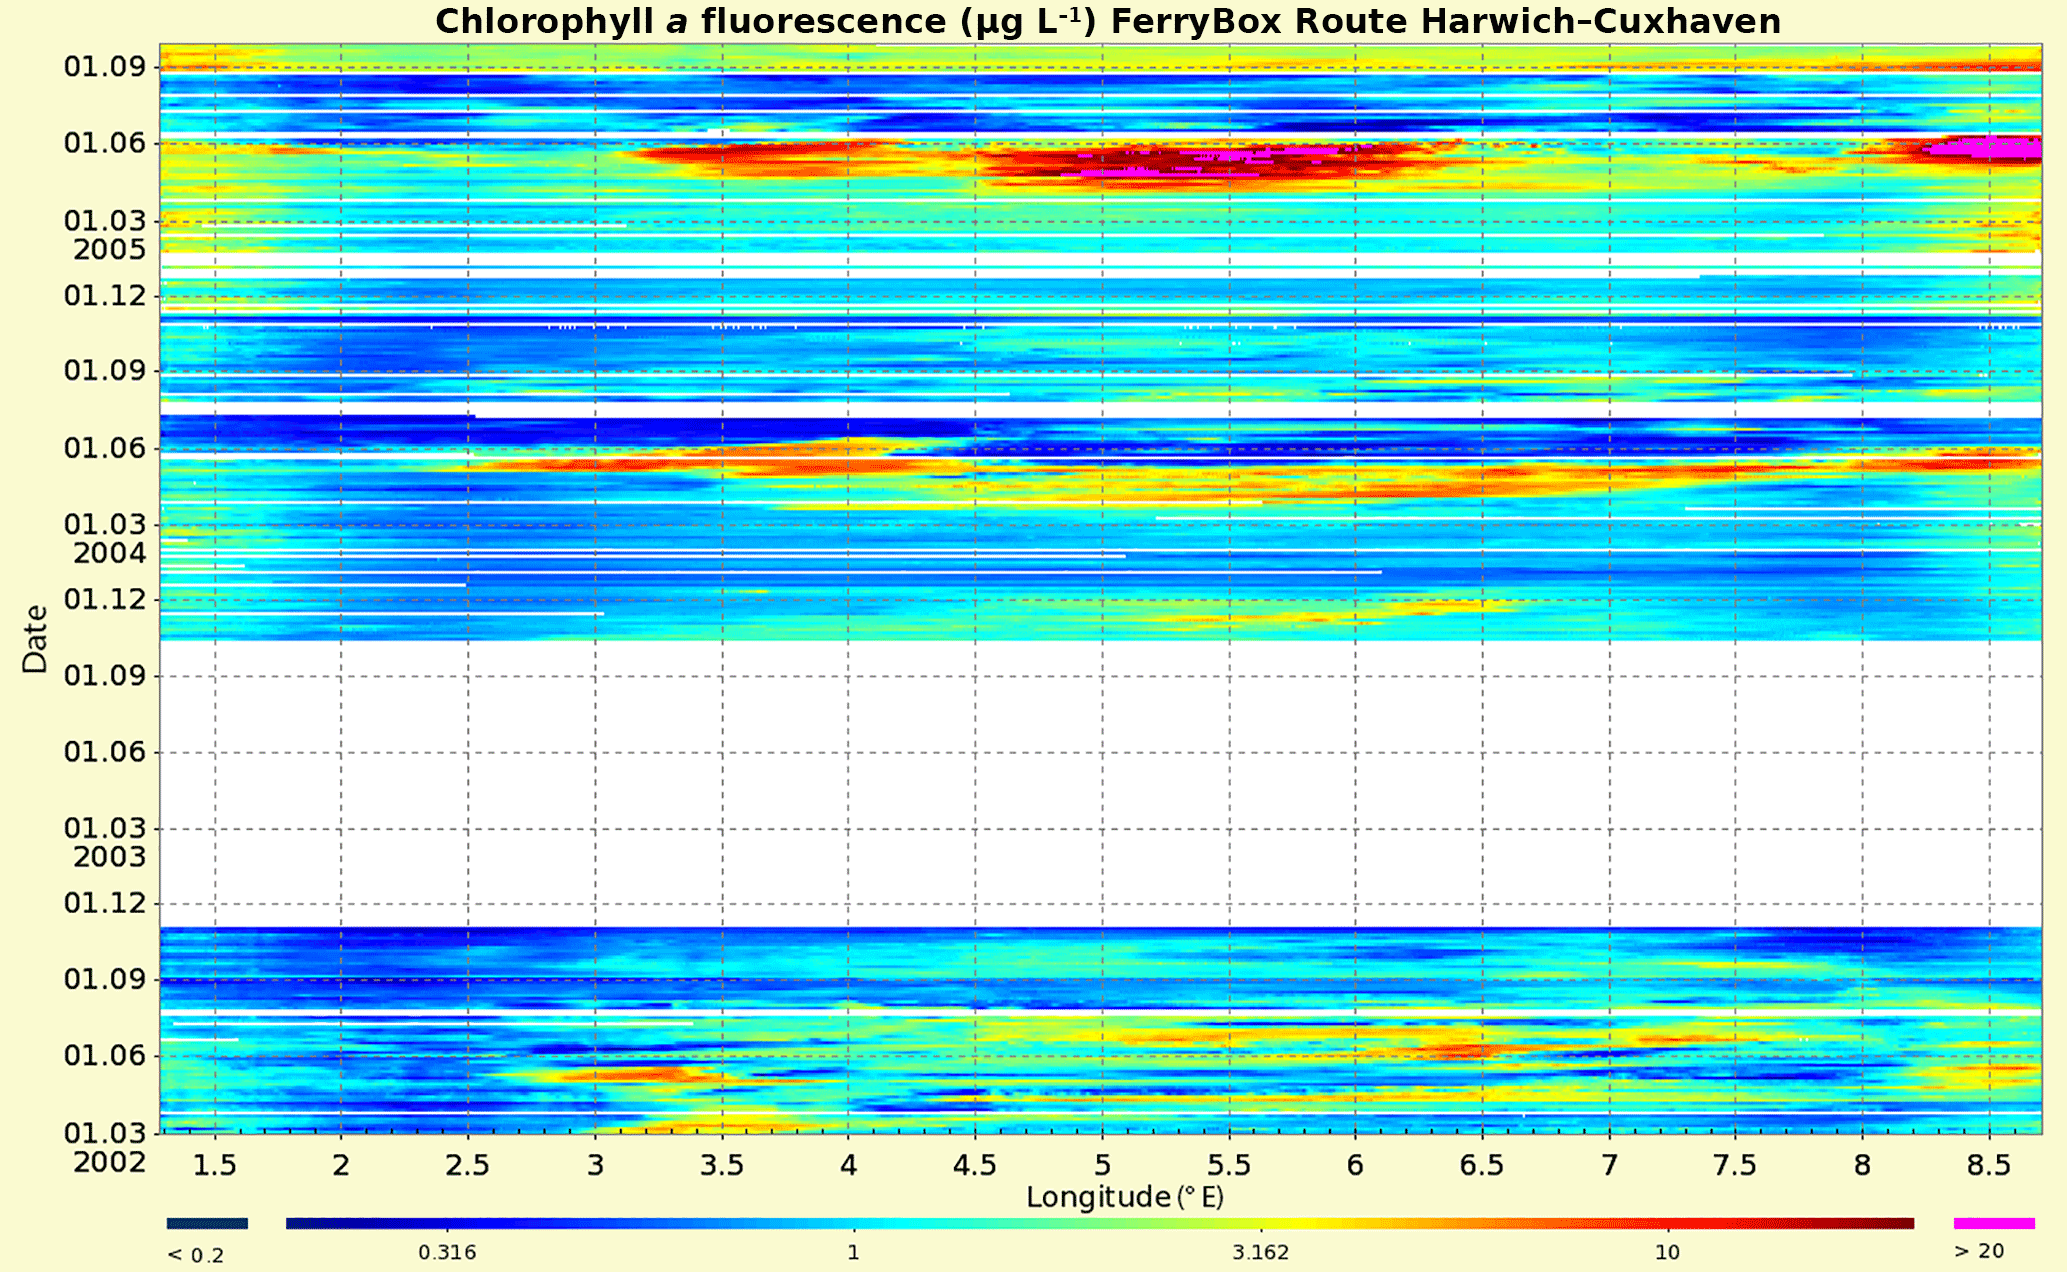
Figure 6Chlorophyll a fluorescence along the route Harwich–Cuxhaven. Pooled data from all transects.
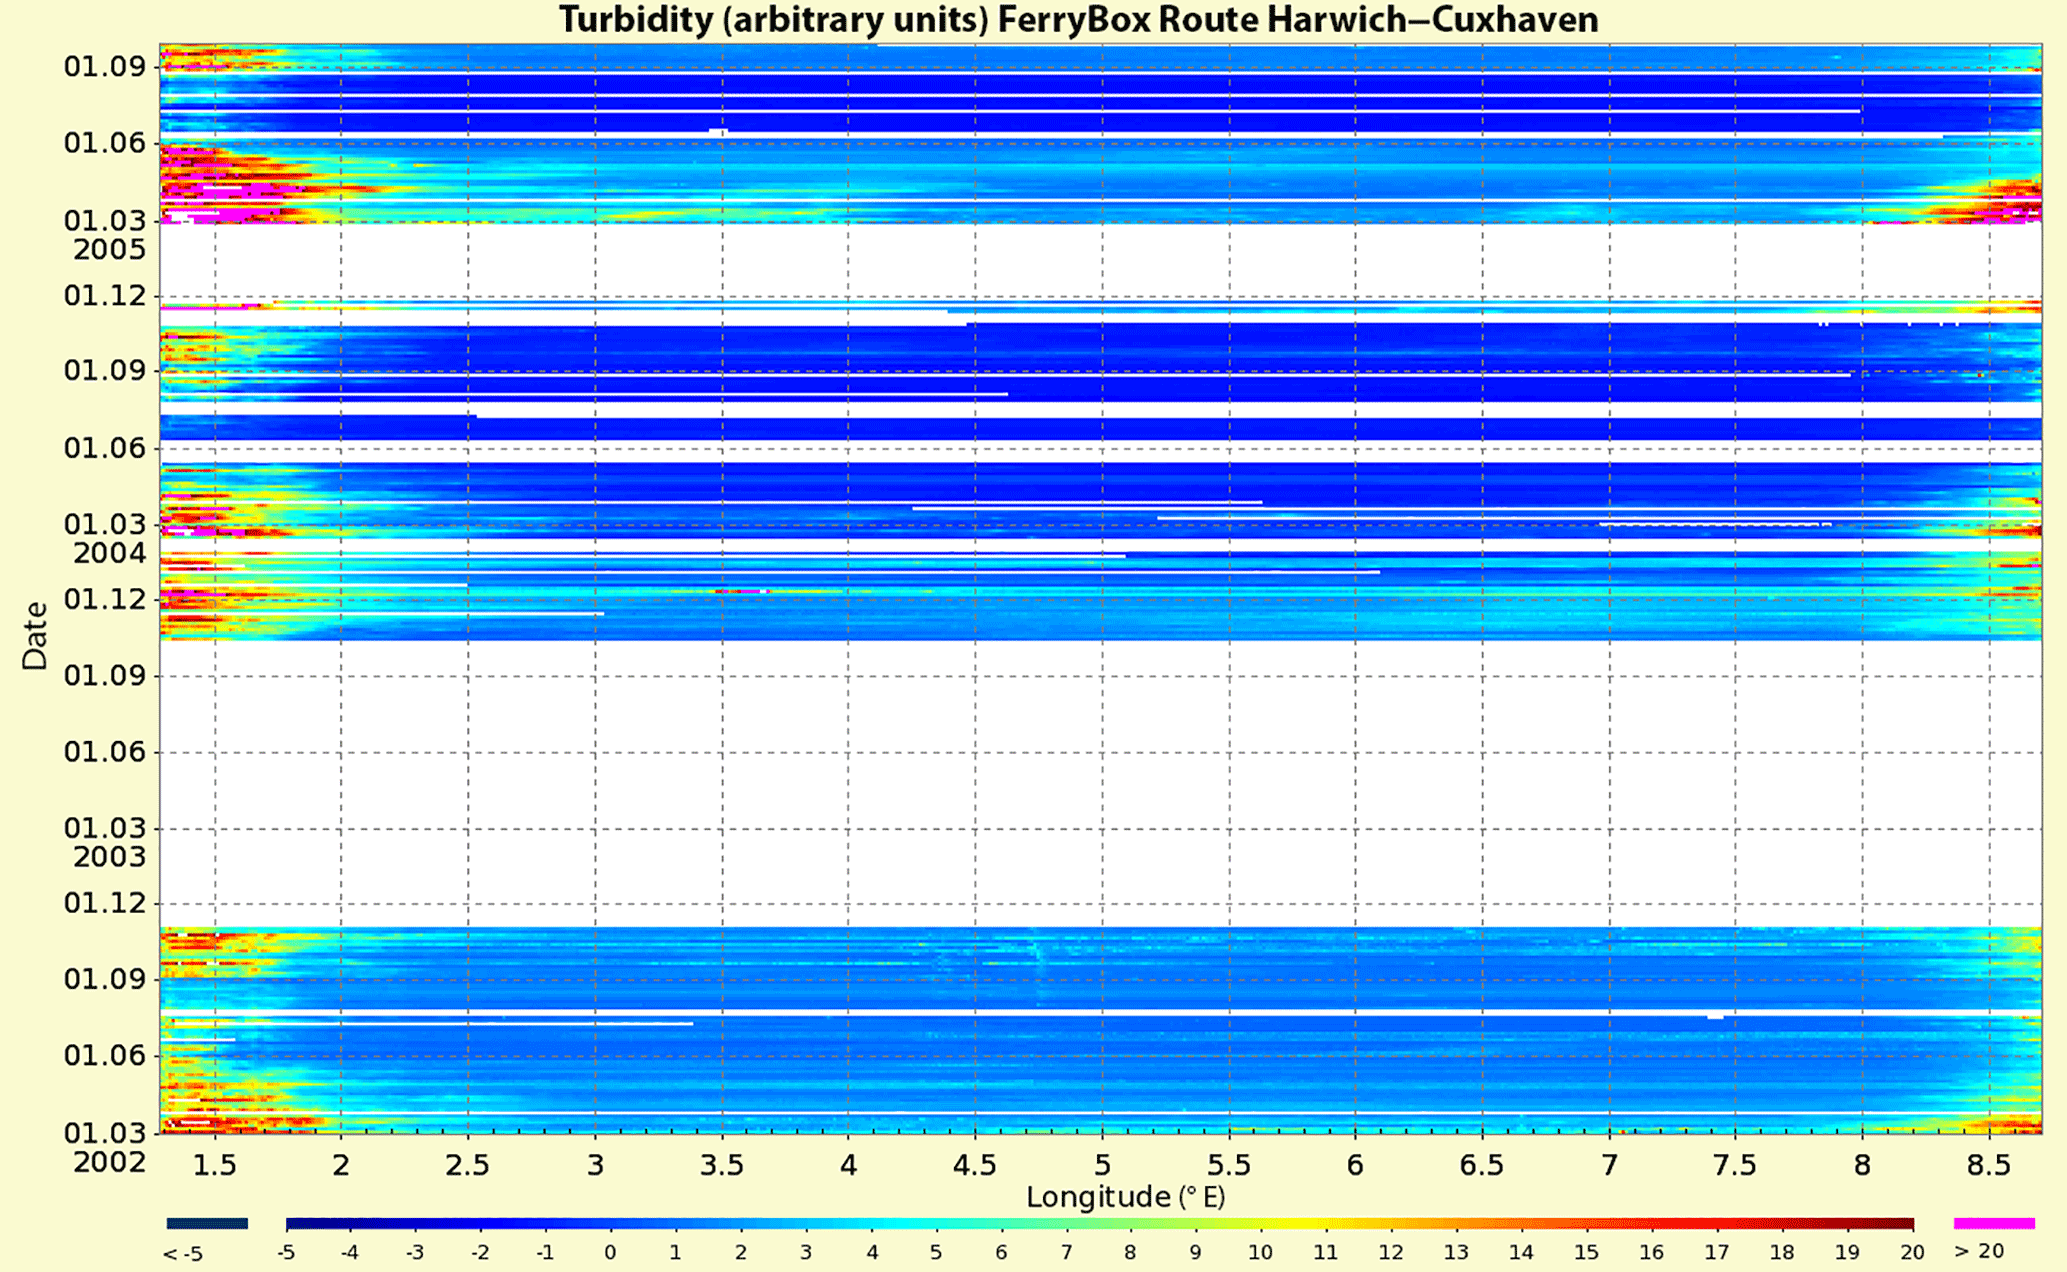
Figure 7Turbidity (SCUFA-II sensor) along the route Harwich–Cuxhaven. Pooled data from all transects.
The figures depict typical seasonal and yearly recurring patterns which can be described as follows: the pooled salinity data show high salinities year-round in the open North Sea and waters in the English Channel region. Close to the River Elbe estuary (>8.3∘ E) salinity decreases. In 2005, no salinity data are available between early February and the beginning of April due to malfunction of the salinity sensor.
Water temperature shows a typical seasonal signal with lowest values in January and February. In spring (April), temperatures increase rapidly, with higher values close to the shore and lower values in the region influenced by the English Channel (2–4∘ E). In mid-September the temperature decreases slowly, with a stronger decrease in the shallow regions.
A typical feature observed in the chlorophyll a fluorescence data of all surveyed years is the phytoplankton spring bloom off the Dutch coast (4.5–6.5∘ E) that starts between April and May when light intensity increases. At that time, nutrients that have accumulated during winter provide ample resources while rising water temperature and low wind stress increase stratification and allow rapid phytoplankton growth. Shortly after its development, the spring bloom spreads eastwards along the Dutch–German coast. By July, when most of the nutrients have been consumed and concentrations are too low to sustain copious production, only a small chlorophyll a signal remains. A different situation can be observed in front of the Elbe estuary (7.5–8.7∘ E), where algae blooms also occur in early summer. This most likely results from the high nitrate input of the River Elbe and the release of ammonia and phosphate from Wadden Sea sediments.
Oxygen supersaturation in spring generally correlates with the chlorophyll a fluorescence pattern due to primary production, while oxygen undersaturation occurs in areas where bacterial consumption is associated with decaying algal blooms. However, in the second half of May, oxygen supersaturation is evident in regions that are influenced by the English Channel (1–4∘ E), although chlorophyll a fluorescence is still low. This observation suggests that the primary production was below the water inlet of the vessel at that time, probably due to stratification, while oxygen diffused upward.
For turbidity only, the data from the SCUFA-II sensor are shown as the second turbidity sensor (TurbiMax, Endress&Hauser, Germany), which was installed close to the bottom of the debubbler, was much disturbed by air bubbles. Turbidity shows higher values in the turbidity zone of the Elbe estuary but also close to the English coast. Seasonally higher values are observed close to the shore in the wintertime and early spring, probably caused by more intensive rainfall and subsequent higher runoff of the rivers, which in addition shifts the zones with higher turbidity further outwards.
All data are assessable via the PANGAEA data portal (https://doi.org/10.1594/PANGAEA.883824, Petersen et al., 2017).
The presented data set is a team product of technicians and scientists with quite overlapping activities. Therefore, the contributions cannot be attributed to specific names.
The authors declare that they have no conflict of interest.
The authors would like to thank DFDS Seaways (Copenhagen, Denmark) for the
opportunity to operate a FerryBox on board of the vessels Admiral of Scandinavia and the Duchess of Scandinavia. We also thank the crew
on board for their valuable support. The authors appreciate the efforts of Nils Haëntjens and two
anonymous reviewers for thoroughly editing and improving the manuscript.
The article processing charges for this open-access
publication were covered by a Research
Centre of the Helmholtz Association.
Edited by: Robert Key
Reviewed by: Nils Haëntjens and two anonymous referees
Baschek, B., Schroeder, F., Brix, H., Riethmüller, R., Badewien, T. H., Breitbach, G., Brügge, B., Colijn, F., Doerffer, R., Eschenbach, C., Friedrich, J., Fischer, P., Garthe, S., Horstmann, J., Krasemann, H., Metfies, K., Merckelbach, L., Ohle, N., Petersen, W., Pröfrock, D., Röttgers, R., Schlüter, M., Schulz, J., Schulz-Stellenfleth, J., Stanev, E., Staneva, J., Winter, C., Wirtz, K., Wollschläger, J., Zielinski, O., and Ziemer, F.: The Coastal Observing System for Northern and Arctic Seas (COSYNA), Ocean Sci., 13, 379–410, https://doi.org/10.5194/os-13-379-2017, 2017.
Breitbach, G.: COSYNA Data web portal, re3data.org, https://doi.org/10.17616/R3K02T, 2018.
Breitbach, G., Krasemann, H., Behr, D., Beringer, S., Lange, U., Vo, N., and Schroeder, F.: Accessing diverse data comprehensively – CODM, the COSYNA data portal, Ocean Sci., 12, 909–923, https://doi.org/10.5194/os-12-909-2016, 2016.
Petersen, W., Petschatnikov, M., and Schroeder, F.: FerryBox systems for monitoring coastal waters, in: Third International Conference on EuroGOOS, edited by: Dahlin, H., Flemming, N. C., and Nittis, K., Elsevier Oceanography Series Publication, Amsterdam, The Netherlands, 325–333, 2003.
Petersen, W.: FerryBox Systems: State-of-the-Art in Europe and Future Development, J. Mar. Sys., 140, 4–12, doi:10.1016/j.jmarsys.2014.07.003, 2014.
Petersen, W., Reinke, S., Breitbach, G., Thomas, H., Petschatnikov, M., and Wehde, H.: Ferrybox record of transect Cuxhaven-Harwich 2002-03 to 2005-10 in NetCDF-format, available at: https://doi.org/10.1594/PANGAEA.883824, 2017.
https://www.seadatanet.org (last access: September 2018)
http://www.oceansites.org/docs/oceansites_data_format_reference_manual.pdf (last access: September 2018)
https://www.seadatanet.org/Standards/Data-Quality-Control, last access: September 2018