the Creative Commons Attribution 4.0 License.
the Creative Commons Attribution 4.0 License.
 | 13 Nov 2018
Generation and analysis of a new global burned area product based on MODIS 250 m reflectance bands and thermal anomalies
Joshua Lizundia-Loiola
Maria Lucrecia Pettinari
Ruben Ramo
Marc Padilla
Kevin Tansey
Florent Mouillot
Pierre Laurent
Thomas Storm
Angelika Heil
Stephen Plummer
This paper presents a new global burned area (BA) product, generated from the Moderate Resolution Imaging Spectroradiometer (MODIS) red (R) and near-infrared (NIR) reflectances and thermal anomaly data, thus providing the highest spatial resolution (approx. 250 m) among the existing global BA datasets. The product includes the full times series (2001–2016) of the Terra-MODIS archive. The BA detection algorithm was based on monthly composites of daily images, using temporal and spatial distance to active fires. The algorithm has two steps, the first one aiming to reduce commission errors by selecting the most clearly burned pixels (seeds), and the second one targeting to reduce omission errors by applying contextual analysis around the seed pixels. This product was developed within the European Space Agency's (ESA) Climate Change Initiative (CCI) programme, under the Fire Disturbance project (Fire_cci). The final output includes two types of BA files: monthly full-resolution continental tiles and biweekly global grid files at a degraded resolution of 0.25∘. Each set of products includes several auxiliary variables that were defined by the climate users to facilitate the ingestion of the product into global dynamic vegetation and atmospheric emission models. Average annual burned area from this product was 3.81 Mkm2, with maximum burning in 2011 (4.1 Mkm2) and minimum in 2013 (3.24 Mkm2). The validation was based on a stratified random sample of 1200 pairs of Landsat images, covering the whole globe from 2003 to 2014. The validation indicates an overall accuracy of 0.9972, with much higher errors for the burned than the unburned category (global omission error of BA was estimated as 0.7090 and global commission as 0.5123). These error values are similar to other global BA products, but slightly higher than the NASA BA product (named MCD64A1, which is produced at 500 m resolution). However, commission and omission errors are better compensated in our product, with a tendency towards BA underestimation (relative bias −0.4033), as most existing global BA products. To understand the value of this product in detecting small fire patches (<100 ha), an additional validation sample of 52 Sentinel-2 scenes was generated specifically over Africa. Analysis of these results indicates a better detection accuracy of this product for small fire patches (<100 ha) than the equivalent 500 m MCD64A1 product, although both have high errors for these small fires. Examples of potential applications of this dataset to fire modelling based on burned patches analysis are included in this paper. The datasets are freely downloadable from the Fire_cci website (https://www.esa-fire-cci.org/, last access: 10 November 2018) and their repositories (pixel at full resolution: https://doi.org/cpk7, and grid: https://doi.org/gcx9gf).


Biomass burning is one of the key processes affecting vegetation productivity, land cover, soil erosion, hydrological cycles and atmospheric emissions (Kloster and Lasslop, 2017; Forkel et al., 2017; Gaveau et al., 2014; van der Werf et al., 2017). It has social implications as well, impacting people's lives and properties (Roos et al., 2016), particularly in the wildland–urban interface, where urban areas are intermixed with forests (Bowman et al., 2017).
Fire is affected by climate, as burning is associated with high to extreme weather conditions (particularly droughts and heatwaves) (Forkel et al., 2017). However, fire affects climate too, due to its impacts on carbon budgets and greenhouse gas emissions (van der Werf et al., 2017). These mutual influences between fire and climate explain why fire disturbance is considered one of the Essential Climate Variables (ECVs) by the Global Climate Observing System (GCOS) programme (GCOS, 2016). Several space agencies are working on developing systematic assessments of fire occurrence and fire impacts, as part of their efforts to improve the use of satellite data in climate modelling. This is the main purpose of the Fire_cci project (https://www.esa-fire-cci.org/, last access: July 2018), which is part of the European Space Agency's (ESA) Climate Change Initiative (CCI) programme (Hollmann et al., 2013; Plummer at al., 2017). The Fire_cci project aims to develop long-term time series of burned area (BA) products adapted to the needs of climate modellers (Chuvieco et al., 2016). In addition to global BA products, the Fire_cci project is generating a small fire database for the African continent based on medium-resolution sensors on board the Sentinel-2 and Sentinel-1 satellites.
Global BA information is required for many different applications (Mouillot et al., 2014). First, it helps to assess fire risk assessment, by comparing estimated risk conditions with actual fire occurrence (Marlier et al., 2013; Chuvieco et al., 2014). Burned area information is also a critical input of dynamic global vegetation models (DGVMs), as it provides an estimation of carbon emissions and vegetation succession (Lasslop et al., 2014). In conjunction with other human and physical variables, BA datasets are required to understand factors controlling fire activity (Forkel et al., 2017) and particularly those affecting changes in fire regimes (Hantson et al., 2015; Andela et al., 2017), with an increasing interest in fire patch identification derived from higher resolution pixel-level information (Laurent et al., 2018). Atmospheric emission models require precise information on spatio-temporal patterns of fire occurrence, as well as combustion characteristics (van der Werf et al., 2017; Knorr et al., 2016). Finally, BA information is needed to model fire impacts on human health (Reid et al., 2016) and the safety of properties (Moritz et al., 2014; Sturtevant et al., 2009).
A few global BA products have been developed in the last years. Two sensors have been particularly used to develop these global BA time series datasets: VEGETATION (VGT), on board the SPOT satellites since 1998, and Moderate Resolution Imaging Spectroradiometer (MODIS), on board the Terra and Aqua satellites since 2000 (https://modis.gsfc.nasa.gov/about/, last access: October 2018). The former images have been used to create BA products funded under different European projects: L3JRC (Tansey et al., 2008), Globcarbon (Plummer et al., 2006) and Copernicus GIO_ GL1_BA burned area products, all at 1000 m spatial resolution (after 2013 the Copernicus product is available at 333 m resolution and is derived from Proba-V data: http://proba-v.vgt.vito.be/en, last access: October 2018). The MODIS sensor has been used to generate two global BA time series, the MCD45A1 and the MCD64A1. Both provide BA detections at 500 m from 2000 to the present. The MCD45A1 was derived from a change detection algorithm based on a bidirectional reflectance model (Roy et al., 2008), while the MCD64A1 is derived from a hybrid algorithm that uses both the reflectance changes and the thermal anomalies associated with biomass burning (Giglio et al., 2009, 2018). The latest version of this algorithm is the basis for the now standard MODIS BA product, which is the MCD64A1 collection 6 (c6) (https://lpdaac.usgs.gov/dataset_discovery/modis/modis_products_table/mcd64a1_v006, last access: October, 2018). From the BA detections of the MCD64A1 product with additional variables on fuel properties and emission coefficients, the Global Fire Emissions Database (GFED) was first created in 2005. The current version is named GFED4, and includes data from the MCD64A1 collection 5 (c5) product, as well as from the Along Track Scanning Radiometer (ATSR) sensor (on board the European Remote Sensing satellites) for the pre-MODIS era (1995–2000). The GFED4s adds an estimation of the area burned by small fires (not detected by the MCD64A1), which is derived from the relation between the number of hotspots and burned patches (van der Werf et al., 2017). Generally, small fires are considered as those below the detection threshold of coarse-resolution sensors (for instance, smaller than 100 ha).
Finally, ENVISAT MERIS images have also been used for generating global BA products, with a shorter time series than VGT and MODIS (just for the period when MERIS archives provide enough input data: 2005–2011), but with higher spatial resolution (300 m) (Chuvieco et al., 2016; Alonso-Canas and Chuvieco, 2015). This product was named FireCCI41, and is the main precursor of the one presented in this paper. Previous versions of Fire_cci BA products, based on this or other ESA sensors, were only prototypes and are not publicly available.
This paper presents a new global BA product based on the highest spatial-resolution bands of the MODIS sensor (R, red, and NIR, near-infrared), at approximately 250 m pixel size (6.25 ha). We have named this product FireCCI50 throughout the paper. The number 50 stands for version 5.0 of the Fire_cci BA products. The former versions were derived from MERIS images (Chuvieco et al., 2016). Therefore, FireCCI50 is the first version of Fire_cci BA products based on the MODIS sensor. The goal of generating this product was to complement existing global BA datasets using higher spatial-resolution bands. The paper describes the BA algorithm used for generating the FireCCI50 product, presents a spatio-temporal validation of the results, compares estimations with existing BA products (FireCCI41, GFED4 and MCD64A1 c6) and describes an example of using our product for fire-related climate models.
2.1 Algorithm design
The main inputs for developing the FireCCI50 product are the MOD09GQ and the MCD14ML datasets, both from collection 6. The MOD09GQ reflectance product includes the daily red (R) and near-infrared (NIR) corrected reflectances of the Terra-MODIS bands 1 and 2, respectively, both at approximately 250 m resolution in sinusoidal projected tiles of 1200×200 km. Pixel quality information was obtained from the MOD09GA product, as recommended by the MODIS Science team (https://lpdaac.usgs.gov/dataset_discovery/modis/modis_products_table/mod09ga_v006, last access: July 2018). Additionally, our algorithm used the MODIS thermal anomalies product (MCD14ML: http://modis-fire.umd.edu/pages/ActiveFire.php?target=MCD14ML, last access: July 2018), which includes active fires (named here hotspots, HSs), detected from the sensor's middle infrared and thermal channels at 1 km resolution (Giglio et al., 2016).
Daily images were aggregated into monthly composites to select the pixels most clearly associated with a burned signal. This approach has been commonly applied in BA mapping studies (Barbosa et al., 1998; Chuvieco et al., 2005) as it reduces potential confusion caused by clouds, cloud shadows or angular effects (Roy et al., 2005). As the MOD09GQ 250 m product does not contain bidirectional reflectance distribution function (BRDF) corrections, we tested several correction models, but none reported satisfactory results, as they greatly smoothed the burned signal in some biomes. The monthly composites of daily reflectance are less affected by angular effects, although this to some extent compresses the burned signal.
To create the monthly composites, first pixels with low-quality observations (cloud, cloud shadows) taken from MOD09GA QA (quality assessment) were discarded, as well as pixels with land covers considered not to be burnable. These comprised water, bare areas, permanent snow and ice and urban areas. This information was derived from the Land Cover CCI product version 1.6.1, using three epochs corresponding to 2000, 2005 and 2010, and at a similar spatial resolution of approx. 300 m (Kirches et al., 2013: https://www.esa-landcover-cci.org/, last access: July 2018).
The composite criterion was based on the HS dating. It was assumed that the closest day to the nearest hotspot would be the most adequate to obtain the post-fire reflectances. Although composites include 30 days, for areas with HSs dated on the latest days of the monthly period, 10 extra running dates (including images from the next month) were used to have enough post-fire observations for creating the composites. After creating Thiessen polygons with the HS location and labelling them with the HS date, the algorithm selected the closest date among the three daily images with the minimum NIR monthly reflectance. The actual date was selected based on whether the three minimum NIR values occurred before or after the HS date. If all three were acquired before or after the HS date, the date of the second lowest was selected. In this way, clouds' shadows or smoke not included in the QA would not affect the composite. When one or two were acquired after the HS, the closest date to the HS was selected. Finally, the monthly composites were generated taking the R and NIR reflectances for the selected dates. From these two bands, the Global Environmental Monitoring Index (GEMI: Pinty and Verstraete, 1992) was computed as
where ρNIR is the NIR reflectance (band 2 of the MOD09GQ product) and ρR the R reflectance (band 1). This index has been previously used in burned area detection from R and NIR channels (Barbosa et al., 1999; Chuvieco et al., 2002; Pereira, 1999).
The BA algorithm followed a two-phase approach, detecting in the first phase the most clearly burned pixels (named seeds) and improving the burn shape detection in the second phase, using a growing procedure around the seed pixels. The former phase aims to reduce the commission errors, while the latter the omission errors. This approach has been widely used in BA detection algorithms (Alonso-Canas and Chuvieco, 2015; Bastarrika et al., 2011; Chuvieco et al., 2008). In addition, the algorithm is spatially adaptable, as it collects statistics from each MODIS tile to generate the detection thresholds.
The seed phase began with positioning the HS within a 5×5 pixel window of the MOD9GQ product, as the HS product included the centre coordinates of a 1 km2 area. The pixel with the minimum NIR within each window around a HS was selected as the best candidate for having a recent burn. Cumulative distribution functions (CDFs) of unburned and potentially burned areas were created to define adaptive thresholds to cope with the wide variety of global fire conditions. To reduce potential noise, HSs were only considered as potential burns when the NIR was lower than the previous month and the NIR value was lower than the 10 % threshold of the unburned pixels' CDF. Seeds were considered as those having a low NIR value (extracted from the CDF of potential burns), a decrease in NIR value, and at least one HS in the surrounding 3×3 pixel window.
The growing phase included several criteria to add new burned pixels to each burned patch created in the first phase. Within each iteration, candidate pixels had to be neighbours of seed burns (or pixels detected as burned in the previous iteration), with an NIR value below a CDF threshold of the potentially burned pixels, and showing a decrease in NIR values from the previous month. In this growing phase, an additional threshold based on the CDFs of GEMI values (Eq. 1) for burned and unburned areas was also used. The process was iterated until no further pixels were added to each burned patch. Finally, a morphological filter with two steps of erosion–dilation was applied to eliminate small patches of burned pixels or small islands of unburned pixels within burned patches.
2.2 Product specifications
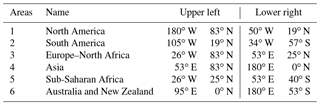
As the result of a user requirement analysis, two BA datasets (pixel and grid) were generated for the FireCCI50 product. Both were provided in geographical coordinates. The pixel products include the date of detection (0–366), the uncertainty of the estimation (0–100) and the land cover affected by the fire (taken from the Land Cover CCI product of a similar time period). Pixel products had the full resolution of the MODIS input images. Monthly files were generated to avoid missing double burns in a single year. The output datasets were created in a GeoTIFF format and comprised quasi-continental tiles (Table 1).
Table 1Geographical distribution of BA tiles for the pixel product.
The grid product was produced for biweekly periods and incorporated 23 layers at 0.25∘ resolution: sum of burned area (m2), standard deviation of the estimation (m2), fraction of burnable area (0–1), fraction of observed area (0–1), number of burned patches (0−N) and sum of burned area in 18 land cover classes (again taken from the Land Cover CCI product). The output datasets are NetCDF CF files (http://www.unidata.ucar.edu/software/netcdf/docs, last access: July 2018).
The uncertainty layer represents the probability that each pixel was correctly classified as burned. It was derived from four input layers related to the BA detection algorithm: the number of daily images to build the monthly composite, the percentile of the NIR reflectance in the CDF of burned and unburned pixels, the CDF of the GEMI differences and the distance to the closest HS. These variables were normalized and combined to obtain the pixel confidence level, from which the standard error of the grid product was calculated. The fraction of burnable area was computed from the land cover CCI product, while the fraction of observed area from the monthly integrated values of the MODIS QA data. The burned patches were computed considering as a patch a group of contiguous burned pixels with burn detection date differences shorter than 15 days. This criterion has been commonly used for the global characterization of burned patches (Hantson et al., 2015).
2.3 Validation methods
The accuracy assessment was based on a stratified random sample of reference data distributed across the globe and across 12 years, 2003–2014. This is the most comprehensive assessment of burned area estimation accuracy ever reported and aims to meet the requirements of the CEOS CalVal Level 3 criteria. For comparison purposes, additionally to the product version presented here, the validation analysis included the FireCCI41 product (Chuvieco et al., 2016), based on MERIS images, and the most recent NASA BA product (MCD64A1,c6).
Reference data were generated from pairs of medium-resolution (20–50 m) satellite images as recommended by the CEOS CalVal protocol (Boschetti et al., 2009). Burned patches observed between pairs of Landsat 5, 7 and 8 images were mapped with a semi-automatic classification algorithm. The algorithm was based on a random forest classifier (Breiman, 2001; Pedregosa et al., 2011), which is a robust classifier used for land cover change detection (Wessels et al., 2016) and is increasingly being used in burned area mapping (Ramo and Chuvieco, 2017). The classification made by one interpreter was systematically reviewed by another. Any discrepancies were rectified and the revision repeated iteratively until no new differences were detected.
The sampling units were defined spatially by Thiessen scene areas (TSAs) constructed by Cohen et al. (2010) and Kennedy et al. (2010), and temporally by the dates of Landsat imagery available. The population of sampling units was stratified by calendar years, the biomes as defined by Olson et al. (2001) and BA as detected by MCD64A1 c5 (collection 6 was not yet released when validation started). Each year-biome stratum was divided into two parts using BA thresholds designed to minimize the expected variance of BA given the available sample size. The yearly sampling size was fixed to 100 (for 12 years, 2003 to 2014, 1200 in total) and was allocated across strata proportionally to MCD64A1 BA data. Details on the sampling strategy and comparisons between several options of stratification and sample allocation can be found in Padilla et al. (2017).
Each sampling unit selected was subsampled by a spatial cluster of pixels on a 30 km × 20 km window. This subsampling stage allowed the amount of reference data generated to be reduced for a given year. This, in turn, allowed the probability sampling design to be expanded to a multi-year period (12 years). This is the first time the temporal variation of global BA products accuracy is reported.
Accuracy measures, based on the error matrix approach (Congalton and Green, 1999), were computed. Since the burned category is much less frequent than the unburned, the overall accuracy was not considered, as it is strongly influenced by the proportion of the unburned pixels. Instead, the omission and commission error ratios were computed, as well as the Dice coefficient (DC) and the relative bias of the burned category. The DC is defined as the probability that one classifier (product or reference data) identifies a pixel as burned given that the other classifier also identifies it as burned (Fleiss, 1981).
where E11 is the area correctly classified according to the reference and E1+ and E+1 are the BA reported by the product and reference data respectively. Relative bias is computed as the ratio of the difference between omission and commission errors and the true burned pixels. The formulae of accuracy measures can be found in Padilla et al. (2015). The details of the sampling design and the formulae used to infer accuracy at the global scale, for the whole time period of study and on a yearly basis, can be found in the validation report of the Fire_cci project (see technical documents at https://www.esa-fire-cci.org/documents, last access: October 2018). As explained above, each year is delimited by a group of strata (delimited by biomes); therefore the same formulae used for the whole population can be used to infer accuracy for each year. Estimates of accuracy were computed taking into account the stratified sampling design, using a stratified combined ratio estimator, and taking into account the fact that sampling units are of unequal sizes and they are subsampled (Cochran, 1977).
In addition to the spatio-temporal validation sample, a different sample of 52 Sentinel-2 MultiSpectral Instrument (MSI) scenes was processed as a first assessment on whether the product was more sensitive than MCD64A1 c6 product in the detection of small fires (<100 ha). This fire size validation sample was initially derived to evaluate a BA algorithm for MSI images in Africa (Roteta et al., 2018; Bastarrika and Roteta, 2018). The 52 MSI images were acquired in the fire season from December 2015 to September 2016. The scenes were selected by systematic sampling of sub-Saharan Africa, excluding areas that are not burnable. The reference fire perimeters were produced by a semi-automatic algorithm (Bastarrika et al., 2014) and later visually revised by another interpreter. The detected fire perimeters were dated with Visible Infrared Imaging Radiometer Suite (VIIRS) hotspots to compare fire patches with those detected by the global products. Fire perimeters were classified into five fire size categories: <1, 1–5, 5–25, 25–100 ha and more than 100 ha.
2.4 Product intercomparison
Spatial and temporal trends of the FireCCI50 were compared with existing global BA products. We selected products that are currently operational: the BA of the GFED4, widely used for fire emissions, and the MCD64A1 c6, now the standard NASA BA product. For comparison with outputs from the CCI project, the MERIS Fire_cci v4.1, with its shorter time series (2005–2011), was also assessed. Global temporal trends of these products were generated. Spatial comparison between products was performed at 0.25∘ resolution.
In addition, BA detections were compared with existing databases of fire perimeters, given the importance of understanding performance against established approaches by national fire agencies. Three sites representative of different fire regimes were selected: boreal forest, selecting the h12v03 MODIS tile located in Manitoba and Saskatchewan (fire perimeters were downloaded from the Canadian Wildland Fire information System: http://cwfis.cfs.nrcan.gc.ca/ha/nfdb/, last access: July 2018); tropical woodlands and savannas, selecting the h30v10 MODIS tile located in northern Australia (fire perimeters were downloaded from the North Australia and Rangelands Fire Information database: http://www.firenorth.org.au/nafi3/, last access: July 2018); and temperate forest, including the h08v05 MODIS tile intersecting the state of California (fire perimeters were obtained from the Fire and Resource Assessment program's web page: http://frap.fire.ca.gov, last access: July 2018). These perimeters were mainly obtained from Landsat images for the Canadian and Californian databases and MODIS 250 m resolution for the Australian one. In all cases, fire perimeters were verified by visual interpretation and field reports. We downloaded data from four different years, covering the full fire season. Comparison of national fire perimeters with satellite BA products has been widely used as a first assessment of product performance (Mangeon et al., 2016; Moreno Ruiz et al., 2014; Boschetti et al., 2015). However, we used national fire perimeters in this paper to compare our results with existing official fire statistics, rather than as a validation strategy.
2.5 Product assessment: fire patch analysis
As an example of the potential uses of the FireCCI50 product in fire modelling, a fire patch morphological analysis was carried out. The input data were the pixel-level products, which were converted to fire patches based on a spatio-temporal aggregation process. The same methods used to generate the FRY database (Laurent et al., 2018) were applied. Individual fire patch indices, such as the fire patch area and the so-called shape index (SI), defined by the ratio between the perimeter P and the square root of the of the patch area A (SI = ), were considered. The shape index allows the investigation of (i) the ability of the product to identify individual fire patches and capture their power-law size distribution following the self-criticality hypothesis (Hantson et al., 2015), and (ii) how the resulting fire patch shape improves with finer resolution to better capture spreading processes and impacts on post-fire vegetation dynamics as proposed by Nogueira et al. (2017) and Chuvieco et al. (2016) for pixel-level global remote sensing product assessment. This analysis was based on a comparison of metrics derived from the FireCCI50 and the MCD64A1 c6 products globally. In addition, a regional comparison with the same methods was performed between both global products and a Sentinel-2 (20 m) BA product generated within the Fire_cci project for northern hemispheric tropical Africa for 2017 (Roteta et al., 2018; Bastarrika and Roteta, 2018).
Fire size distribution was characterized by the slope β of the fire number to fire size relationship (log scale). The slope was adjusted using the same methodology as in Laurent et al. (2018). Grid cell to grid cell correlations accounting for spatial autocorrelation of both products were implemented with a modified t test of spatial association based on Clifford et al. (1989) and Dutilleul et al. (1993), and performed with the modified.ttest function of the “SpatialPack” R Cran Package (https://CRAN.R-project.org/package=SpatialPack, last access: July 2018). In order to assess the level of similarity between the products, it was also necessary to compare the same fire size category between the two products. This is why a threshold of 107 ha was applied on fire size: this threshold corresponds to the size of a 5 pixel fire patch at the Equator for the MCD64A1 c6 product (the Plate Carreé projection product of the GeoTIFF MCD64 product was used for this analysis: http://modis-fire.umd.edu/files/MODIS_C6_BA_User_Guide_1.0.pdf, last access: July 2018), corresponding to the minimum size of fire patch provided by the FRY database.
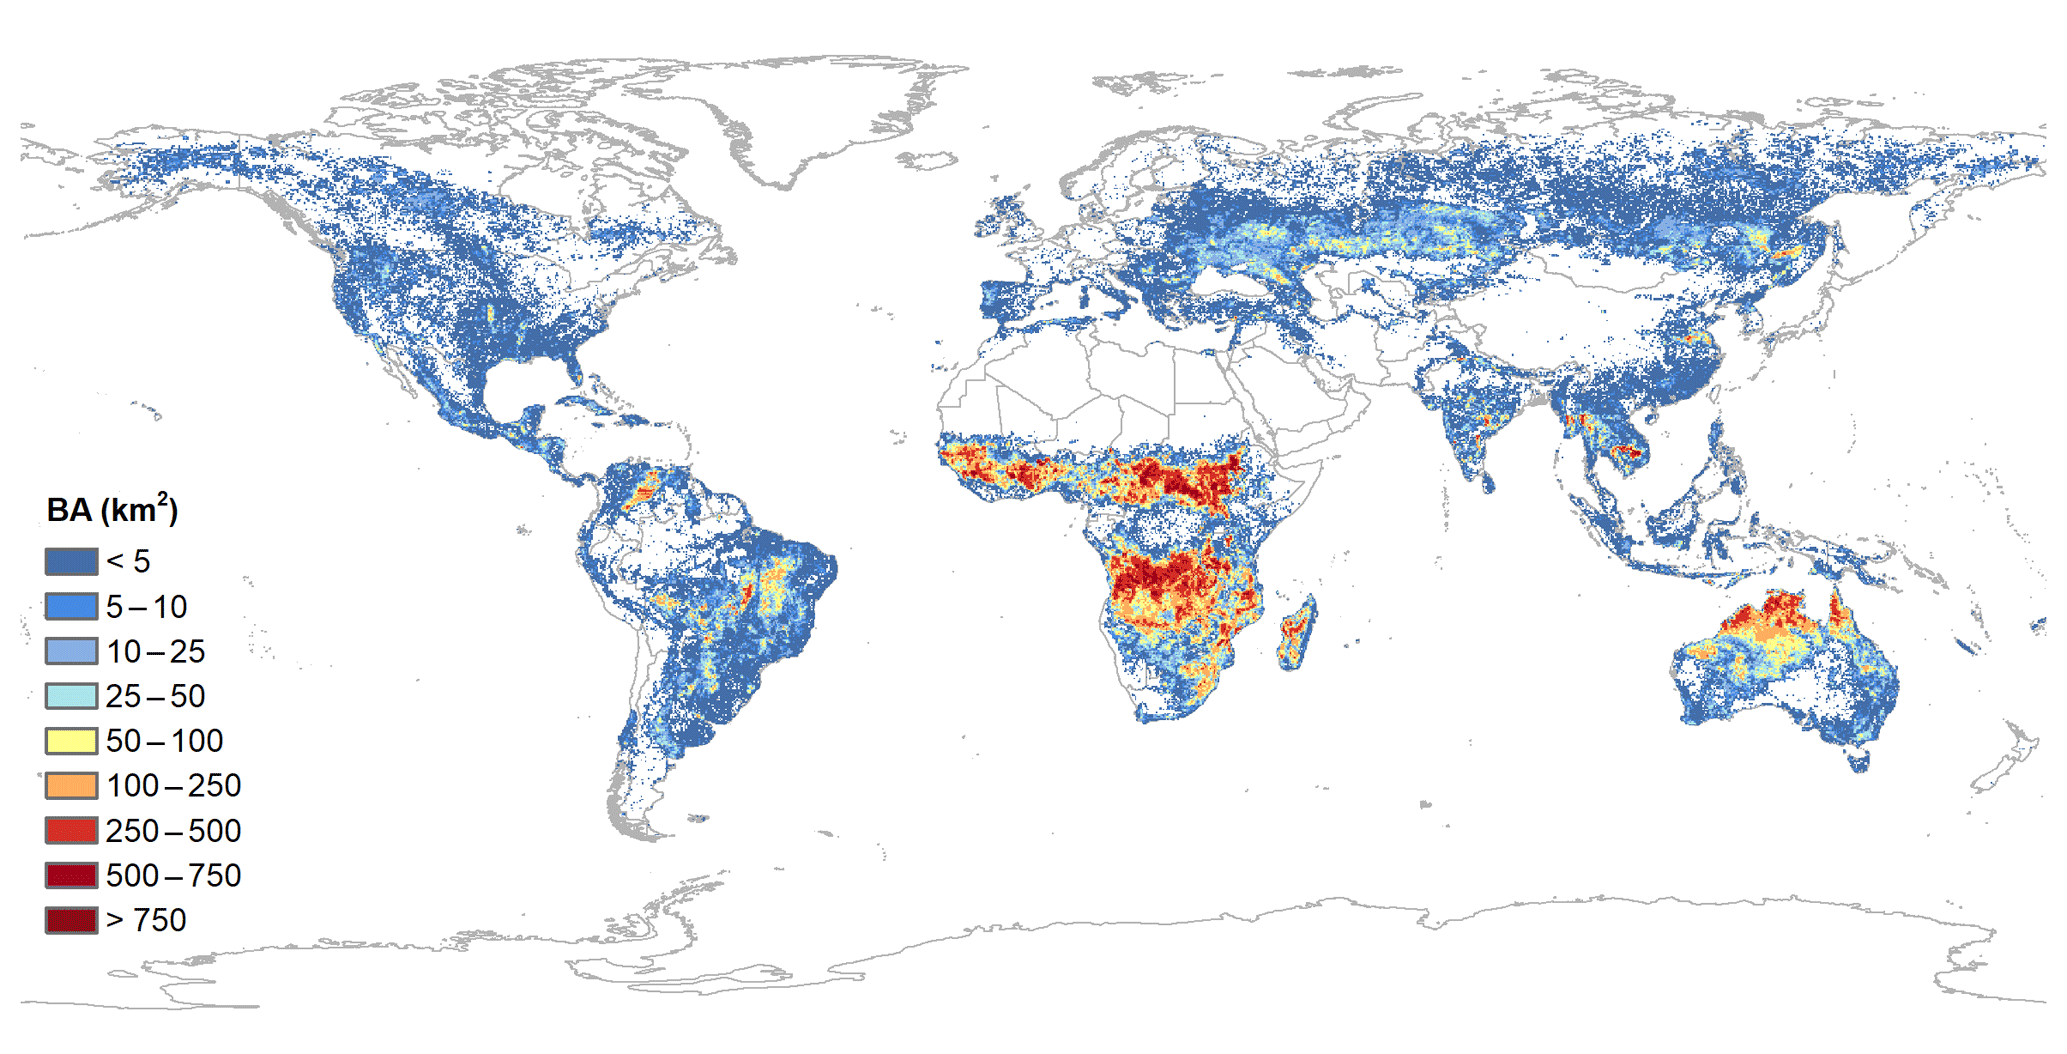
3.1 Global burned area
The FireCCI50 BA product includes the global time series from 2001 to 2016. Average yearly BA was 3.808 Mkm2. Years with largest BA were 2004, 2005, 2011 and 2012 with more than 4 Mkm2 each, while only 2013 and 2016 had less than 3.5 Mkm2. Figure 1 shows the spatial distribution of average annual BA of the full time series. The tropical belts of Africa, South and Central America and Australia were the most extensively burned. Temperate forest in western Europe and the USA and grasslands and croplands of south-east Asia, far east Russia and northern Kazakhstan also had significant fire occurrence. The most persistent biomass burning in the time series occurred in tropical mainland Africa and Madagascar (excluding the rainforest), northern Australia and tropical Latin America (both hemispheres), excluding the central Amazonian region and the Andes. Fire persistency is also observed in large agricultural areas of southern Russia, south-east USA and south-east Asia (Myanmar, Laos, Thailand and Vietnam).
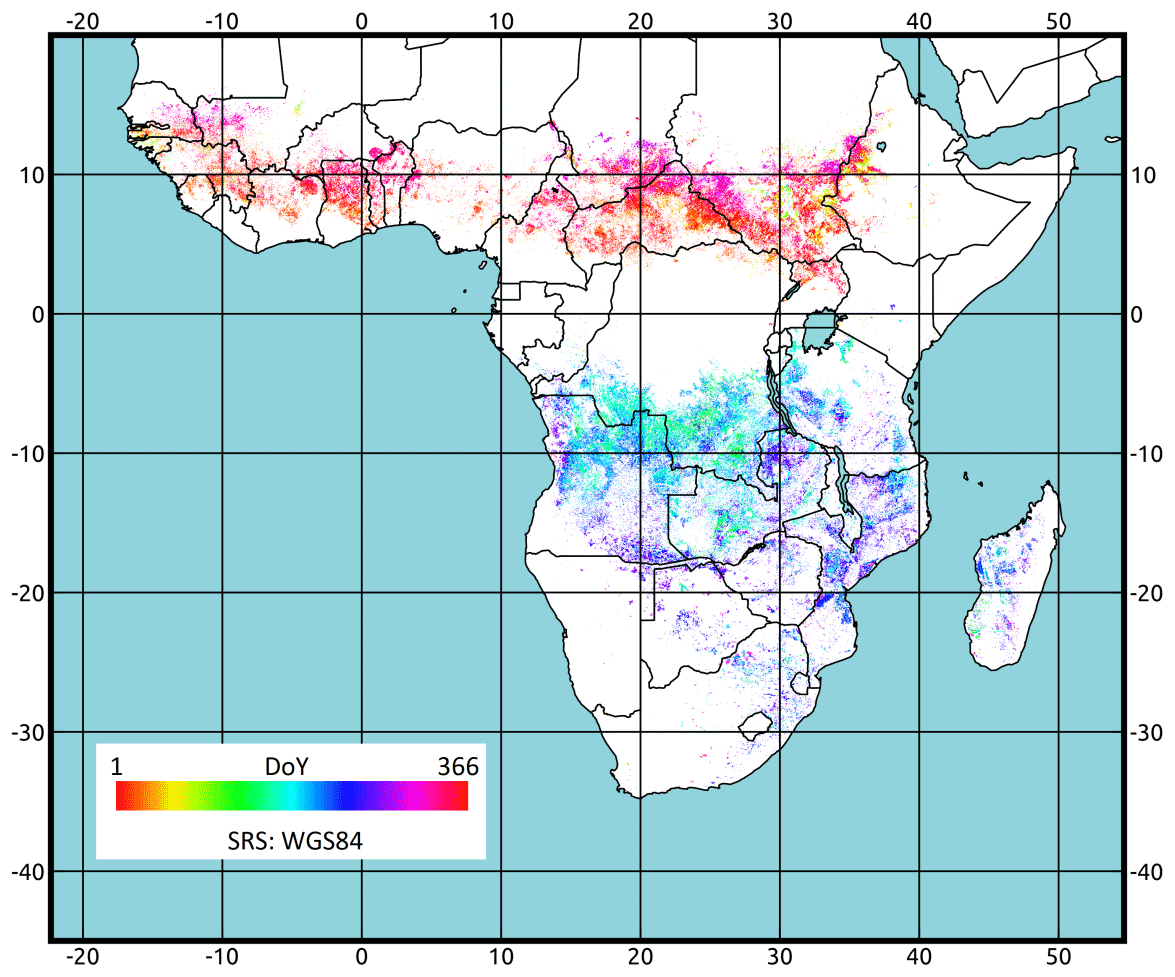
Figure 2Day of the year (DoY) when the pixels are detected as burned in tropical Africa (2008).
Fire occurs mostly during the dry season, particularly in the tropics. Figure 2 shows the day of the year when pixels were detected as burned in the FireCCI50 product. As expected, December to February showed most fire activity in the northern hemispheric tropical regions, while June to September showed fire activity in the Southern Hemisphere. Southern Chad, Sudan, the Central African Republic and Ghana were the most affected by fires in the northern fringe, while Angola, Congo, Zambia, Mozambique and Tanzania were the most impacted in the southern region.
3.2 Product validation results at the global scale
The estimated error matrices and accuracy measures can be found in Table 2 and Fig. 3 for the time periods with available product and reference data (FireCCI50 and MCD64 c6 for 2003–2014 and FireCCI41 for 2005–2011). The accuracy of the FireCCI50 product, expressed by a Dice coefficient (DC) value of 0.365 (standard error, SE =0.026), was higher than for the FireCCI41 product (DC =0.248 with SE =0.030), but lower than for the MCD64A1 c6 product (DC =0.478 with SE =0.031). Global commission and omission error ratios (Ce and Oe) were 0.512 (SE =0.020) and 0.708 (SE =0.30) for the FireCCI50 product. The FireCCI41 had a total of 0.643 (SE =0.045) omission and 0.810 (SE =0.030) commission rates, while the MCD64A1 c6 had 0.353 (SE =0.016) and 0.622 (SE =0.038), respectively. While it might be expected that the higher spatial resolution of FireCCI50 would produce a more accurate product than the MCD64A1 c6, the limited spectral resolution, as there are no shortwave bands which are very important for BA detection, offsets improvement in terms of spatial resolution and means that the two products are complementary. A detailed fire size and type analysis is needed to understand this complementarity (see Sect. 3.4 for the first assessment of fire size).
Table 2Estimated error matrices for each product at the global level. Cells of the error matrices represents areas of 1013 m2. is the BA according to both the product and the reference classifications, is the commission error area, is the omission error area and is the unburned area according to both the product and the reference classifications.
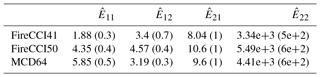
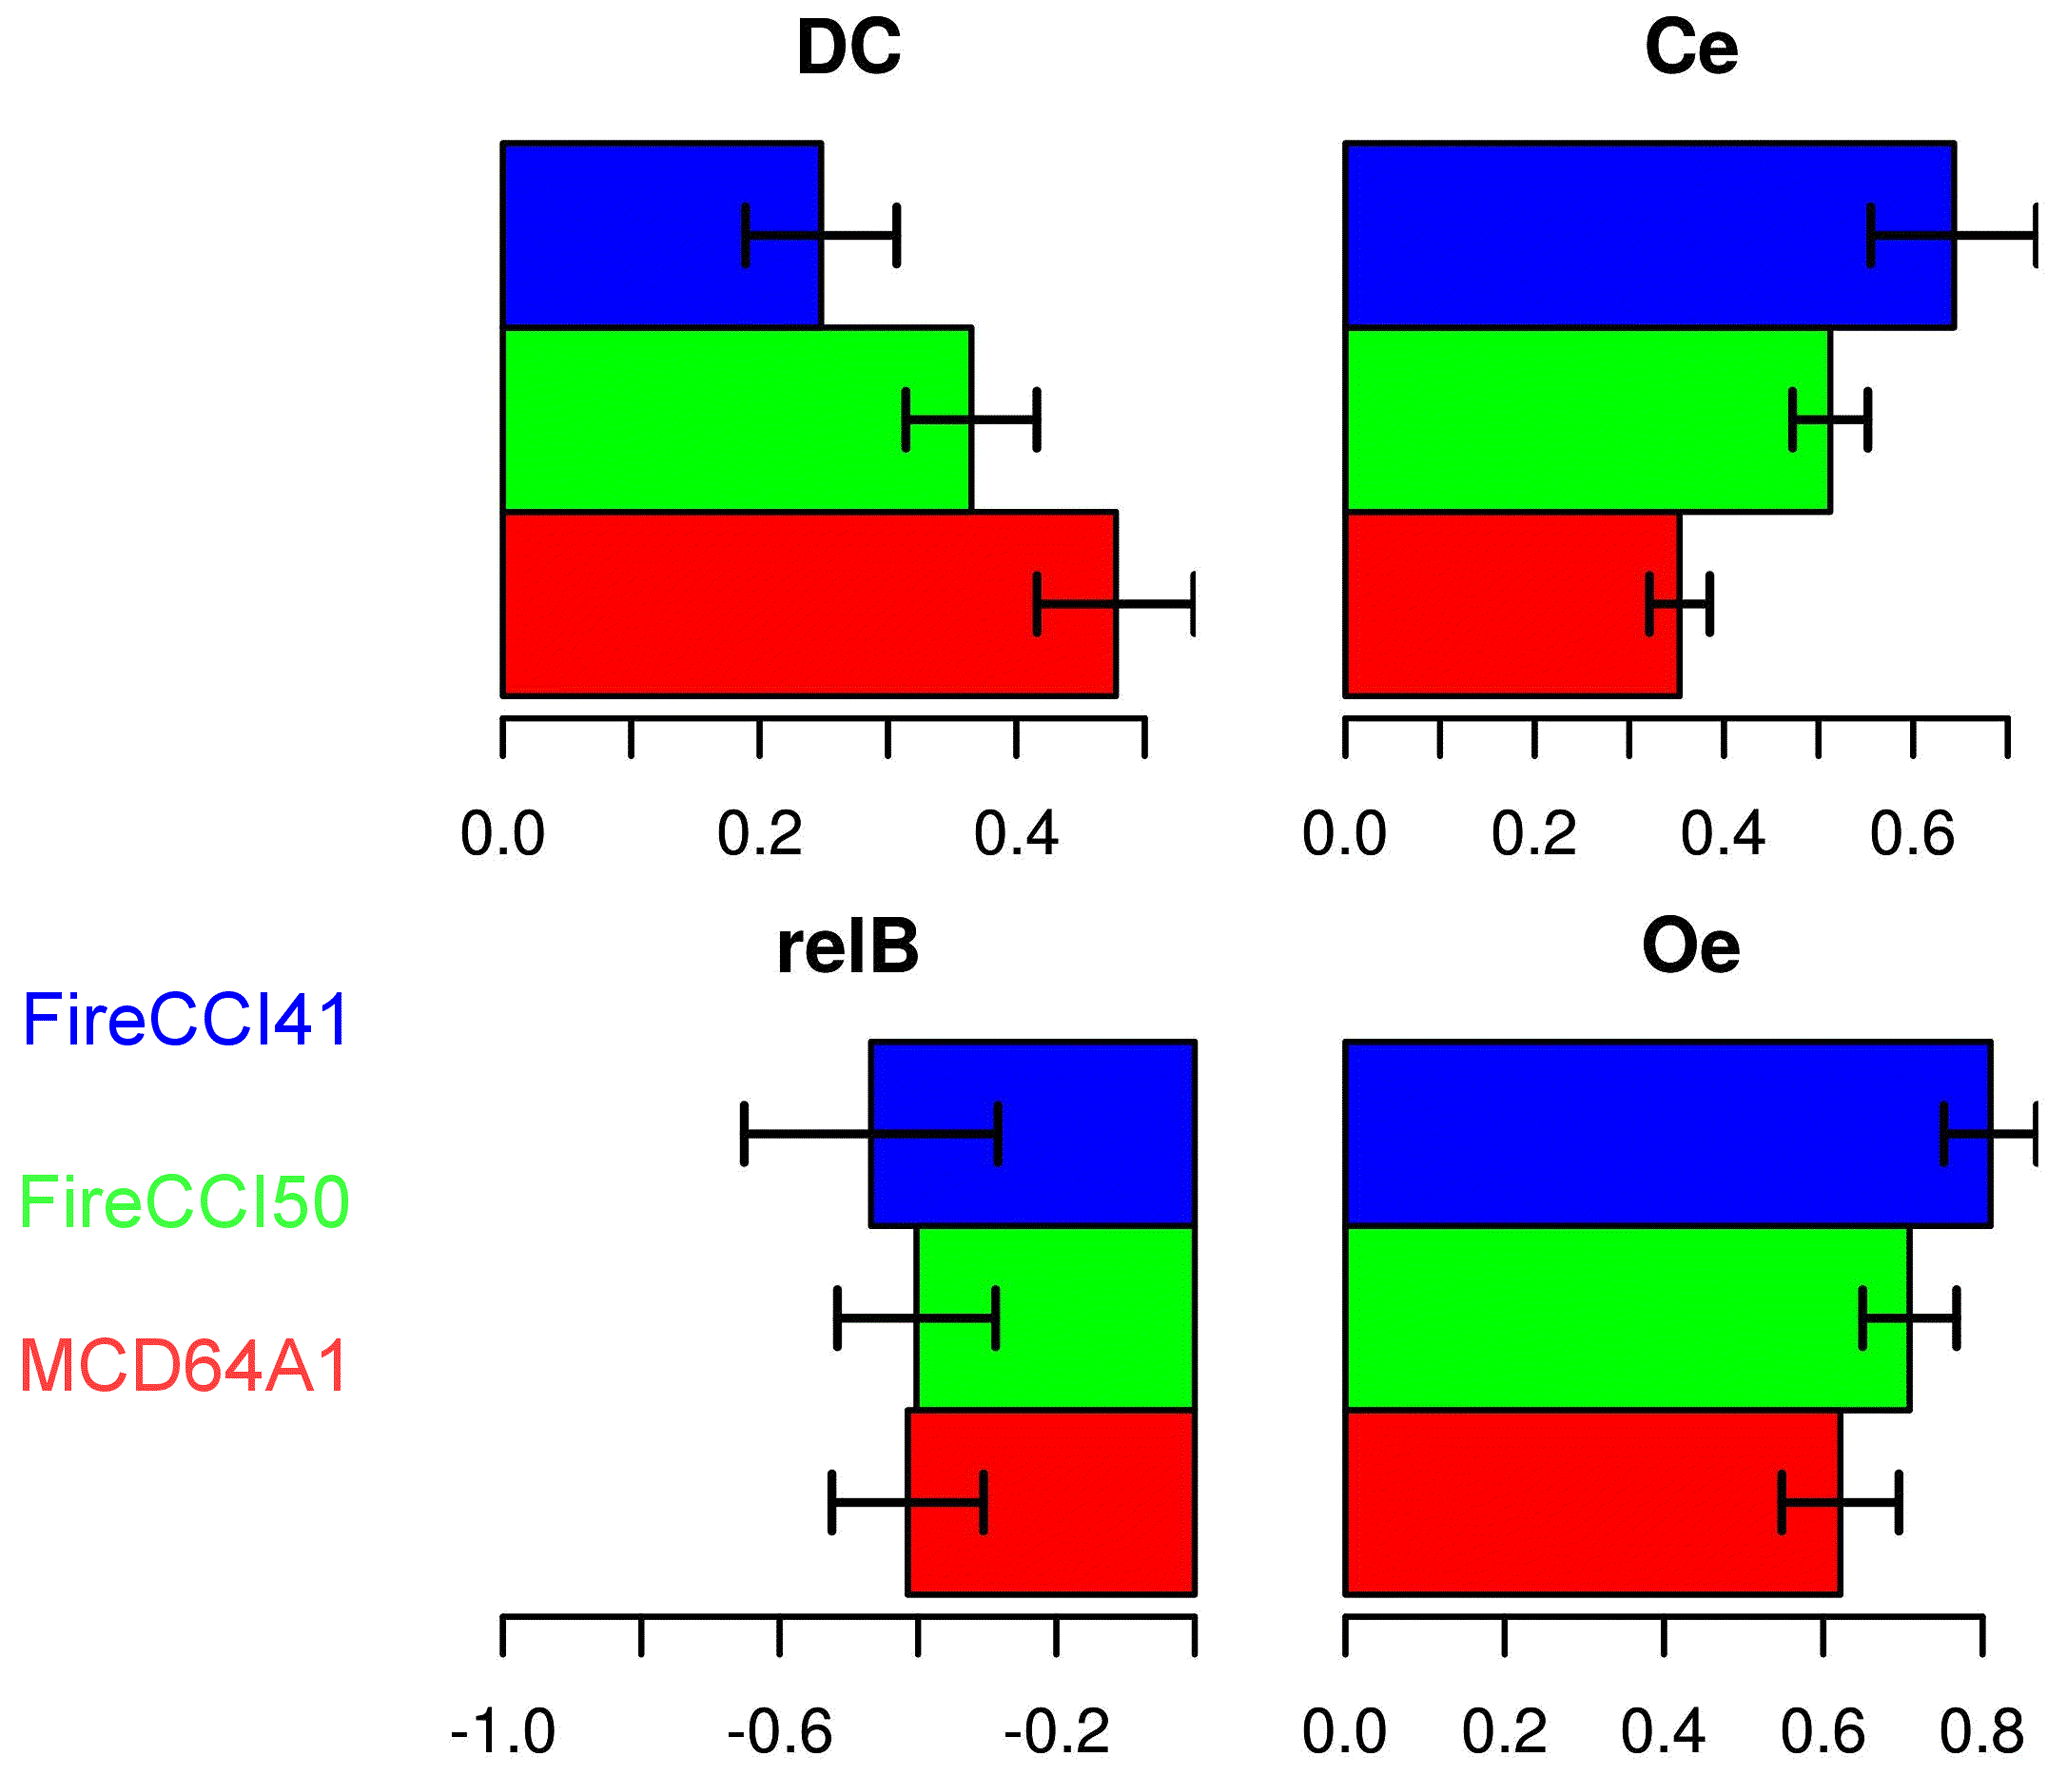
Figure 3Estimates of Dice coefficient (DC), relative bias (relB), commission error ratio (Ce) and omission error ratio (Oe) at the global scale. Horizontal segments show the 95 % confidence intervals.
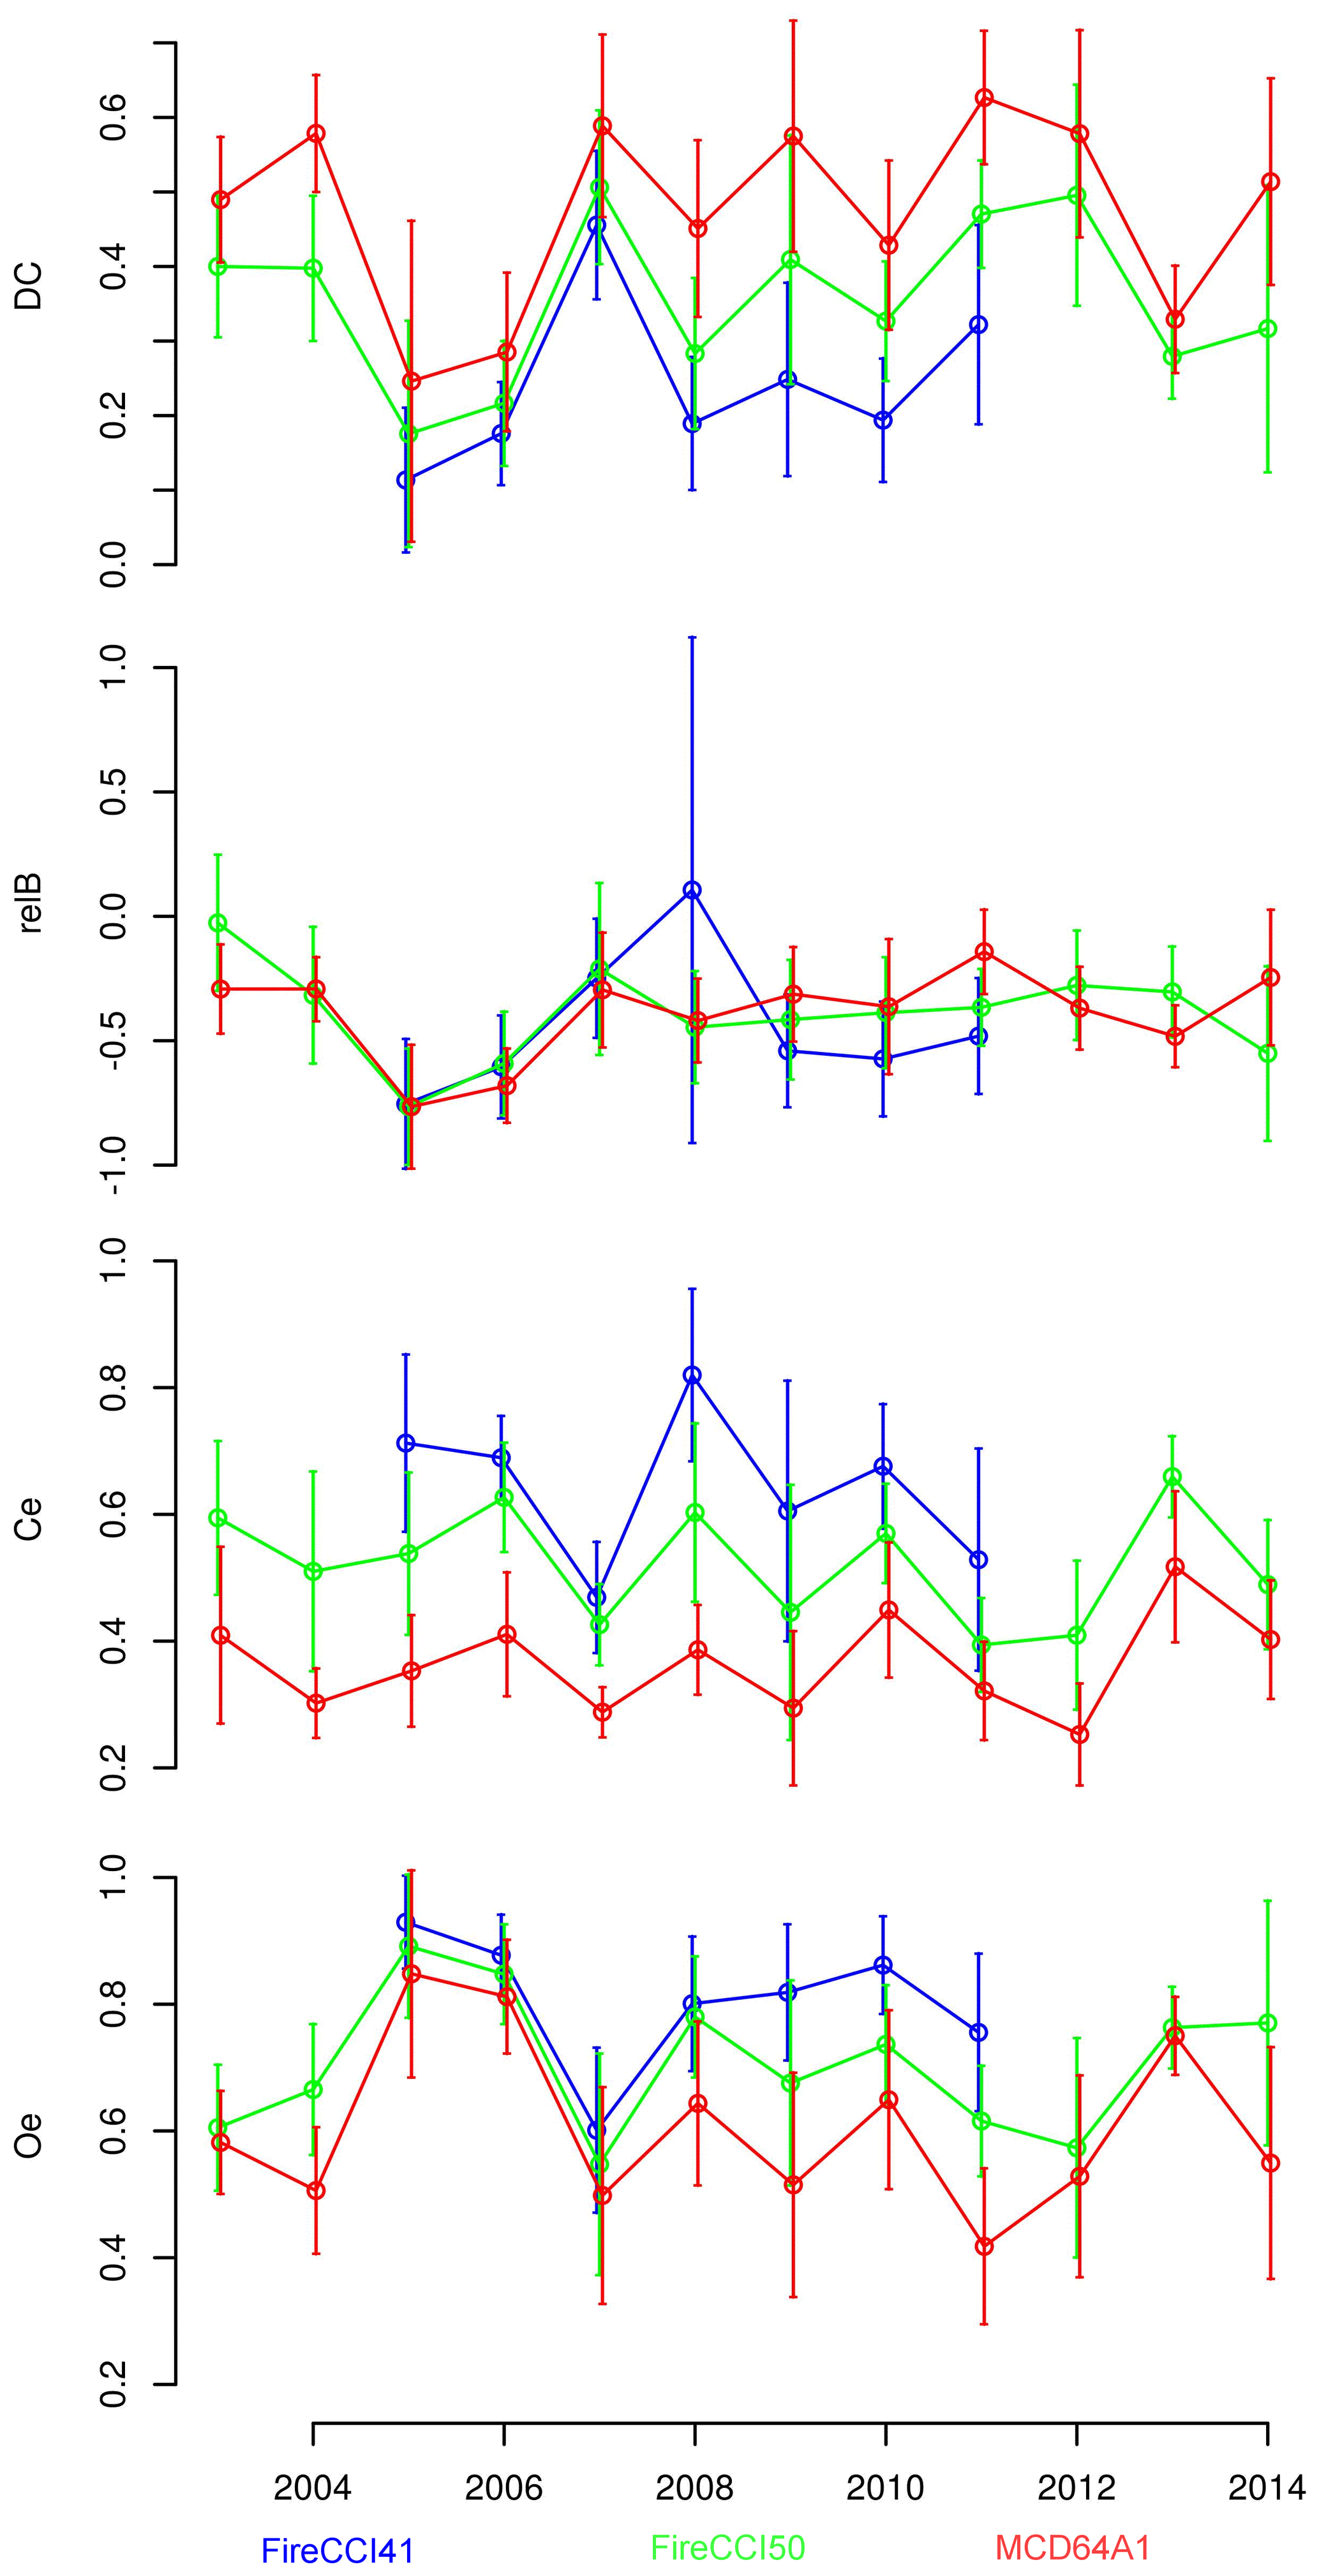
Figure 4Estimates of Dice coefficient (DC), relative bias (relB), commission error ratio (Ce) and omission error ratio (Oe) at the global scale and for each year. Vertical segments show the 95 % confidence intervals. Points are slightly moved along the x axis to improve visualization.
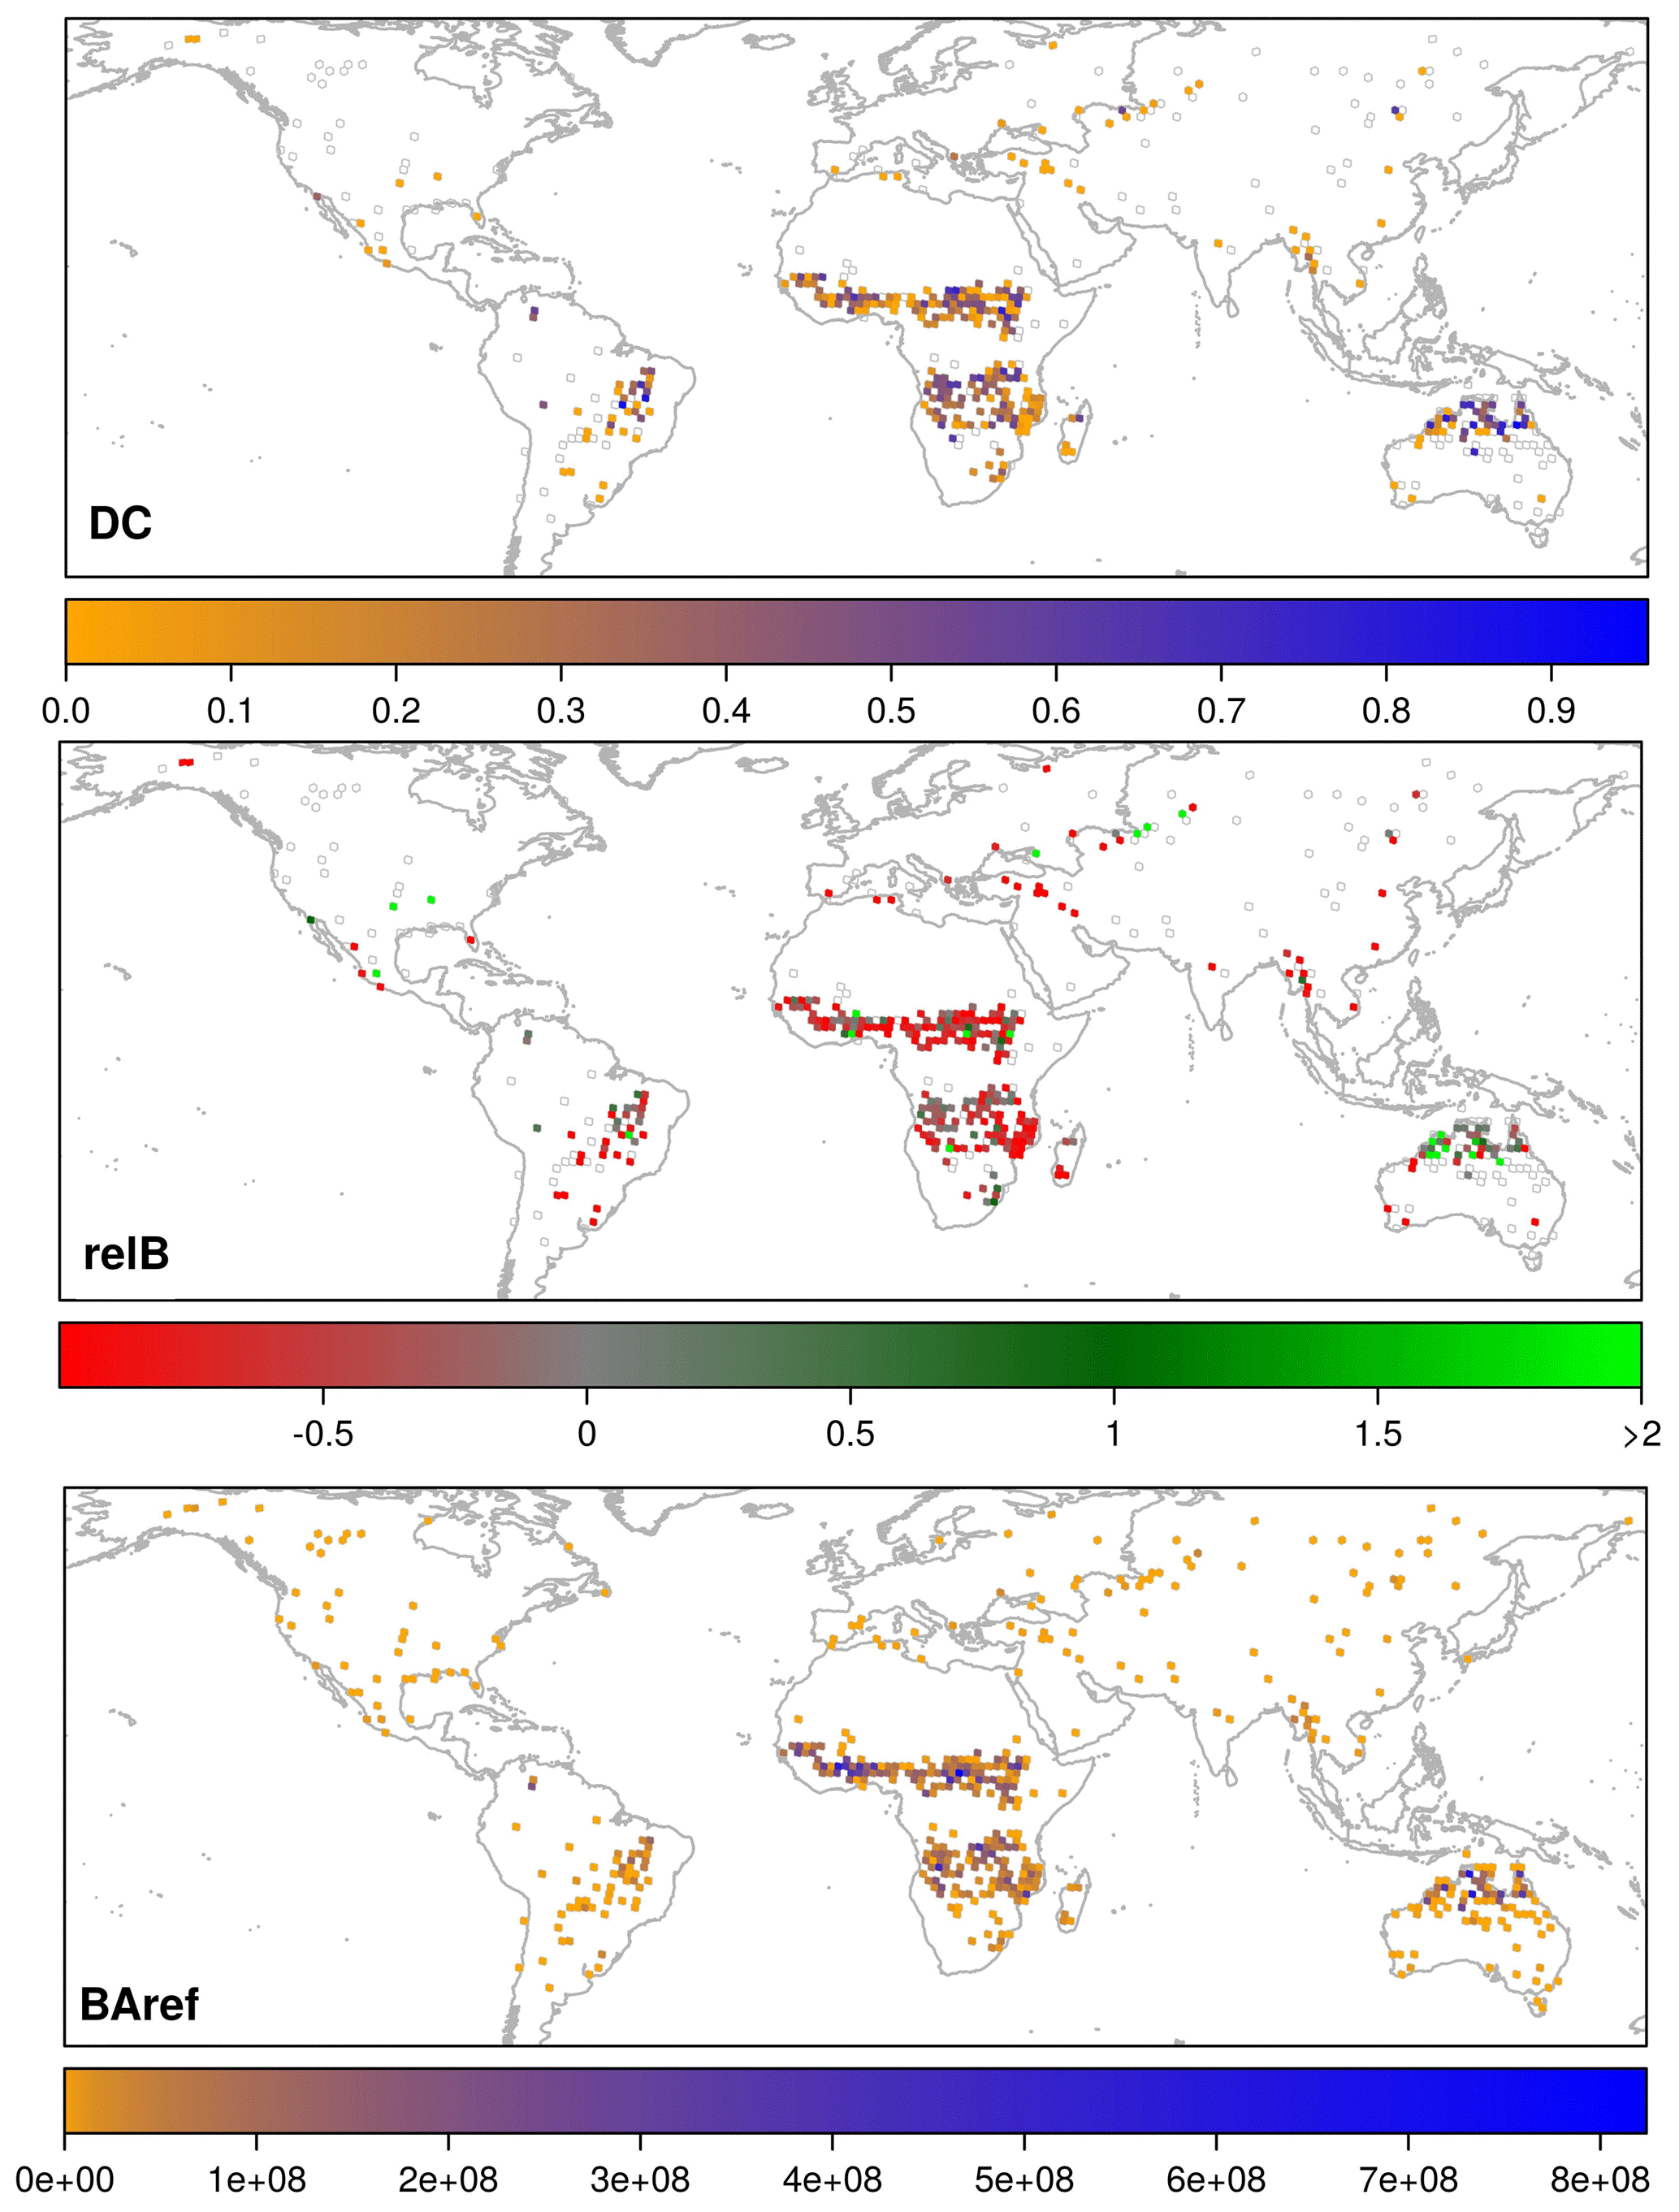
Figure 5Dice coefficient (DC), relative bias (relB) and reference burned area (BAref; m2) for FireCCI50 in TSAs. TSAs with reference data but without accuracy measurements available are represented by empty polygons (white polygons with grey borders). DC is not available when there is no BA in the reference data or in the product, and relB is not available when there is no BA in the reference data.
FireCCI50 underestimates a fraction of 0.402 (0.058) of the BA reported in the reference sample, as expressed by the relative bias (relB). This value is slightly less than MCD64A1 c6, 0.415 (0.056), and lower than MERIS Fire_cci v4.1, 0.468 (0.094). These results indicate that globally the errors are more balanced between omission and commission in FireCCI50 than in the MCD64c6 product.
The temporal trends of accuracies are remarkably similar among BA products. Relative differences between product accuracies observed in 1 year are similarly replicated in the other years (Fig. 4). Yearly accuracies are estimated with relatively low precision (large 95 % confidence intervals) and show relatively high inter-annual variability without clear monotonic trends. For example, the relative bias (relB) of MERIS Fire_cci v4.1 was much closer to zero in 2008 than in the other years, but with a very large intra-annual variability, which led to a very large confidence interval (expressed by the vertical bars). This reflects that the low bias was obtained by large overestimations and underestimations across sampling units that were cancelled out in the global estimate of relative bias.
The spatial variation of accuracy of FireCCI50 is shown in Fig. 5. Accuracy tended to be highest across the tropical and subtropical savanna of Africa, South America and Australia, where fire occurrence was high, and decreased in temperate forest and croplands, where fires are generally less intense and smaller.
3.3 Comparison with existing products
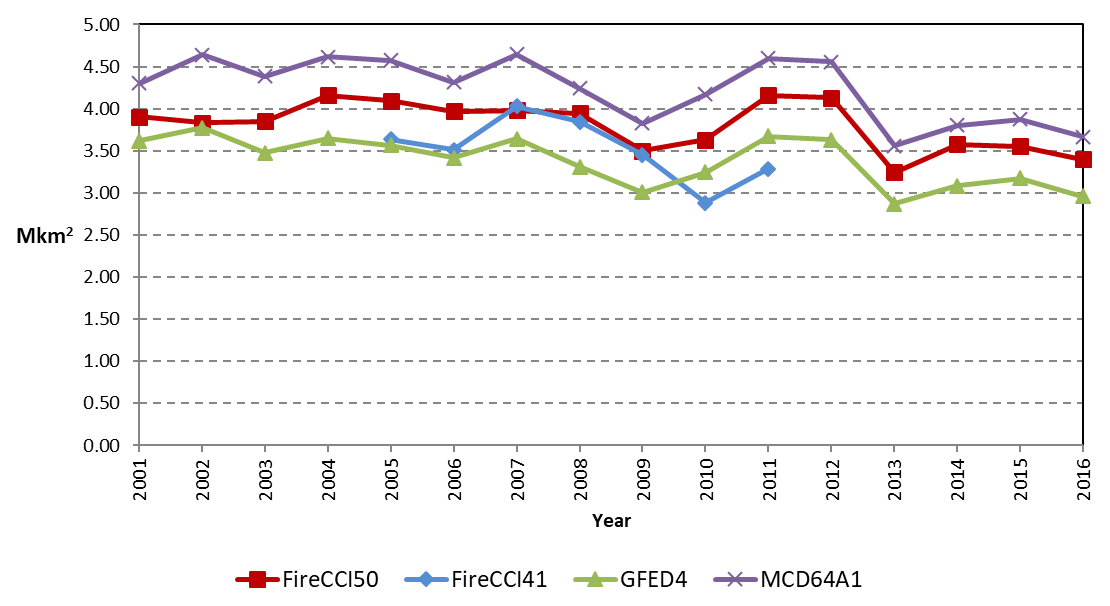
Figure 6 shows the temporal trends of global BA (in km2) estimated from the BA products analysed. The FireCCI50 product provided an intermediate estimation between the MCD64A1 c6 and the GFED4 BA products (based on MCD64A1 c5). It was similar to the FireCCI41 product for the 2007–2009 years, but this latter product showed lower estimations for 2010 and 2011 than the FireCCI50 because of the limited availability of MERIS images for those 2 years. Annual trends in BA derived from these products are remarkably similar across years, with a stable behaviour at the beginning of the time series and a trend towards a slight decrease starting from 2007. The FireCCI41 product showed a high decline in 2010, caused by the lack of observations in the last years of the time series. For this reason, annual estimates of FireCCI41 were poorly correlated with the FireCCI50 product (r2=0.12) by comparison with those for the other MODIS-based products (r2>0.79 in both cases). The annual estimations of the FireCCI50 product were lower than for the MCD64A1 c6 by 11 % and higher than for FireCCI41 (10 %) and GFED4 (12 %) products.
In terms of global spatial patterns of annual BA, FireCCI50 showed a higher agreement with NASA products than with the FireCCI41 (Table 3). The average determination coefficient (r2) of the pairwise correlation of FireCCI50 with the MCD64A1 c6 and GFED4 was 0.70 and 0.67, respectively, and exhibited little inter-annual variability from 2005 to 2011. The spatial agreement with the FireCCI41 product was strongly dependent on the year. While r2 values ranged between 0.63 and 0.65 in the years 2005 to 2009, they were distinctly lower in 2010 (r2=0.44) and 2011 (r2=0.54), which again should be related to the lack of MERIS observations in those years. Table 3 also highlights that the global spatial BA patterns of GFED4 and MCD64A1 c6 were largely similar (average r2=0.93) despite global annual burned area having increased by 27 % with the update of MCD64A1 from c5 to c6.
The comparison between the FireCCI50 product and national fire perimeters for the three sites and the 4 years selected exhibited high agreement between the two products. Assuming fire perimeters to be the reference information, commission errors for the FireCCI50 product were generally below 0.2 (Table 4), with the exception of California. The commission errors were related to the total BA, as small overestimations had a significant weight in the final proportion. This affects both the geographical and temporal variation of ratio errors between the two sources. California in fact had much less area burned than the other two sites (annual average 1241 km2 versus 229 187 km2 of Australia or 13 680 of Canada). The higher commission errors of California were actually found in the years with less burned area (353 km2 in 2010 versus 2059 km2 in 2015). Omission errors were generally higher than the commission errors (with the exception of California, where they were much lower), with values commonly in the range of 0.2 to 0.35. Summing up the three sites (more than 2.5 Mkm2), the overall disagreements between the MODIS Fire_cci product and the fire perimeters were in the range of 0.12–0.23 for commissions and 0.20–0.33 for omissions (Table 4).
3.4 Fire size accuracy
The assessment of the impact of the higher spatial resolution of the MODIS Fire_cci product with reference to the MCD64A1 product conducted over the sampled African sites confirms the limited performance of both global products in detecting fires smaller than 100 ha. Both FireCCI50 and MCD64A1 products show omission values larger than 85 %, mostly caused by the coarse resolution of the input images. However, for smaller fire patches, the FireCCI50 product shows a better performance than MCD64A1, with 3.5 % less omission error in both the 5–25 and the 25–100 ha fire size ranges (97.39 % and 92.13 % for the MCD64A1 and 93.91 % and 86.93 % for the FireCCI50, respectively). For fires larger than 100 ha, the MCD64A1 presents less omission than the FireCCI50 product (55.58 % and 60.79 %, respectively). Figure 7 shows examples of two of the test Sentinel-2 scenes in tropical Africa. The FireCCI50 product identifies more small patches, while larger ones are better defined by the MCD64A1 product.
Table 3Correlation matrix showing the coefficients of determination (r2) calculated for different BA product pairs based on annual data (see Fig. 5). The average and the range calculated from individual years in 2005–2011 are given.
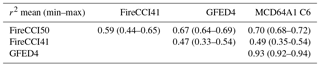
Table 4Agreement between FireCCI50 and national fire perimeters for the selected test areas. Ce denotes commission errors, and Oe denotes omission errors, assuming fire perimeters to be the reference.
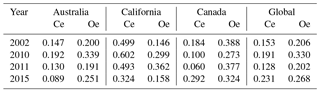

Figure 7Examples of small fire detections by the FireCCI50 and MCD64A1 c6 products in two Sentinel-2 images located in the west of the Central African Republic (a) and north of Angola (b). UTM coordinates are included in both maps.
3.5 Fire patch analysis
Figure 8 displays the global pattern of fire patch density (number of fire patches km−2) calculated from the FireCCI50 and MCD64A1 c6 products. A similar global pattern was observed for both datasets, with the savannas and temperate grasslands yielding higher fire patch density. When plotting the difference between the two products, it was observed that MODIS Fire_cci v5.0 detected more fire patches in woody savannas and open shrubland/grasslands worldwide (+52 %), while it detected fewer fire patches in savannas (−42 %). In other biomes, no clear spatial pattern was observed, with a mixture of fire patch densities varying ±70 %. The total number of fire patches without and with consideration of a 107 ha fire size threshold estimated globally for FireCCI50 was 1.20×10⁶ and 0.54×10⁶, respectively. This last number reached 0.56×10⁶ for MCD64A1 c6. Therefore, when considering a minimum fire patch size threshold of 107 ha, a difference of 3.7 % was observed between the two products, indicating that the 250 m resolution doubles the fire patch number by accounting for smaller ones, and kept the total number of large fire patches almost constant, with only local differences.
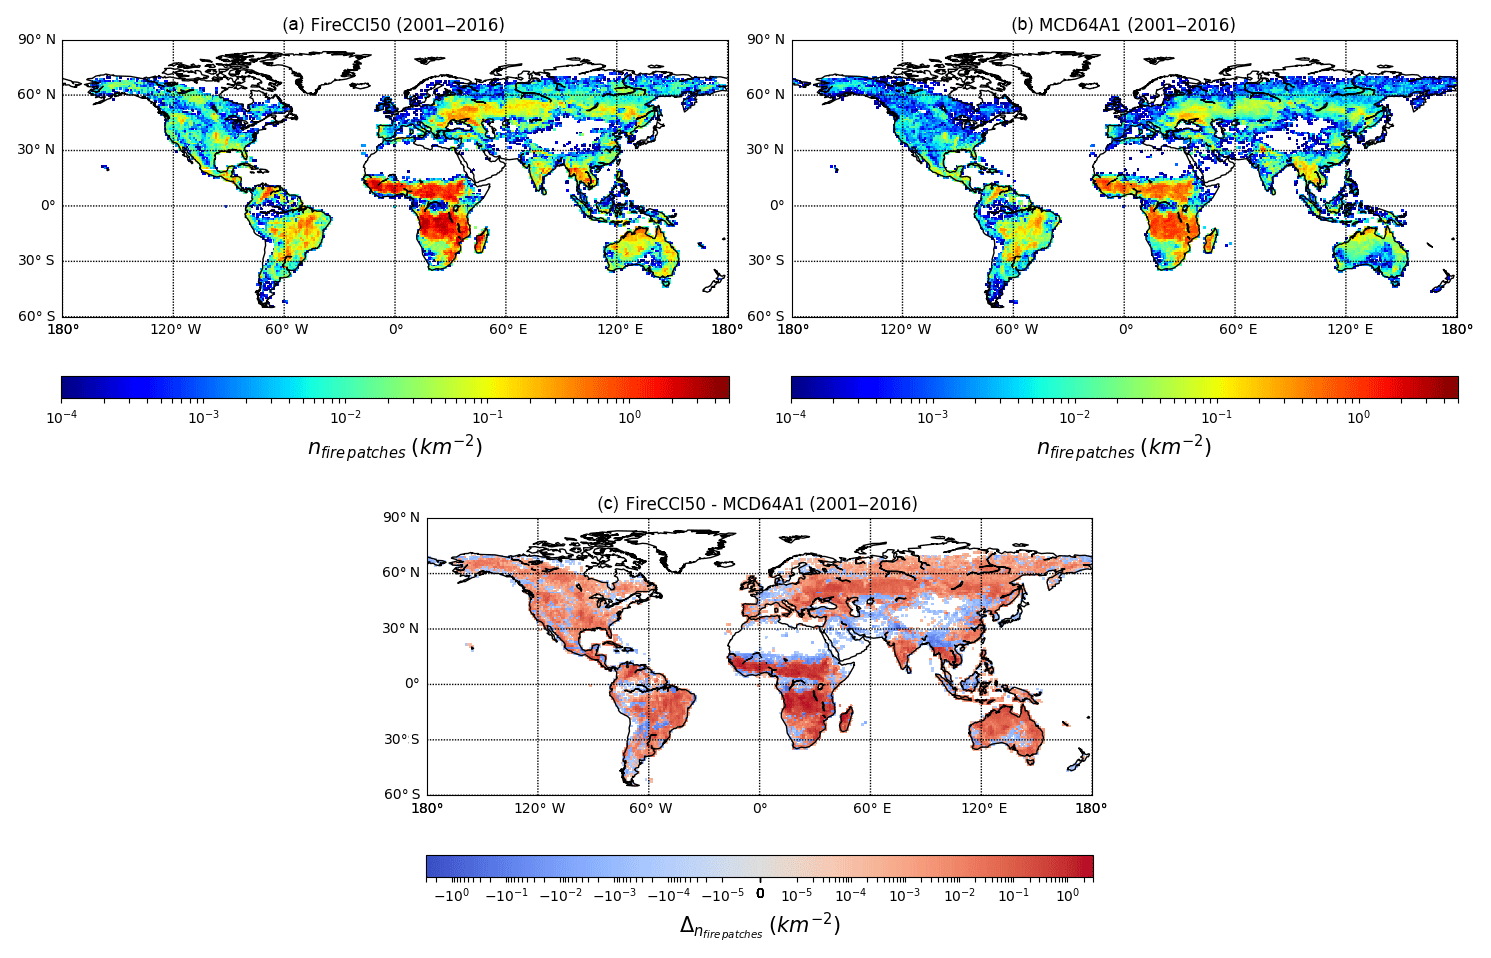
Figure 8Global pattern of fire patch number (km2) obtained from the pixel-level information of FireCCI50 (a) and MCD64A1 c6 (b) for the period 2000–2016. The difference between the two products is also presented (c). A minimum fire size of 107 ha has been chosen to prevent resolution effects.
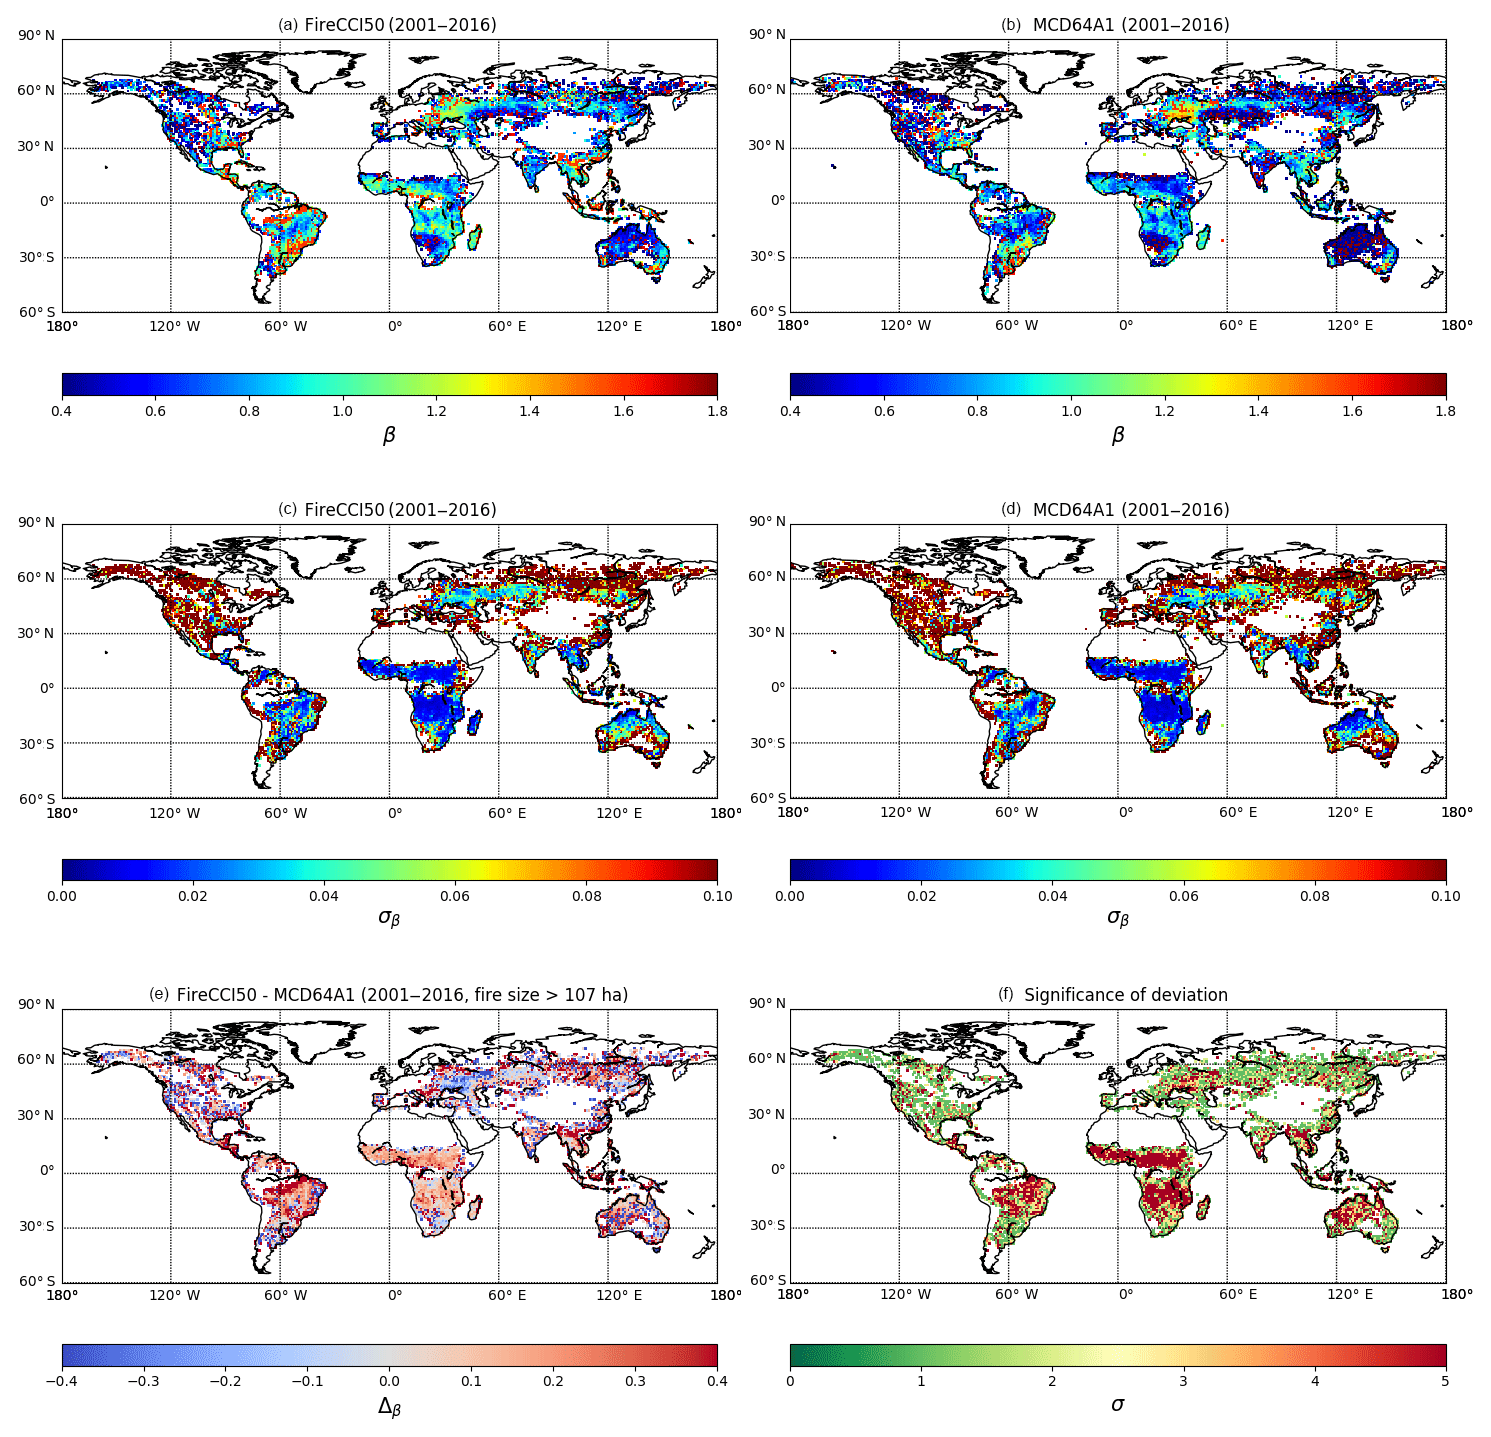
Figure 9Slope (β) of the fire number–fire size relationship (log scale) and its uncertainty (σ) for FireCCI50 (a, c) and MCD64A1 c6 (b, d). The difference between the two products is also presented (e), with the level of agreement between the two products (f).
The grid cell to grid cell correlation between the two products was high for fire patch numbers with r2=0.932 (p value ≪0.01). In the comparison with Sentinel-2 data over northern hemispheric Africa, the obtained values were r2=0.839 (p≪0.01) for FireCCI50 and r2=0.836 for MCD64A1 c6 (p≪0.01).
The slope β of the fire number–fire size relationship (log scale) is presented in Fig. 9 for each product for the period 2001–2016, alongside their uncertainties. A similar global spatial pattern was observed between the two products as well as values varying between 0.4 and 1.8. However, a steeper slope was also observed (higher beta, on average) of the fire size distribution in FireCCI50, indicating that small fires were more frequent. This observation is particularly important and systematic in savannas, with the highest positive differences observed in South America (). A reverse pattern was observed in grasslands with a flatter slope in FireCCI50 (). As a result, the level of agreement is good at the global scale, except for the regions mentioned above.
Grid cell to grid cell correlations of the β slope between FireCCI50 and MCD64A1 c6 were high, with r2=0.84 (p≪0.01) when considering fire sizes larger than 107 ha and grid cells with p value <0.01 for the significance of the fire size–fire number relationship in each product. In the comparison with Sentinel-2 data for northern hemispheric Africa (Roteta et al., 2018; Bastarrika and Roteta, 2018), the obtained grid cell to grid cell relationship showed r2=0.49 (p=0.0073) for FireCCI50, and this was a little lower with r2=0.36 (p=0.033) for MCD64A1 c6 when selecting a fire size larger than 107 ha and grid cells with a p value <0.025 for the significance of the fire size–fire number relationship. Lower correlations with Sentinel-2 might result from the smaller time frame (2016–2017) used for this sensor.
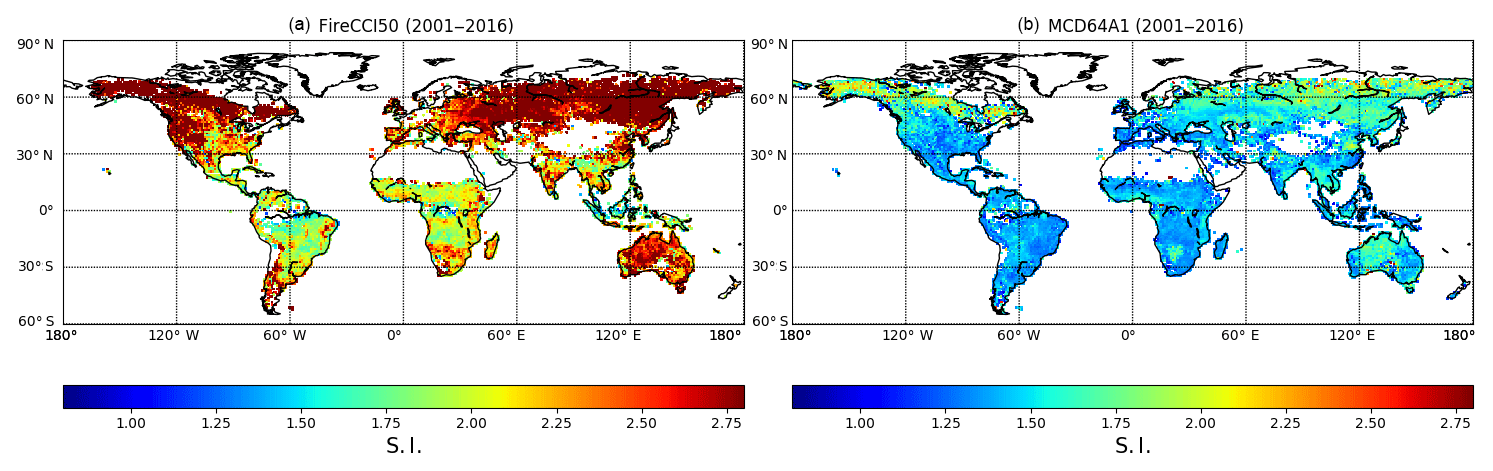
The pixel-level characterization of fire patches was also used to extract their shape index (SI) information. As an example of pixel-level product use and the derived fire patches, fire shapes show the drivers of fire spread as wind-driven fires would be more elongated than fire spreading under mild conditions. Fire shape complexity can also show the difficulty of the fire to spread over fragmented landscapes or complex topography (Hargrove et al., 2000; Cary et al., 2006). On the other side, fire shape complexity can provide keystone information on fire refuges of unburned islands within or at the boundary of fire patches (Román-Cuesta et al., 2009). Figure 10 illustrates the mean fire shape index (SI) from Fire_cci v5.0 and MCD64A1 c6 for the 2000–2016 period. We did not show the difference between the two products because the aliasing bias depends on the spatial resolution of each product. The global pattern of fire complexity is conserved between the two products, with a systematic higher and more precise characterization of the complexity in the Fire_cci v5.0 product because of its higher spatial resolution. A minimum shape fire complexity was observed in savannas and tropical forests, and the highest complexity in the boreal forests and grasslands. The global grid cell to grid cell correlation analysis of SI reached r2=0.528 (p≪0.01) between the two products. When correlating SI values from the FireCCI50 product with the Sentinel-2 BA product for northern hemispheric Africa, a value of r2=0.111 (p=0.017) was obtained when the fire patch size was larger than 107 ha. For this fire class size, a similar correlation (r2=0.111, p=0.01) was obtained for MCD64A1 c6. When selecting all fire patches from the products (i.e. without applying any fire size threshold), we obtained a higher correlation between Sentinel-2 and FireCCI50 SI (r2=0.3, p<0.01), while the correlation without this fire size threshold was no more significant for MCD64A1 c6 (, p=0.9). This result indicates a similar spatial conservation of mean fire SI for fires >107 ha by both BA products when compared to fine-resolution Sentinel-2 data at the continental scale in northern hemispheric Africa. When adding small fires to the comparison, the spatial pattern of mean SI is no more conserved for MCD64A1 c6, while the correlation increases for Fire_cci v5.0. This could suggest a loss of fire shape characterization of small fires in MCD64A1 c6, with the coarsest resolution as observed in Nogueira et al. (2017) for South American savannas, but this conclusion should be considered carefully as it is also highly driven by the higher fire number in Sentinel-2 than MCD64A1 c6, so the mean SI does not cover the same fire size panel. The poor correlation in mean SI is in turn more the result of missing small fires than bias in fire shapes. Regarding MODIS Fire_cci v.5.0, the number of fire patches is higher than MCD64A1 c6 and closer to Sentinel-2 due to its finer resolution, and the mean SI correlation is improved. This suggests that additional small fires were identified in this product and that they conserved the shape obtained at the finer Sentinel-2 resolution.
This paper has presented a new global BA product aimed to improve the information available to climate modellers on spatio-temporal patterns of fire occurrence. The FireCCI50 is the first global BA product derived from the two highest spatial-resolution channels (R, NIR) of this sensor, with approximately 250 m pixel size. This product was generated as theoretically it provides an improved representation of small fire patches and is thus more suitable to analyse spatial properties of burned patches than other existing global BA datasets. A first assessment of the product indicates it is more sensitive to small fire patches for the African continent than the MCD64A1 c6 product. However, further assessment is needed to determine to what extent this observation applies to other continents.
With respect to spatial and temporal variability, the FireCCI50 BA product showed the highest fire occurrence in dry tropical regions of Africa, Australia and South America. Global estimates of BA for FireCCI50 product range from 3.24 Mkm2 in 2013 to 4.16 Mkm2 in 2011, with a slight trend towards a decline in the total BA in the whole period (2001–2016). This follows other observations of global BA trends (Andela et al., 2017), particularly evident in the last 4 years.
Global average accuracy estimated for the FireCCI50 product was lower than for the MCD64A1 c6 product, particularly in terms of omission errors. It should be pointed out that the recently released c6 version has significantly increased the detection of fire patches with respect to previous MCD64A1 versions (around 30 % more BA than c5, which is the basis of GFED4). The main advantage of the MCD64A1 over our product is the use of short-wave infrared (SWIR) bands, which have been widely reported to be very sensitive to BA detection (Bastarrika et al., 2011; Giglio et al., 2009; Martín et al., 2005). However, this implies a reduction in the spatial resolution of the FireCCI50 product by 4 times. Further efforts are required for achieving higher accuracy metrics for BA products based on the R–NIR bands, while keeping their higher spatial resolution. In addition to the MODIS sensor, BA algorithms based on just NIR bands would also benefit from having higher spatial resolution than SWIR bands in other sensors, such as the Ocean and Land Colour Instrument (OLCI) or VIIRS. Improved resolution of BA products is clearly relevant for fire modellers, as has been shown with the example of the fire patch analysis.
Compared with other existing products, the FireCCI50 product provided higher accuracy values than FireCCI41, as well as other European BA products based on SPOT-VEGETATION images (Padilla et al., 2015). Comparison of our results with the national fire perimeters in three different fire regimes (boreal, tropical and temperature areas) showed very satisfactory results, with lower errors than those estimated by the statistical validation. This may be caused by the longer period the national fire perimeters refer to (the full year), which should mitigate the impact of temporal detection accuracy when using short periods of time in between Landsat pairs (the standard procedure for BA validation). Extending validation periods to the full year would help to decouple detection and temporal reporting errors in future validation efforts.
The FireCCI50 includes two types of BA files: monthly full-resolution continental tiles (doi: https://doi.org/cpk7, Chuvieco et al., 2018a) and biweekly global grid files at a degraded resolution of 0.25 degrees (doi: https://doi.org/gcx9gf, Chuvieco et al., 2018b). Both datasets are freely available through the Fire_cci website (https://www.esa-fire-cci.org, last access: October 2018), or through the CCI Open Data Portal (http://cci.esa.int/data, last access: October 2018). To receive updates on the products and information on new datasets, users are encouraged to register with the Fire_cci project at https://geogra.uah.es/fire_cci/ (last access: October 2018).
This paper has presented the FireCCI50 BA product. It is based on Terra-MODIS bands R and NIR, thus providing the highest spatial resolution of existing global BA datasets (approx. 250 m). The BA algorithm followed a two-phase approach, first detecting the core burned pixels and then applying a contextual analysis to discriminate the burned patches. Information from thermal anomalies was used to define probability functions adapted to the spatio-temporal variation of fire activity. The algorithm was used to process the 2001–2016 Terra-MODIS time series. Two set of products were generated: pixel (at full resolution), with date of detection, confidence level and land cover; and grid (at 0.25∘ resolution), with BA, standard error, fraction of burnable area, fraction of observed area, number of patches and BA for 18 different land covers. The product showed consistent temporal and spatial trends with existing BA products and it seems to be more sensitive in detecting smaller fire patches than previously released products. This sensitivity, however, needs further analysis to determine the degree of improvement.
EC is the Science Leader of the Fire_cci project and has coordinated the manuscript production and supervised the BA algorithm, JLL, MLP and RR developed the BA algorithm and contributed to the writing, MP and KT performed the validation and contributed to the writing, FM and PL performed the burned patch analysis and contributed to the writing, TS was in charge of data processing, AH did the intercomparison analysis and contributed to writing and SP is the Technical Officer of the ESA and contributed to project ideas and the writing of the manuscript.
The authors declare that they have no conflict of interest.
This study has been funded by the ESA Fire_cci project, which
is part of the ESA Climate Change Initiative
Programme.
Edited by: David Carlson
Reviewed by: two anonymous referees
Alonso-Canas, I. and Chuvieco, E.: Global Burned Area Mapping from ENVISAT-MERIS data, Remote Sens. Environ., 163, 140–152, https://doi.org/10.1016/j.rse.2015.03.011, 2015.
Andela, N., Morton, D. C., Giglio, L., Chen, Y., van der Werf, G. R., Kasibhatla, P. S., DeFries, R. S., Collatz, G. J., Hantson, S., Kloster, S., Bachelet, D., Forrest, M., Lasslop, G., Li, F., Mangeon, S., Melton, J. R., Yue, C., and Randerson, J. T.: A human-driven decline in global burned area, Science, 356, 1356–1362, https://doi.org/10.1126/science.aal4108, 2017.
Barbosa, P. M., Pereira, J. M. C., and Grégoire, J. M.: Compositing criteria for burned area assessment using multitemporal low resolution satellite data, Remote Sens. Environ., 65, 38–49, 1998.
Barbosa, P. M., Grégoire, J. M., and Pereira, J. M. C.: An algorithm for extracting burned areas from time series of AVHRR GAC data applied at a continental scale, Remote Sens. Environ., 69, 253–263, 1999.
Bastarrika, A. and Roteta, E.: ESA CCI ECV Fire Disturbance: D2.1.2 Algorithm Theoretical Basis Document-SFD, version 1.0, available at: http://www.esa-fire-cci.org/documents, last access: 10 November 2018.
Bastarrika, A., Chuvieco, E., and Martín, M. P.: Mapping burned areas from Landsat TM/ETM+ data with a two-phase algorithm: balancing omission and commission errors, Remote Sens. Environ., 115, 1003–1012, 2011.
Bastarrika, A., Alvarado, M., Artano, K., Martinez, M., Mesanza, A., Torre, L., Ramo, R., and Chuvieco, E.: BAMS: A Tool for Supervised Burned Area Mapping Using Landsat Data, Remote Sensing, 6, 12360–12380, 2014.
Boschetti, L., Roy, D. P., and Justice, C. O.: International Global Burned Area Satellite Product Validation Protocol. Part I – production and standardization of validation reference data, available at: http://lpvs.gsfc.nasa.gov/DOC/protocol_revised_Apr09.doc (last access: 10 November 2018), 2009.
Boschetti, L., Roy, D. P., Justice, C. O., and Humber, M. L.: MODIS–Landsat fusion for large area 30 m burned area mapping, Remote Sens. Environ., 161, 27–42, https://doi.org/10.1016/j.rse.2015.01.022, 2015.
Bowman, D. M., Williamson, G. J., Abatzoglou, J. T., Kolden, C. A., Cochrane, M. A., and Smith, A. M.: Human exposure and sensitivity to globally extreme wildfire events, Nature Ecology and Evolution, 1, 0058, https://doi.org/10.1038/s41559-016-0058, 2017.
Breiman, L.: Random forests, Mach. Learn., 45, 5–32, 2001.
Cary, G. J., Keane, R. E., Gardner, R. H., Lavorel, S., Flannigan, M. D., Davies, I. D., Li, C., Lenihan, J. M., Rupp, T. S., and Mouillot, F.: Comparison of the sensitivity of landscape-fire-succession models to variation in terrain, fuel pattern, climate and weather, Landscape Ecol., 21, 121–137, 2006.
Chuvieco, E., Martín, M. P., and Palacios, A.: Assessment of different spectral indices in the red-near-infrared spectral domain for burned land discrimination, Int. J. Remote Sens., 23, 5103–5110, 2002.
Chuvieco, E., Ventura, G., Martín, M. P., and Gomez, I.: Assessment of multitemporal compositing techniques of MODIS and AVHRR images for burned land mapping, Remote Sens. Environ., 94, 450–462, 2005.
Chuvieco, E., Englefield, P., Trishchenko, A. P., and Luo, Y.: Generation of long time series of burn area maps of the boreal forest from NOAA–AVHRR composite data, Remote Sens. Environ., 112, 2381–2396, https://doi.org/10.1016/j.rse.2007.11.007, 2008.
Chuvieco, E., Aguado, I., Jurdao, S., Pettinari, M. L., Yebra, M., Salas, J., Hantson, S., de la Riva, J., Ibarra, P., Rodrigues, M., Echeverría, M., Azqueta, D., Román, M. V., Bastarrika, A., Martínez, S., Recondo, C., Zapico, E., and Martínez-Vega, F. J.: Integrating geospatial information into fire risk assessment, Int. J. Wildland Fire, 23, 606–619, https://doi.org/10.1071/WF12052, 2014.
Chuvieco, E., Yue, C., Heil, A., Mouillot, F., Alonso-Canas, I., Padilla, M., Pereira, J. M., Oom, D., and Tansey, K.: A new global burned area product for climate assessment of fire impacts, Global Ecol. Biogeogr., 25, 619–629, https://doi.org/10.1111/geb.12440, 2016.
Chuvieco, E., Pettinari, M. L., Lizundia Loiola, J., Bastarrika, A., Roteta, E., Tansey, K., Padilla Parellada, M., Wheeler, J., Lewis, P., Gomez-Dans, J., Brennan, J., Pereira, J. M., Oom, D., Campagnolo, M., Storm, T., Kaiser, J., Heil, A., Mouillot, F., Moreno, M. V., Yue, C., Laurent, P., van der Werf, G., and Bistinas, I.: ESA Fire Climate Change Initiative (Fire_cci): MODIS Fire_cci Burned Area Pixel product, version 5.0. Centre for Environmental Data Analysis, https://doi.org/10.5285/9c666602b89e468493e1c907a4de62ff, 23 February 2018a.
Chuvieco, E., Pettinari, M. L., Lizundia Loiola, J., Bastarrika, A., Roteta, E., Tansey, K., Padilla Parellada, M., Wheeler, J., Lewis, P., Gomez-Dans, J., Brennan, J., Pereira, J. M., Oom, D., Campagnolo, M., Storm, T., Kaiser, J., Heil, A., Mouillot, F., Moreno, M. V., Yue, C., Laurent, P., van der Werf, G., and Bistinas, I.: ESA Fire Climate Change Initiative (Fire_cci): MODIS Fire_cci Burned Area Grid product, version 5.0, Centre for Environmental Data Analysis, https://doi.org/10.5285/f1c9c7aa210d4564bd61ed1a81d51130, 23 February 2018b.
Clifford, P., Richardson, S., and Hémon, D.: Assessing the significance of the correlation between two spatial processes, Biometrics, 45, 123–134, 1989.
Cochran, W. G.: Sampling Techniques, John Wiley & Sons, New York, 1977.
Cohen, W. B., Yang, Z., and Kennedy, R.: Detecting trends in forest disturbance and recovery using yearly Landsat time series: 2. TimeSync – Tools for calibration and validation, Remote Sens. Environ., 114, 2911–2924, https://doi.org/10.1016/j.rse.2010.07.010, 2010.
Congalton, R. G. and Green, K.: Assessing the Accuracy of Remotely Sensed Data: Principles and Applications, Lewis Publishers, Boca Raton, 137 pp., 1999.
Dutilleul, P., Clifford, P., Richardson, S., and Hemon, D.: Modifying the t test for assessing the correlation between two spatial processes, Biometrics, 49, 305–314, 1993.
Fleiss, J. L.: Statistical methods for rates and proportions, John Wiley & Sons, 1981.
Forkel, M., Dorigo, W., Lasslop, G., Teubner, I., Chuvieco, E., and Thonicke, K.: A data-driven approach to identify controls on global fire activity from satellite and climate observations (SOFIA V1), Geosci. Model Dev., 10, 4443–4476, https://doi.org/10.5194/gmd-10-4443-2017, 2017.
Gaveau, D. L., Salim, M. A., Hergoualc'h, K., Locatelli, B., Sloan, S., Wooster, M., Marlier, M. E., Molidena, E., Yaen, H., and DeFries, R.: Major atmospheric emissions from peat fires in Southeast Asia during non-drought years: evidence from the 2013 Sumatran fires, Sci. Rep.-UK, 4, https://doi.org/10.1038/srep06112, 2014.
GCOS: The Global Observing System for Climate: Implementation Needs, GCOS-200, World Meteorological Organization, Geneva, Switzerland, 2016.
Giglio, L., Loboda, T., Roy, D. P., Quayle, B., and Justice, C. O.: An active-fire based burned area mapping algorithm for the MODIS sensor, Remote Sens. Environ., 113, 408–420, 2009.
Giglio, L., Schroeder, W., and Justice, C. O.: The collection 6 MODIS active fire detection algorithm and fire products, Remote Sens. Environ., 178, 31–41, 2016.
Giglio, L., Boschetti, L., Roy, D. P., Humber, M. L., and Justice, C. O.: The Collection 6 MODIS Burned Area Mapping Algorithm and Product, Remote Sens. Environ., 217, 72–85, 2018.
Hantson, S., Pueyo, S., and Chuvieco, E.: Global fire size distribution is driven by human impact and climate, Global Ecol. Biogeogr., 24, 77–86, https://doi.org/10.1111/geb.12246, 2015.
Hargrove, W. W., Gardner, R., Turner, M., Romme, W., and Despain, D.: Simulating fire patterns in heterogeneous landscapes, Ecol. Model., 135, 243–263, 2000.
Hollmann, R., Merchant, C. J., Saunders, R. W., Downy, C., Buchwitz, M., Cazenave, A., Chuvieco, E., Defourny, P., Leeuw, G. D., Forsberg, R., Holzer-Popp, T., and Paul, F.: The ESA Climate Change Initiative: satellite data records for essential climate variables, B. Am. Meteorol. Soc., 94, 1541–1552, https://doi.org/10.1175/BAMS-D-11-00254.1, 2013.
Kennedy, R. E., Yang, Z., and Cohen, W. B.: Detecting trends in forest disturbance and recovery using yearly Landsat time series: 1. LandTrendr – Temporal segmentation algorithms, Remote Sens. Environ., 114, 2897–2910, https://doi.org/10.1016/j.rse.2010.07.008, 2010.
Kirches, G., Krueger, O., Boettcher, M., Bontemps, S., Lamarche, C., Verheggen, A., Lembrée, C., Radoux, J., and Defourny, P.: Land Cover CCI: Algorithm Theoretical Basis Document Version 2, Land_Cover_CCI_ATBDv2_2.3, Louvain, Belgium, 2013.
Kloster, S. and Lasslop, G.: Historical and future fire occurrence (1850 to 2100) simulated in CMIP5 Earth System Models, Global Planet. Change, 150, 58–69, 2017.
Knorr, W., Jiang, L., and Arneth, A.: Climate, CO2 and human population impacts on global wildfire emissions, Biogeosciences, 13, 267–282, https://doi.org/10.5194/bg-13-267-2016, 2016.
Lasslop, G., Thonicke, K., and Kloster, S.: SPITFIRE within the MPI Earth system model: Model development and evaluation, J. Adv. Model. Earth Sy., 6, 740–755, 2014.
Laurent, P., Mouillot, F., Yue, C., Ciais, P., Moreno, M. V., and Nogueira, J. M. P.: FRY, a global database of fire patch functional traits derived from space-borne burned area products, Scientific Data, 5, 180132, https://doi.org/10.1038/sdata.2018.132, 2018.
Mangeon, S., Field, R., Fromm, M., McHugh, C., and Voulgarakis, A.: Satellite versus ground-based estimates of burned area: A comparison between MODIS based burned area and fire agency reports over North America in 2007, The Anthropocene Review, 3, 76–92, 2016.
Marlier, M. E., DeFries, R. S., Voulgarakis, A., Kinney, P. L., Randerson, J. T., Shindell, D. T., Chen, Y., and Faluvegi, G.: El Nino and health risks from landscape fire emissions in southeast Asia, Nat. Clim. Change, 3, 131–136, 2013.
Martín, M. P., Gómez, I., and Chuvieco, E.: Performance of a burned-area index (BAIM) for mapping Mediterranean burned scars from MODIS data, in: Proceedings of the 5th International Workshop on Remote Sensing and GIS applications to Forest Fire Management: Fire Effects Assessment, edited by: Riva, J., Pérez-Cabello, F., and Chuvieco, E., Universidad de Zaragoza, GOFC-GOLD, EARSeL, Paris, 193–198, 2005.
Moreno Ruiz, J., Lázaro, J., Cano, I., and Leal, P.: Burned Area Mapping in the North American Boreal Forest Using Terra-MODIS LTDR (2001–2011): A Comparison with the MCD45A1, MCD64A1 and BA GEOLAND-2 Products, Remote Sensing, 6, 815–840, 2014.
Moritz, M. A., Batllori, E., Bradstock, R. A., Gill, A. M., Handmer, J., Hessburg, P. F., Leonard, J., McCaffrey, S., Odion, D. C., and Schoennagel, T.: Learning to coexist with wildfire, Nature, 515, 58–66, 2014.
Mouillot, F., Schultz, M. G., Yue, C., Cadule, P., Tansey, K., Ciais, P., and Chuvieco, E.: Ten years of global burned area products from spaceborne remote sensing – A review: Analysis of user needs and recommendations for future developments, Int. J. Appl. Earth Obs., 26, 64–79, 2014.
Nogueira, J., Ruffault, J., Chuvieco, E., and Mouillot, F.: Can We Go Beyond Burned Area in the Assessment of Global Remote Sensing Products with Fire Patch Metrics?, Remote Sensing, 9, https://doi.org/10.3390/rs9010007, 2017.
Olson, D. M., Dinerstein, E., Wikramanayake, E. D., Burgess, N. D., Powell, G. V. N., Underwood, E. C., D'amico, J. A., Itoua, I., Strand, H. E., Morrison, J. C., Loucks, C. J., Allnutt, T. F., Ricketts, T. H., Kura, Y., Lamoreux, J. F., Wettengel, W. W., Hedao, P., and Kassem, K. R.: Terrestrial Ecoregions of the World: A New Map of Life on Earth, BioScience, 51, 933–938, 2001.
Padilla, M., Stehman, S. V., Hantson, S., Oliva, P., Alonso-Canas, I., Bradley, A., Tansey, K., Mota, B., Pereira, J. M., and Chuvieco, E.: Comparing the Accuracies of Remote Sensing Global Burned Area Products using Stratified Random Sampling and Estimation, Remote Sens. Environ., 160, 114–121, https://doi.org/10.1016/j.rse.2014.01.008, 2015.
Padilla, M., Olofsson, P., Stehman, S. V., Tansey, K., and Chuvieco, E.: Stratification and sample allocation for reference burned area data, Remote Sens. Environ., 203, 240–255, https://doi.org/10.1016/j.rse.2017.06.041, 2017.
Pedregosa, F., Varoquaux, G., Gramfort, A., Michel, V., Thirion, B., Grisel, O., Blondel, M., Prettenhofer, P., Weiss, R., and Dubourg, V.: Scikit-learn: Machine learning in Python, J. Mach. Learn. Res., 12, 2825–2830, 2011.
Pereira, J. M. C.: A Comparative Evaluation of NOAA/AVHRR Vegetation Indexes for Burned Surface Detection and Mapping, IEEE T. Geosci. Remote, 37, 217–226, 1999.
Pinty, B. and Verstraete, M. M.: GEMI: a non-linear index to monitor global vegetation from satellites, Vegetatio, 101, 15–20, 1992.
Plummer, S., Lecomte, P., and Doherty, M.: The ESA Climate Change Initiative (CCI): A European contribution to the generation of the Global Climate Observing System, Remote Sens. Environ., 203, 2–8, https://doi.org/10.1016/j.rse.2017.07.014, 2017.
Plummer, S. E., Arino, O., Simon, M., and Steffen, W.: Establishing an Earth Observation Product Service for the Terrestrial Carbon Community: The GLOBCARBON Initiative, Mitig. Adapt. Strat. Gl., 11, 97–111, 2006.
Ramo, R. and Chuvieco, E.: Developing a Random Forest Algorithm for MODIS Global Burned Area Classification, Remote Sensing, 9, 1193, https://doi.org/10.3390/rs9111193, 2017.
Reid, C. E., Brauer, M., Johnston, F. H., Jerrett, M., Balmes, J. R., and Elliott, C. T.: Critical review of health impacts of wildfire smoke exposure, Environ. Health Persp., 124, https://doi.org/10.1289/ehp.1409277, 2016.
Román-Cuesta, R. M., Gracia, M., and Retana, J.: Factors influencing the formation of unburned forest islands within the perimeter of a large forest fire, Forest Ecol. Manage., 258, 71–80, 2009.
Roos, C. I., Scott, A. C., Belcher, C. M., Chaloner, W. G., Aylen, J., Bird, R. B., Coughlan, M. R., Johnson, B. R., Johnston, F. H., and McMorrow, J.: Living on a flammable planet: interdisciplinary, cross-scalar and varied cultural lessons, prospects and challenges, Philos. T. R. Soc. B, 371, 20150469, https://doi.org/10.1098/rstb.2015.0469, 2016.
Roteta, E., Bastarrika, A., Storm, T., and Chuvieco, E.: Development of a Sentinel-2 burned area algorithm: generation of a small fire database for northern hemisphere tropical Africa, Remote Sens. Environ., in review, 2018.
Roy, D., Jin, Y., Lewis, P., and Justice, C.: Prototyping a global algorithm for systematic fire-affected area mapping using MODIS time series data, Remote Sens. Environ., 97, 137–162, 2005.
Roy, D. P., Boschetti, L., and Justice, C. O.: The collection 5 MODIS burned area product – Global evaluation by comparison with the MODIS active fire product, Remote Sens. Environ., 112, 3690–3707, 2008.
Sturtevant, B. R., Miranda, B. R., Yang, J., He, H. S., Gustafson, E. J., and Scheller, R. M.: Studying fire mitigation strategies in multi-ownership landscapes: Balancing the management of fire-dependent ecosystems and fire risk, Ecosystems, 12, 445–461, 2009.
Tansey, K., Grégoire, J. M., Defourny, P., Leigh, R., Peckel, J. F., Bogaert, E. V., and Bartholome, J. E.: A new, global, multi-annual (2000–2007) burnt area product at 1 km resolution, Geophys. Res. Lett., 35, L01401, https://doi.org/10.1029/2007GL031567, 2008.
van der Werf, G. R., Randerson, J. T., Giglio, L., van Leeuwen, T. T., Chen, Y., Rogers, B. M., Mu, M., van Marle, M. J. E., Morton, D. C., Collatz, G. J., Yokelson, R. J., and Kasibhatla, P. S.: Global fire emissions estimates during 1997–2016, Earth Syst. Sci. Data, 9, 697–720, https://doi.org/10.5194/essd-9-697-2017, 2017.
Wessels, K. J., Van Den Bergh, F., Roy, D. P., Salmon, B. P., Steenkamp, K. C., MacAlister, B., Swanepoel, D., and Jewitt, D.: Rapid land cover map updates using change detection and robust random forest classifiers, Remote Sensing, 8, https://doi.org/10.3390/rs8110888, 2016.