the Creative Commons Attribution 4.0 License.
the Creative Commons Attribution 4.0 License.
 | 10 Jan 2018
Modulation of glacier ablation by tephra coverage from Eyjafjallajökull and Grímsvötn volcanoes, Iceland: an automated field experiment
Rebecca Möller
Marco Möller
Peter A. Kukla
Christoph Schneider
We report results from a field experiment investigating the influence of volcanic tephra coverage on glacier ablation. These influences are known to be significantly different from those of moraine debris on glaciers due to the contrasting grain size distribution and thermal conductivity. Thus far, the influences of tephra deposits on glacier ablation have rarely been studied. For the experiment, artificial plots of two different tephra types from Eyjafjallajökull and Grímsvötn volcanoes were installed on a snow-covered glacier surface of Vatnajökull ice cap, Iceland. Snow-surface lowering and atmospheric conditions were monitored in summer 2015 and compared to a tephra-free reference site. For each of the two volcanic tephra types, three plots of variable thickness (∼ 1.5, ∼ 8.5 and ∼ 80 mm) were monitored. After limiting the records to a period of reliable measurements, a 50-day data set of hourly records was obtained, which can be downloaded from the Pangaea data repository (https://www.pangaea.de; doi:10.1594/PANGAEA.876656). The experiment shows a substantial increase in snow-surface lowering rates under the ∼ 1.5 and ∼ 8.5 mm tephra plots when compared to uncovered conditions. Under the thick tephra cover some insulating effects could be observed. These results are in contrast to other studies which depicted insulating effects for much thinner tephra coverage on bare-ice glacier surfaces. Differences between the influences of the two different petrological types of tephra exist but are negligible compared to the effect of tephra coverage overall.


Deposits of sedimentary materials on the surface of glaciers are known to have significant influence on glacier melt as they alter the energy exchange processes at the surface (e.g., Nicholson and Benn, 2013; Mattson et al., 1993; Østrem, 1959). The thickness of the layer controls whether the dominant factor at the glacier surface is the decrease in albedo or the increase in thermal resistance (Möller et al., 2016). The former implies an increase in the energy gain to the glacier from solar radiation while the latter implies a decrease because of reduced heat conduction to the glacier surface. As a result, thin layers of supraglacial deposits lead to increased glacier melt, while thick layers imply decreased glacier melt or even insulation. With increasing layer thickness glacier melt peaks at the so-called effective thickness. With further increasing layer thickness, glacier melt decreases again and returns to the level of uncovered conditions at the so-called critical thickness. Beyond this thickness, glacier melt decreases further towards the limit of complete insulation (Adhikary et al., 1997).
The influence of tephra on glacier melt is usually parametrized using in situ data for calibration. However, most of the formulations developed thus far are designed to capture the effects of moraine debris deposits which are usually formed by layers with thicknesses on the order of meters or at least decimeters or centimeters. In recent years there have been numerous studies dealing with the relationship between debris thickness and resulting modification of ablation (e.g., Collier et al., 2015; Juen et al., 2014; Pratap et al., 2015; Rounce et al., 2015).
Volcanically active regions of the world in sub-polar and polar environments episodically experience the deposition of tephra on glacier surfaces after explosive volcanic eruptions. Volcanic tephra deposits show a wider range of depositional thicknesses than moraine debris, i.e., from sub-millimeter to meter scale. They also feature distinctly different thermal properties (Brock et al., 2007). The model formulation of Evatt et al. (2015) is valid for all thicknesses from dust to meter scale. However, dedicated studies dealing with the relationship between tephra thickness and the intensity of induced ablation change are remarkably less numerous than those dealing with moraine debris, even if supraglacial tephra deposits are known to significantly influence glacier surface processes and mass balance (e.g., Kirkbride and Dugmore, 2003; Möller et al., 2014; Nield et al., 2013). So far, only three recent studies have carried out a systematic, quantitative investigation of the influence of tephra deposits of varying thickness on glacier ablation (Dragosics et al., 2016; Juen et al., 2013; Möller et al., 2016). However, these studies were carried out on bare-ice surfaces and only rely on results obtained over short periods. The experiments covered periods of only 17 (Dragosics et al., 2016) or 13 days (Möller et al., 2016) of regular daily measurements. Moreover, the experiment of Dragosics et al. (2016) was carried out in an ex situ, non-local environment under controlled, partly laboratory-like conditions. The experiment of Juen et al. (2013) lasted for about 1 month, but ablation measurements were mostly carried out at an irregular frequency.
Here, we present data from automated, continuous measurements of meteorological conditions and snow-surface lowering under artificially installed plots of volcanic tephra of different type and thickness. The measurements were obtained from a field experiment which was carried out on Vatnajökull ice cap, Iceland, over the 2015 summer season. Snow-surface lowering rates under different thicknesses of tephra during days with and without precipitation are compared to illustrate the variability of snow-surface lowering with tephra thickness and the influence of different meteorological conditions. It has to be noted that our measurements are only a proxy for snow ablation, as snow density changes beneath the tephra plots (which also impact snow-surface lowering) were not quantified due to logistical limitations.
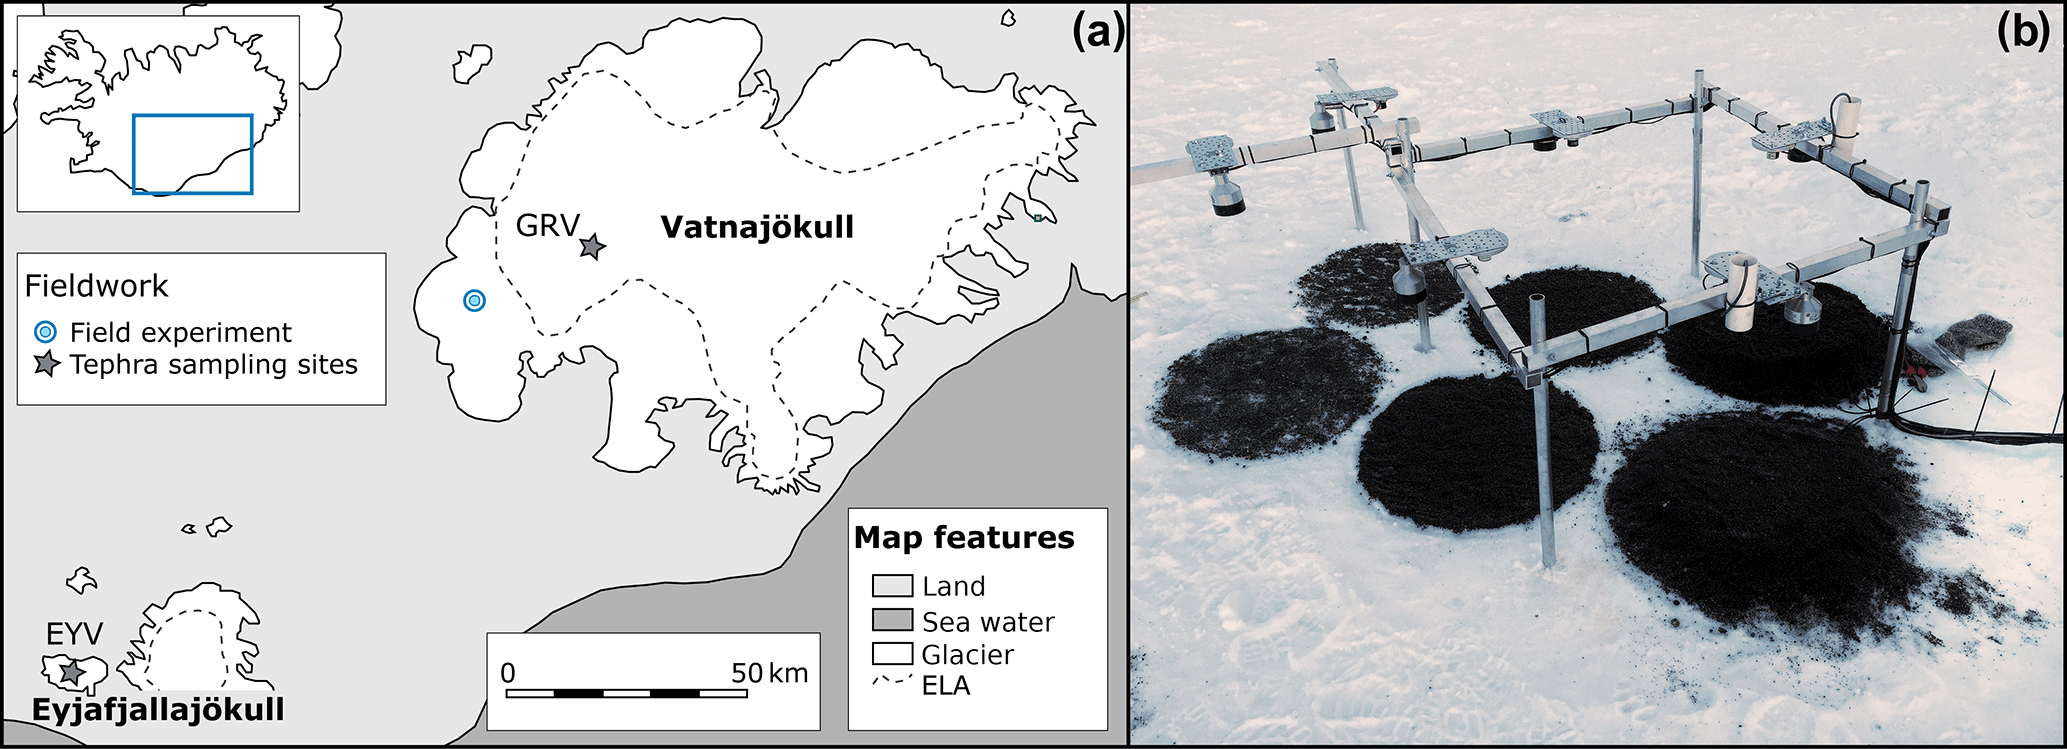
Figure 1Overview of the field experiment. The locations of tephra sampling at the calderas of Eyjafjallajökull volcano (EYV) and Grímsvötn volcano (GRV) and the location of the field experiment are shown in (a). The installation of the field experiment is shown in (b). The three plots in the foreground are covered by EYV tephra and the three plots in the back by GRV tephra.
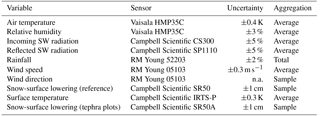
Table 1Measured quantities at the field experiment installation and at the automatic weather station. For each variable the type of the sensor is given along with its uncertainty and the type of data aggregation over each 1 h record interval.
2.1 Study site
The field experiment was carried out at an elevation of ∼ 970 m a.s.l. on Tungnaárjökull (64.3253∘ N, 18.0476∘ W), a glacier which is part of the western Vatnajökull ice cap, Iceland (Fig. 1a). The site was situated on a slightly inclined surface, facing approximately west-southwest. It was characterized by wind-compacted snow coverage with a homogeneous depth of ∼ 2.7 ± 0.2 m throughout the site according to snow-depth probing. Layering of the snowpack was not well pronounced and snow density showed little variability over the vertical profile with an integrated mean of ∼ 410 kg m−3, which was obtained by stepwise measurements along a vertical profile.
2.2 Design and setup
The field experiment was designed to quantify the influence of volcanic tephra (with variable type and thickness) on snow-surface lowering and to relate the measured lowering to meteorological conditions. A set of six artificial plots of tephra coverage with a diameter of 0.7 m were installed at the study site. Three of these plots were made from tephra of Eyjafjallajökull volcano (EYV) and the other three from tephra of Grímsvötn volcano (GRV; Fig. 1a). Both types of tephra were spread out at thicknesses of ∼ 1.5, ∼ 8.5 and ∼ 80 mm. This was done by weighing out tephra material according to its bulk density (1276 kg m−3 for EYV and 791 kg m−3 for GRV) as dispersal by thickness was not feasible at the millimeter scale. The three thicknesses approximately match the effective thickness (1.5 mm), the critical thickness (8.5 mm) and a thickness under which the dominance of insulation can be considered. These values were chosen according to results of a short, 13-day field experiment by Möller et al. (2016) carried out on bare glacier ice using tephra of GRV.
Contiguous to the tephra plots where snow-surface lowering was recorded, standard meteorological parameters were measured and recorded by an automatic weather station (AWS). The parameters include air temperature and relative humidity at two levels (initially 0.3 and 1.1 m above snow, but increasing according to snow-surface lowering), wind speed and direction (initially 2.1 m above snow), liquid precipitation and incoming and reflected shortwave radiation. For measuring snow-surface lowering at the tephra plots, an aluminum structure for sensor installation was mounted (Fig. 1b). Over each of the six plots ultrasonic height gauges measured snow-surface lowering at hourly intervals. In addition, sensors for surface temperature measurements were installed over the two ∼ 80 mm plots. Table 1 gives an overview of all sensor and measurement specifications for both the AWS and the tephra plots. The snow-surface lowering measurement at the AWS provides a reference representing non-tephra covered conditions.
A camera system, taking photographs hourly, was setup to monitor and document the conditions of tephra plots and AWS. Unfortunately, it stopped working after a few days and we do not use these data here.
2.3 Tephra sampling
The tephra material was directly sampled at the calderas of EYV and GRV (Fig. 1a) in order to obtain pristine material. At EYV the tephra was acquired from inside the caldera (63.6314∘ N, 19.6373∘ W). This sampling was carried out on 7 May 2015. At GRV the tephra was collected at rocky outcrops near the southern caldera rim (64.4061∘ N, 17.2741∘ W). Here, sampling was done on 8 May 2015. At both locations, the tephra was taken from active geothermal areas.
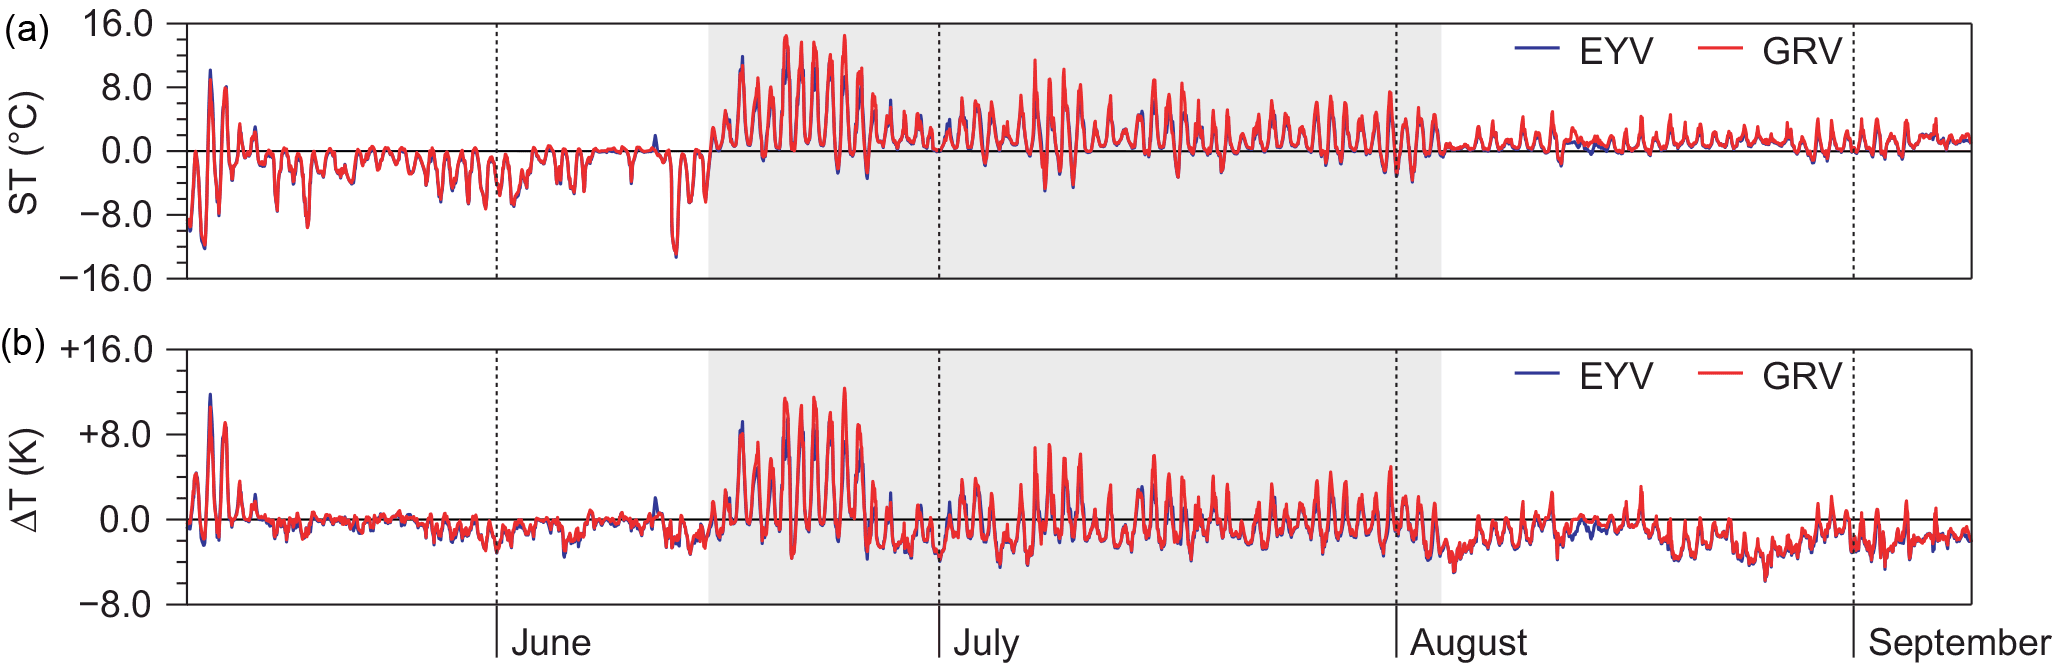
Figure 2Records of measured hourly surface temperatures at the two ∼ 80 mm tephra plots (a) and calculated differences between these surface temperatures and air temperatures measured at the automatic weather station (b) over 11 May to 8 September. The air temperatures are calculated as the mean of upper and lower air temperature sensor at the AWS. The types of tephra (EYV for Eyjafjallajökull volcano and GRV for Grímsvötn volcano) on which the surface temperatures were measured are indicated by color code. The grey shading in the center of the time series indicates the period considered in the final data set, i.e., 15 June to 3 August.
2.4 Measurements and data preparation
The experiment started on 10 May 2015 and recorded hourly means and samples from the sensors described in Table 1 until 8 September 2015. Measurements stopped on 9 September 2015, when ablation was so advanced that the aluminum structure collapsed. During the collapse, the lowermost parts of the structure were still anchored inside the ice, but the center of mass of the overlying installation was probably too high above ground. The timing of the collapse was easily identifiable from abnormal radiation and distance measurements. For studying the influences of tephra coverage on snow-surface lowering, the records had to be narrowed down to a period without snow cover on top of the tephra. The selection of the suitable period is based on measured surface temperatures on the tephra packs of the two ∼ 80 mm plots (Fig. 2).
Surface temperature is generally closely related to the intra-day cycles of air temperature and shortwave radiation. However, snow or ice surfaces cannot exceed 0 ∘C. This implies that surface temperatures which follow a regular above-zero intra-day cycle indicate a completely snow- or ice-free surface. In our field experiment, this is the case for the period after 15 June 2015 (Fig. 2). Up until this date, sub-zero surface temperatures prevail despite the presence of intra-day air temperature cycles which regularly exceed 0 ∘C. This indicates at least partly snow covered conditions on the surfaces of the tephra plots.
From 4 August 2015 onwards, the intra-day cycles of surface temperature start to become irregular. In addition, the periodic, substantially positive offsets of surface temperature over air temperature, which occurred consistently over 15 June to 3 August, were replaced by rather irregular, predominantly negative offsets (Fig. 2). This combination of observations suggests that the tephra packs started to disintegrate, providing space for snow or bare-ice outcrops which destroyed the homogeneous surfaces of the tephra plots. Over homogeneous, low-albedo tephra coverage, shortwave radiation adds considerably to the energy gain at the surface and thus drives surface temperatures far above the air temperature level. Over rather patchy tephra coverage with high-albedo bare-ice outcrops, the integrated energy gain due to absorbed shortwave radiation is much lower. In addition, the surface temperature of the outcrops is capped at 0 ∘C. The integrated surface temperature of the tephra plots might thus lie well below the air temperature level.
Based on these considerations, we limit the observations to the 50-day period covering 15 June to 3 August (Fig. 2). The final data set contains hourly averaged data for all meteorological parameters measured at the AWS (Fig. 3a). Moreover, it contains hourly data from all seven ultrasonic height gauges, i.e., from snow-surface lowering measurements at the six tephra plots and at the reference site at the AWS (Fig. 3b).
We compared the snow-surface lowering rates at the different plots. To facilitate this analysis, running 24 h differences, i.e., running daily snow-surface lowering rates, were calculated for the data of each of the seven sensors whenever valid measurements existed at all six tephra plots and at the reference site. This was undertaken in order to assure full comparability of the 24 h snow-surface lowering values. These running 24 h differences are also part of the published data set.
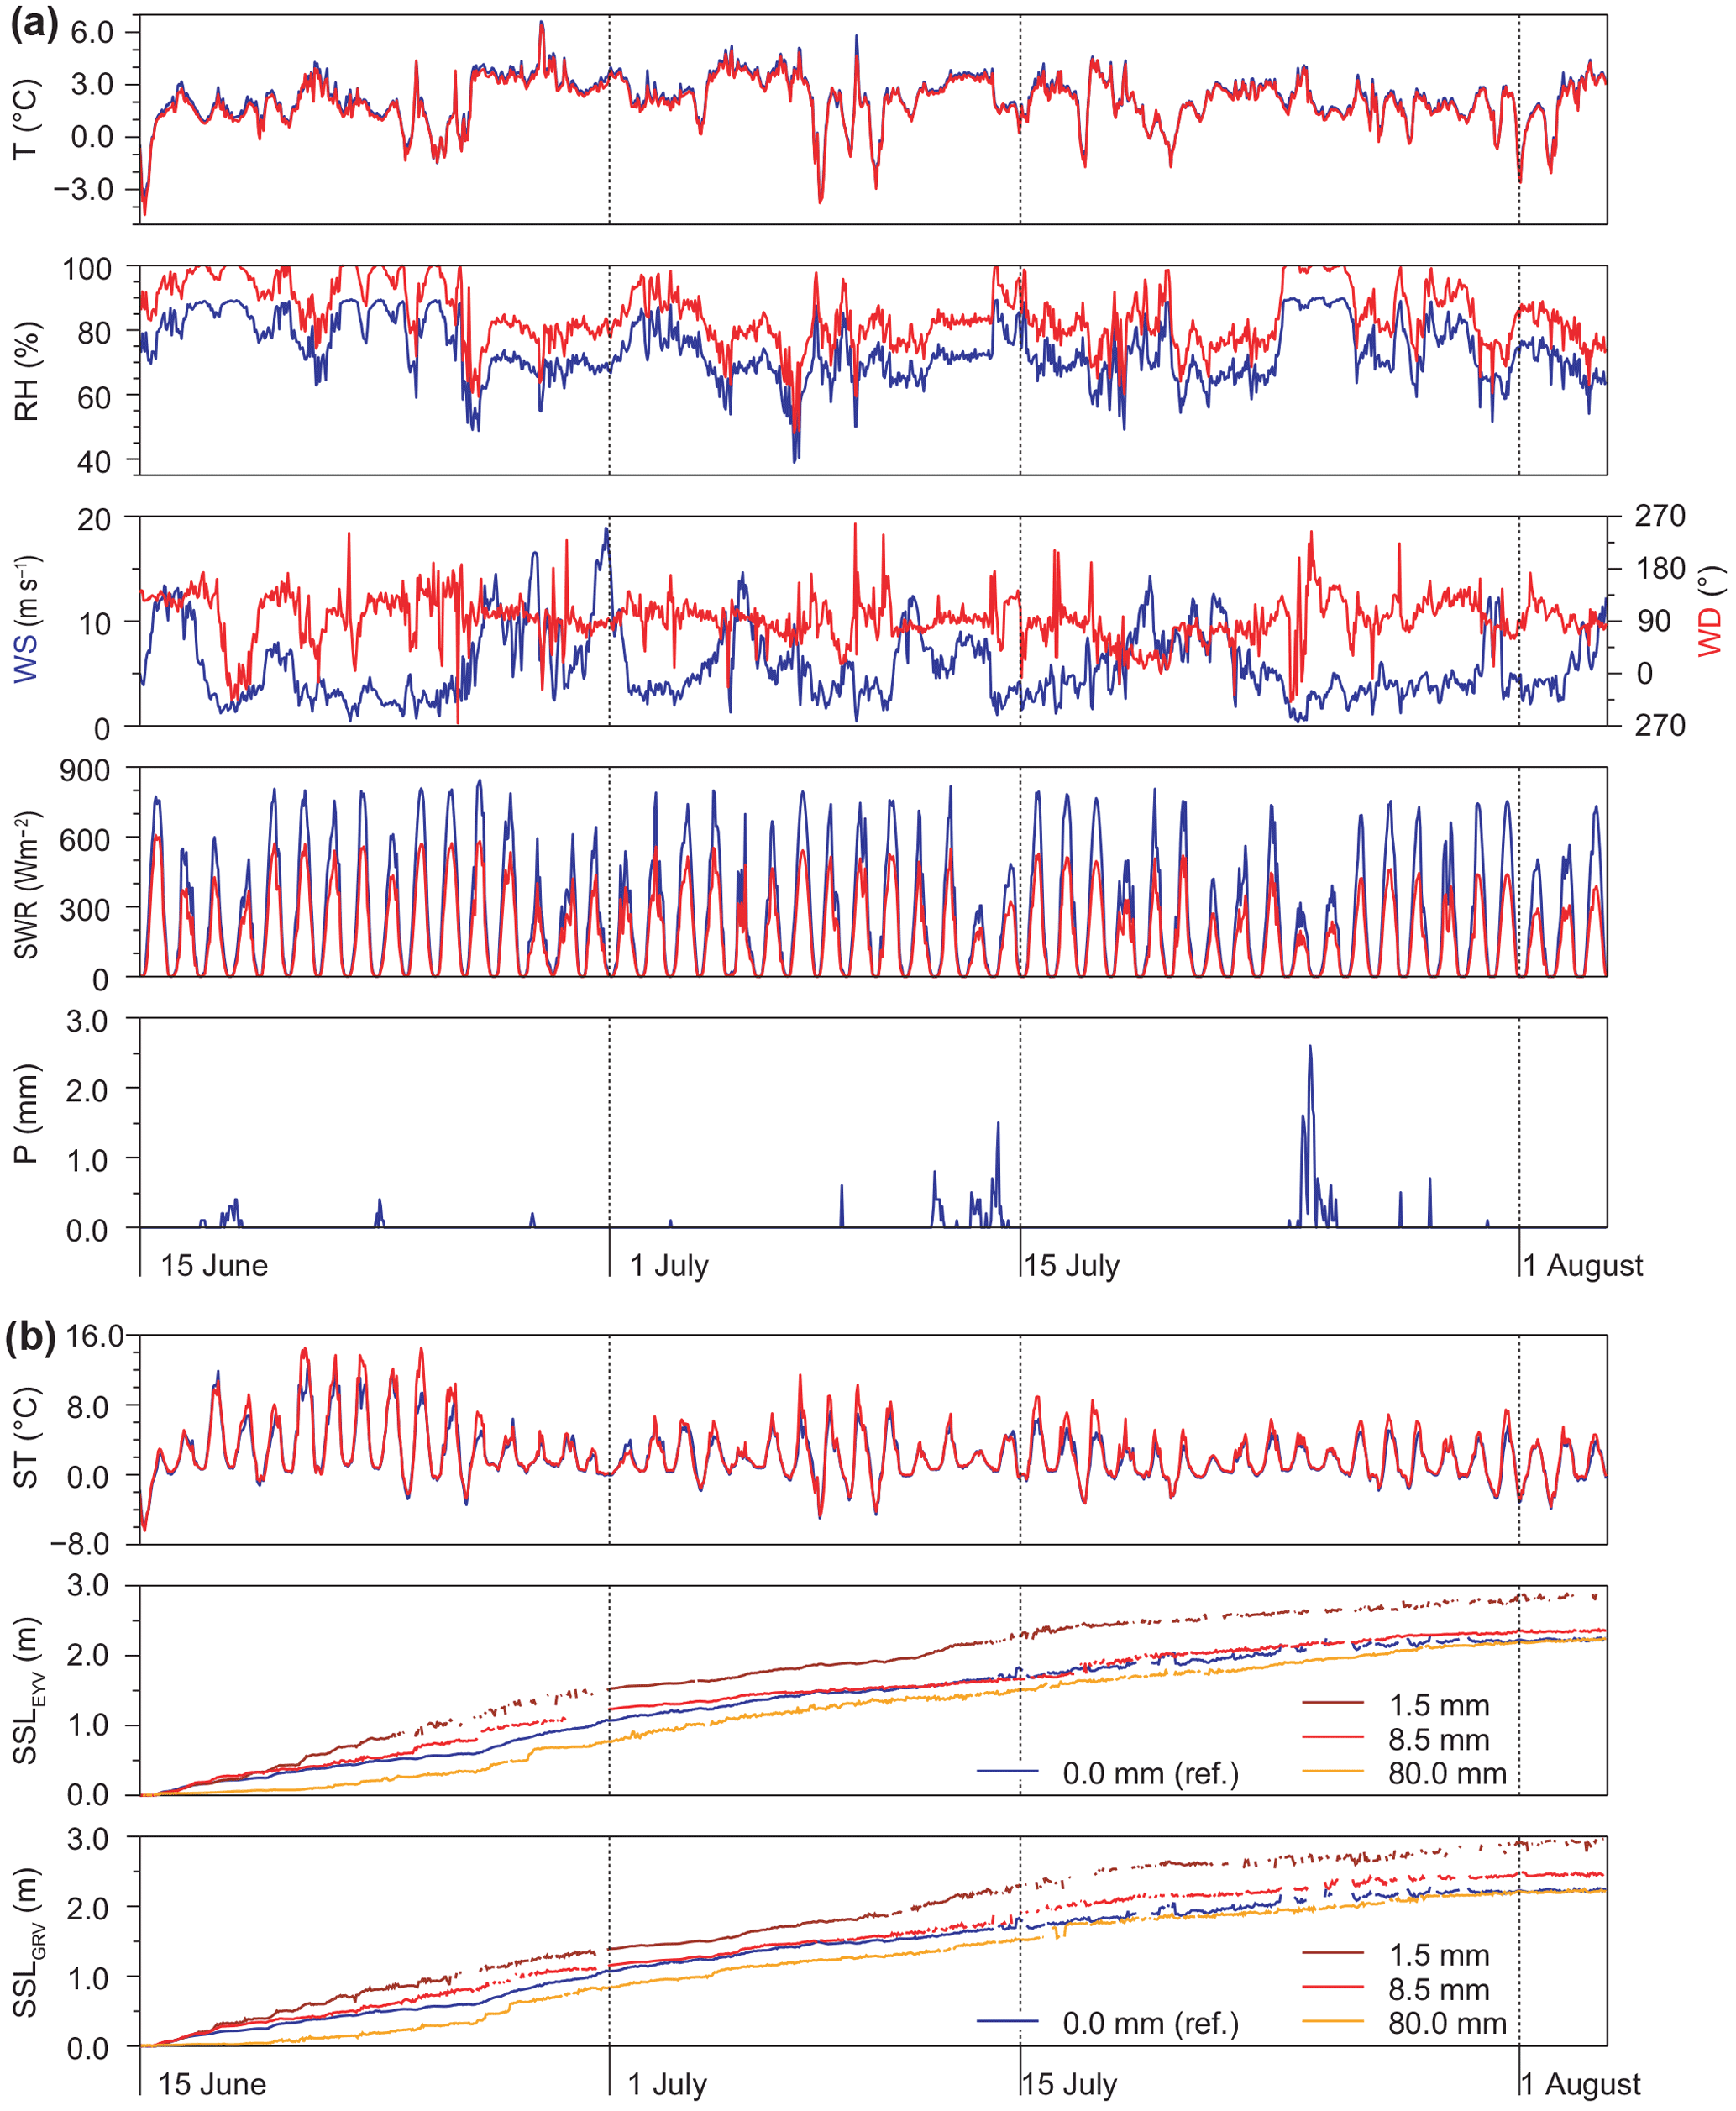
Figure 3Hourly records of the measurements of all sensors installed at the automatic weather station are shown in (a), and measurements of all sensors mounted at the field experiment installation are shown in (b). Records are shown for 15 June to 3 August. For air temperature (T) and relative humidity (RH) the records of the upper sensor (blue line) are shown together with those of the lower sensor (red line). Wind speed (blue line) is shown together with wind direction (red line); note the different y axes here. Incoming shortwave radiation (SWR, blue line) is shown together with reflected shortwave radiation (red line). For precipitation (P), only the liquid fraction has been measured. Surface temperatures (ST) are shown for the ∼ 80 mm plots of tephra from Eyjafjallajökull volcano (EYV, blue line) and from Grímsvötn volcano (GRV, red line). Cumulative snow-surface lowering (SSL) is shown over the different plots (indicated by color codes) of EYV tephra and GRV tephra.
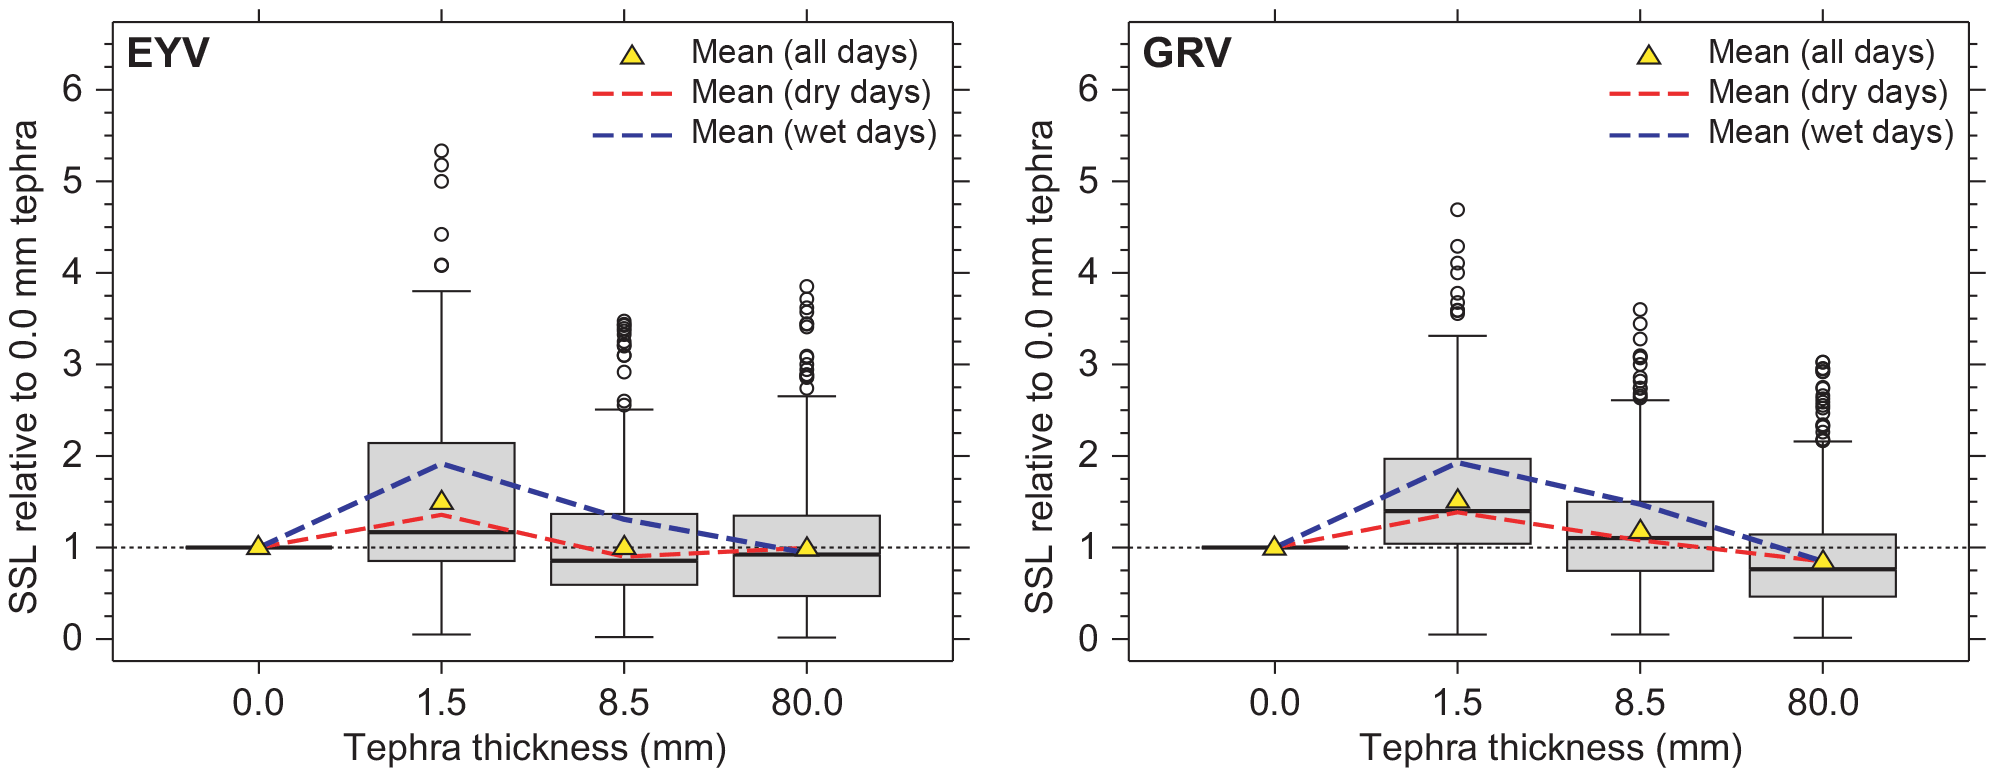
Figure 4Running 24 h snow-surface lowering (SSL) rates at the different plots of tephra from Eyjafjallajökull volcano (EYV) and from Grímsvötn volcano (GRV) relative to the reduction rates measured at the non-tephra covered reference site. The box plots give an overview of the data spread across all running 24 h values recorded during the field experiment period (15 June to 3 August). Outliers are indicated as open circle symbols. Mean values over the entire field experiment period are indicated by yellow triangles, and the mean values over wet (precipitation > 0.1 mm) and dry (precipitation ≤ 0.1 mm) days are shown as color-coded line graphs.
Snow-surface lowering measurements over the chosen time period (15 June to 3 August 2015) reveal a loss of 2.25 m of snow cover at the reference site and between 2.21 and 2.97 m at the tephra plots (Fig. 3b). During almost the entire period the study site showed snow coverage. Only for the plots with ∼ 1.5 mm tephra coverage it cannot be ruled out that the snowpack beneath the plots disappeared just before the end of the study period. For the reference site, the snowpack completely disappeared during the second week of August according to the measured albedo values. The progressive snow-surface lowering led to an increasing measurement uncertainty towards the end of the study period because the sensors' footprints might have extended beyond the borders of the tephra plots and erosion of the tephra material might have destroyed the previously homogeneous dispersal across the plots. Nevertheless, the running daily snow-surface lowering rates, i.e., the slopes of the snow-surface lowering curves (Fig. 3b), show small variability with time, even if ephemeral increases sporadically occur at the end of June and during mid-July. The lowering rates at the six different plots become more similar over the second half of July, suggesting an incipient disintegration of the different tephra packs presumably due to erosion by meltwater.
Major disturbances occur in the snow-surface lowering curves of two of the GRV tephra plots (∼ 8.5 and ∼ 80 mm) in mid-July (Fig. 3b). On 14 July the measured distance at the ∼ 8.5 mm GRV tephra plot increased by ∼ 0.20 m, followed by an increase of ≥ 0.15 m at the ∼ 80 mm GRV tephra plot on 16 July. These disturbances coincide with a major rain event (Fig. 3a). It can thus not be ruled out that partial destructions of the tephra plots and of the upper layers of the snowpack occurred at this date subsequently distorting the distance measurements at the six tephra plots.
The relationships between tephra thickness and running daily snow-surface lowering rates (Fig. 4) resemble the findings of previous studies dealing with bare-ice ablation (Kirkbride and Dugmore, 2003; Mattson et al., 1993; Möller et al., 2016). At the thin (∼ 1.5 mm) tephra plots, snow-surface lowering was substantially increased by a factor of 1.49 ± 0.88 (mean ± 1σ over time) under EYV tephra and by a factor of 1.51 ± 0.71 under GRV tephra. At the tephra plots geared to the critical thickness of the tephra (∼ 8.5 mm), snow-surface lowering was equal to uncovered conditions under EYV tephra (1.00 ± 0.61) and slightly increased under GRV tephra (1.17 ± 0.57). However, at the thick tephra plots (∼ 80 mm) the observed snow-surface lowering did not match expectations drawn from previous bare-ice knowledge. Under EYV tephra, snow-surface lowering was close to uncovered conditions (0.98 ± 0.73) and under GRV tephra only a slight insulation effect was present (0.85 ± 0.59). The rather high standard deviations, however, suggest a considerable, misleading influence of sporadic, anomalously high and potentially erroneous values. Our assumption, which is supported by the distinctly more moderate medians of 0.93 (EYV) and 0.76 (GRV; Fig. 4), is of insulating conditions under both ∼ 80 mm tephra covers. Nevertheless, the high snow-surface lowering rates at the two sites with ∼ 80 mm tephra cover suggest substantially different snowpack behavior than bare glacier ice behavior under tephra coverage.
This unexpected and thus important finding cannot be explained in full detail here because of limitations in the experimental setup. One obvious explanation is the fact that pure snow ablation is masked by additional processes in the measurements conducted. Snow-surface lowering resulting from settling and compaction of the snowpack as well as from metamorphism on the snow-crystal level also definitely impact the measurements. Moreover, the rather small horizontal extent of the tephra plots probably permits lateral influences of weather conditions on the snowpack beneath the plots. Explanations beyond these influences cannot be given, because the pure, energy-balance-controlled ablation signal cannot be isolated from measured snow-surface lowering. It is thus recommended that future experiment setups at least account for snow density variations.
Distinct differences were observed between snow-surface lowering rates during periods with and without precipitation (Fig. 4). On wet days the increase in snow-surface lowering rates under the thin tephra covers compared to uncovered conditions is even more pronounced than it is on dry days. This finding is in clear contrast to short-term measurements by Möller et al. (2016) on bare glacier ice. Their study shows that on wet days sub-tephra ice ablation rates are even decreased when compared to uncovered conditions. The increase in snow-surface lowering under the ∼ 8.5 mm tephra covers compared to uncovered conditions is also higher on wet days than on dry days. This implies that the critical thickness of wet tephra is generally higher than that of dry tephra. The strength of the small insulation effect at the thick ∼ 80 mm tephra plots is, however, independent of the allocation to dry or to wet days.
There were average summer meteorological conditions during the field experiment period (15 June to 3 August 2015; Fig. 3a). Air temperature mostly fluctuated between 0 and +4 ∘C (with few outliers) and showed a mean of +2.1 ± 1.4 ∘C (mean ± 1σ). Thereby, mean (± 1σ) air temperature gradients between lower and upper sensors amount to +0.20 ± 0.15 K m−1. Daily albedo means decreased from ∼ 0.71 during the first week of the field experiment period to ∼ 0.58 during its last week. The associated daily mean of net shortwave radiation fluxes was 86.0 ± 22.4 W m−2. The mostly undisturbed daily cycles of incoming shortwave radiation suggest little cloud coverage. Accordingly, total rainfall over the period sums up to only 40.2 mm. However, high wind speeds of 5.65 ± 3.34 m s−1 (mean ± 1σ) with peak wind periods reaching 12–19 m s−1 might have led to considerable undercatch of precipitation by the tipping-bucket rain gauge (Sugiura et al., 2006). The by far most frequently occurring wind directions (ENE to ESE) resemble the katabatic flow direction down the western slope of Vatnajökull.
The final data set is organized in one single csv file which is available for download from the Pangaea Earth and environmental sciences data repository (Möller et al., 2017; https://doi.org/10.1594/PANGAEA.876656). It contains 2904 hourly samples (11 May to 8 September) of 18 variables. Among these, the six variables related to snow-surface lowering measurements at the artificial tephra plots are limited to 1200 hourly samples (15 June to 3 August) only (see Sect. 2.4).
A field experiment, studying the influences of different types of volcanic tephra on snow-surface lowering, was conducted on Vatnajökull ice cap, Iceland, in summer 2015. Two types of Icelandic tephra were compared, one from Eyjafjallajökull volcano and one from Grímsvötn volcano. Both tephras were sampled right before the start of the experiment at the calderas of the respective volcanoes. For the experiment, three different artificial plots of different thickness (∼ 1.5, ∼ 8.5 and ∼ 80 mm) were installed from both tephras. Snow-surface lowering at all six tephra plots and at a tephra-free reference site was monitored automatically over the summer season jointly with surface temperature on the two ∼ 80 mm tephra plots and concurrent atmospheric variables.
The experiment ran from mid-May to mid-September. Snow-surface lowering could be determined for 50 days (15 June to 3 August) at hourly resolution. The data set comprises records of air temperature and relative humidity at two levels, wind speed and direction, rainfall, incoming and reflected shortwave radiation and snow-surface lowering (in terms of distance from sensor to surface) over a non-tephra covered reference site and over the six tephra plots. Surface temperature was additionally measured at the two ∼ 80 mm tephra plots. We presented a comparison of snow-surface lowering rates under the different tephra plots.
Snow-surface lowering showed substantial median increases at the two ∼ 1.5 mm tephra plots (∼ 17 % under Eyjafjallajökull tephra and ∼ 40 % under Grímsvötn tephra). However, snow-surface lowering was also considerably increased at the ∼ 8.5 mm Grímsvötn tephra plot (median of ∼ 11 %), which contrasts with results of previous studies on bare-ice glacier surfaces. Insulation was small even under the thick ∼ 80 mm plots (median reductions of ∼ 7 % under Eyjafjallajökull tephra and ∼ 24 % under Grímsvötn tephra). This also stands in contrast to earlier bare-ice results, where almost full insulation was found under comparably thick tephra covers. The increase in snow-surface lowering on days with rainfall under thinner tephra covers compared to uncovered conditions is markedly higher than on days without rainfall. This is in contrast to bare-ice conditions, where no ablation increase is present on rainfall days at all. This finding leaves room for further investigation. Influence of tephra type is small compared to the other factors.
For potential future experiments, the results and our experience in the field suggest that frequent snow profile analyses or at least snow density measurements over the experiment period are required to interpret the snow-surface lowering measurements obtained with regards to snow ablation. However, this is logistically challenging, as would be the suggested use of larger tephra plot diameters, which would better prevent snow-surface lowering measurements from being influenced by lateral energy fluxes from the surface to the sub-tephra snowpack. Installing the six tephra plots with a diameter of 2.0 m instead of 0.7 m would have required the transport of over 320 kg of tephra (instead of ∼ 115 kg) from the two sampling sites to the field experiment site.
In conclusion, the experiment delivers a data set which clearly illustrates that the influences of supraglacial tephra cover on glacier ablation are considerably different, depending on the surface of the glacier, i.e., snow or bare ice. To our knowledge, this data set is the first to continuously measure snow-surface lowering under different types and thicknesses of volcanic tephra. Together with the simultaneously acquired meteorological conditions, this data set allows for further in-depth study of the influence of weather conditions on sub-tephra snowmelt. Moreover, it can readily be included as a calibration or validation data set in broader studies on the influences of supraglacial particle cover on ablation.
The authors declare that they have no conflict of interest.
The field experiment was funded by grant no. SCHN680/6-1 and no. KU1476/5-1 of
the German Research Foundation (DFG). We thank the Vatnajökull National
Park administration for granting permission to carry out the experiment and
the associated tephra sampling at Grímsvötn caldera. Helpful comments on
the manuscript by Jan Lenaerts and Christoph Mayer are gratefully
acknowledged.
Edited by: Reinhard
Drews
Reviewed by: Jan Lenaerts and Christoph Mayer
Adhikary, S., Seko, K., Nakawo, M., Ageta, Y., and Miyazaki, N.: Effect of surface dust on snow melt, Bull. Glacier Res., 15, 85–92, 1997. a
Brock, B., Rivera, A., Casassa, G., Bown, F., and Acuña, C.: The surface energy balance of an active ice-covered volcano: Villarrica Volcano, Southern Chile, Ann. Glaciol., 45, 104–114, https://doi.org/10.3189/172756407782282372, 2007. a
Collier, E., Maussion, F., Nicholson, L. I., Mölg, T., Immerzeel, W. W., and Bush, A. B. G.: Impact of debris cover on glacier ablation and atmosphere-glacier feedbacks in the Karakoram, The Cryosphere, 9, 1617-1632, https://doi.org/10.5194/tc-9-1617-2015, 2015. a
Dragosics, M., Meinander, O., Jónsdóttir, T., Dürig, T., De Leeuw, G., Pálsson, F., Dagsson-Waldhauserová, P., and Thorsteinsson, T.: Insulation effects of Icelandic dust and volcanic ash on snow and ice, Arab. J. Geosci., 9, 126, https://doi.org/10.1007/s12517-015-2224-6, 2016. a, b, c
Evatt, G. W., Abrahams, D., Heil, M., Mayer, C., Kingslake, J., Mitchell, S. L., Fowler, A. C., and Clark, C. D.: Glacial melt under a porous debris layer, J. Glaciol., 61, 825–836, https://doi.org/10.3189/2015JoG14J235, 2015. a
Juen, M., Mayer, C., Lambrecht, A., Wirbel, A., and Kueppers, U.: Thermal properties of a supraglacial debris layer with respect to lithology and grain size, Geogr. Ann. A, 95, 197–209, https://doi.org/10.1111/geoa.12011, 2013. a, b
Juen, M., Mayer, C., Lambrecht, A., Han, H., and Liu, S.: Impact of varying debris cover thickness on ablation: a case study for Koxkar Glacier in the Tien Shan, The Cryosphere, 8, 377–386, https://doi.org/10.5194/tc-8-377-2014, 2014. a
Kirkbride, M. P. and Dugmore, A. J.: Glaciological response to distal tephra fallout from the 1947 eruption of Hekla, south Iceland, J. Glaciol., 49, 420–428, https://doi.org/10.3189/172756503781830575, 2003. a, b
Mattson, L. E., Gardner, J. S., and Young, G. J.: Ablation on debris covered glaciers: an example from the Rakhiot Glacier, Punjab, Himalaya, IAHS Redbooks, 218, 289–296, 1993. a, b
Möller, R., Möller, M., Björnsson, H., Gudmundsson, S., Pálsson, F., Oddsson, B., Kukla, P. A., and Schneider, C.: MODIS-derived albedo changes of Vatnajökull (Iceland) due to tephra deposition from the 2004 Grimsvötn eruption, Int. J. Appl. Earth Obs. Geoinf., 26, 256–269, https://doi.org/10.1016/j.jag.2013.08.005, 2014. a
Möller, R., Möller, M., Kukla, P. A., and Schneider, C.: Impact of supraglacial deposits of tephra from Grimsvötn volcano, Iceland, on glacier ablation, J. Glaciol., 62, 933–943, https://doi.org/10.1017/jog.2016.82, 2016. a, b, c, d, e, f
Möller, R., Möller, M., Kukla, P. A., and Schneider, C.: Meteorological observations and ablation characteristics during the TIOGA experiment on Iceland in 2015, PANGAEA, https://doi.org/10.1594/PANGAEA.876656, 2017. a
Nicholson, L. and Benn, D. I.: Properties of natural supraglacial debris in relation to modelling sub-debris ice ablation, Earth Surf. Proc. Land., 38, 490–501, https://doi.org/10.1002/esp.3299, 2013. a
Nield, J. M., Chiverrell, R. C., Darby, S. E., Leyland, J., Vircavs, L. H., and Jacobs, B.: Complex spatial feedbacks of tephra redistribution, ice melt and surface roughness modulate ablation on tephra covered glaciers, Earth Surf. Proc. Landf., 38, 95–102, https://doi.org/10.1002/esp.3352, 2013. a
Østrem, G.: Ice melting under a thin layer of moraine, and the existence of ice cores in moraine ridges, Geogr. Ann., 41, 228–230, 1959. a
Pratap, B., Dobhal, D. P., Mehta, M., and Bhambri, R.: Influence of debris cover and altitude on glacier surface melting: a case study on Dokriani Glacier, central Himalaya, India, Ann. Glaciol., 56, 9–16, https://doi.org/10.3189/2015AoG70A971, 2015. a
Rounce, D. R., Quincey, D. J., and McKinney, D. C.: Debris-covered glacier energy balance model for Imja-Lhotse Shar Glacier in the Everest region of Nepal, The Cryosphere, 9, 2295–2310, https://doi.org/10.5194/tc-9-2295-2015, 2015. a
Sugiura, K., Ohata, T., and Yang, D.: Catch characteristics of precipitation gauges in high-latitude regions with high winds, J. Hydrometeorol., 7, 984–994, https://doi.org/10.1175/JHM542.1, 2006. a