the Creative Commons Attribution 4.0 License.
the Creative Commons Attribution 4.0 License.
 | 26 Jul 2019
Time series of the Inland Surface Water Dataset in China (ISWDC) for 2000–2016 derived from MODIS archives
Jin Ma
Xiaoqi Ma
Hailong Tang
Hongli Zhao
Muhammad Hasan Ali Baig
The moderate spatial resolution and high temporal resolution of MODIS imagery make it an ideal resource for time series surface water monitoring and mapping. We used MODIS MOD09Q1 surface reflectance archive images to create an Inland Surface Water Dataset in China (ISWDC), which maps water bodies larger than 0.0625 km2 within the land mass of China for the period 2000–2016, with 8 d temporal and 250 m spatial resolution. We assessed the accuracy of the ISWDC by comparing it with the national land cover derived surface water data and global surface water (GSW) data. The results show that the ISWDC is closely correlated with the national reference data with coefficient of determination (R2) greater than 0.99 in 2000, 2005, and 2010, while the ISWDC possesses very good consistency, very similar change dynamics, and similar spatial patterns in different regions with the GSW dataset. The ISWDC dataset can be used for studies on the inter-annual and seasonal variation of the surface water systems. It can also be used as reference data for verification of the other surface water dataset and as an input parameter for regional and global hydro-climatic models. The ISWDC data are available at: https://doi.org/10.5281/zenodo.2616035.


Surface water is the most important source of water from planetary water resources available for the survival of both human and ecological systems (Lu and He, 2006). It is a key component of the hydrological cycle and the key factor affecting the sustainable development of human society and ecosystem. Both climate change and human activities have a role in affecting the surface water availability at a given area and time. In order to locate the position and examine the change in dynamics of the inland surface water, regional and global datasets have already been produced through remotely sensed data by various researchers (Carroll et al., 2009; Verpoorter et al., 2014; Feng et al., 2015; Klein et al., 2014; Tulbure et al., 2016), but these contemporary studies were limited to measuring long-term changes at high spatial and temporal resolution. Pekel et al. (2016) quantified the changes in global surface water (GSW) over the past 32 years (1984–2015) at 30 m resolution by using the Landsat imagery. Klein et al. (2017) generated a 250 m daily global dataset of inland water bodies based on a combination of MODIS Terra and Aqua daily classifications. However, the temporal resolution of the former research is near monthly, and the latter research only produced datasets from 2013 to 2015 until now, while the entire MODIS archive back to July 2002 is still ongoing (Klein et al., 2017).
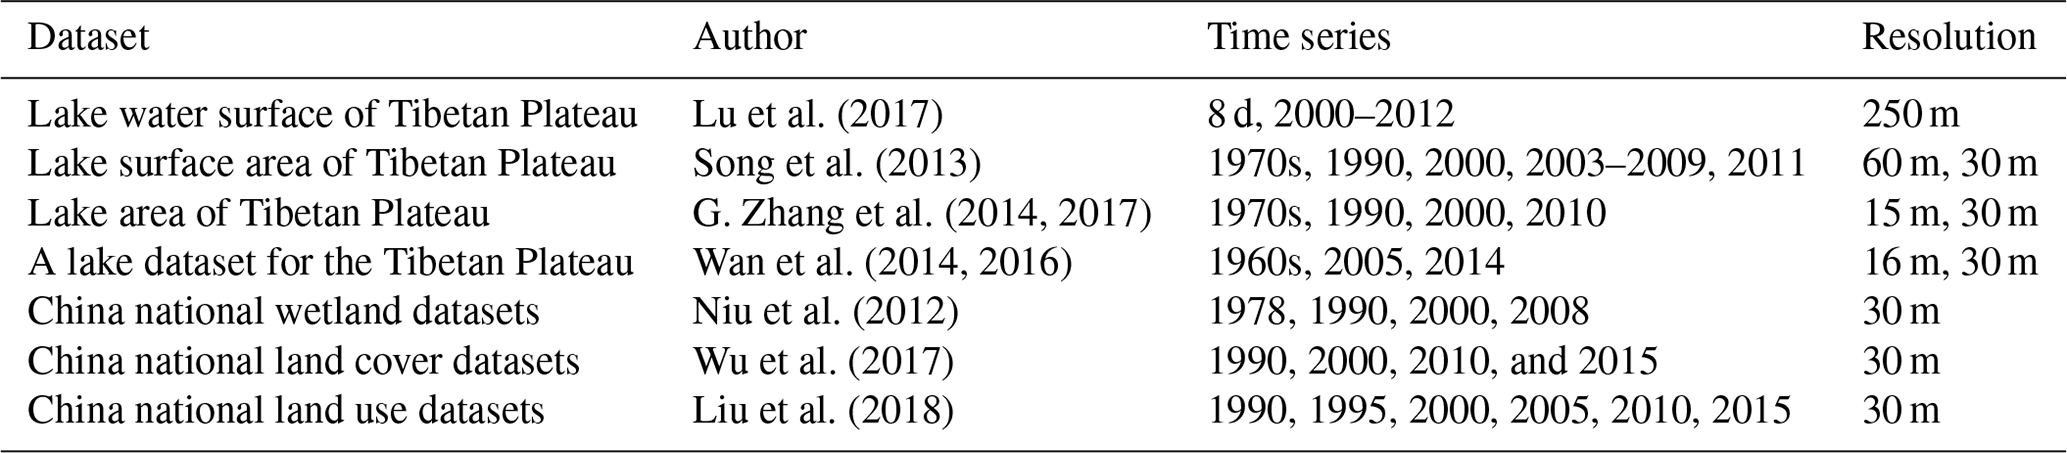
In China numerous regional case studies have been done and produced some surface water datasets but only in bits and pieces (Du et al., 2012; Lai et al., 2013; Luo et al., 2017). Their research mainly focused on lakes in the Tibetan Plateau (Lu et al., 2017). Several research groups are focusing on lake water changes of this region and have produced decadal lake surface water datasets since the 1960s (Song et al., 2014; G. Zhang et al., 2014, 2017; Wan et al., 2014, 2016). At the national scale, the national wetland remote sensing datasets in 1978, 1990, 2000 and 2008 (Niu et al., 2012), the national land cover datasets in 1990, 2000, 2010, and 2015 (Wu et al., 2017), and the national land use datasets in 1990, 1995, 2000, 2005, 2010, and 2015 (Liu et al., 2018) contain the inter-decadal or 5-year time-scale water surface dataset (Table 1). However, these datasets are available with limited temporal resolution and are not freely and fully shared.
Table 1National and regional surface-water-related datasets of China.
The most commonly used method of water extraction is based on water indices, such as the normalized difference water index (NDWI) (Gao, 1996; McFeeters, 1996; Rogers and Kearney, 2004), the modified normalized difference water index (MNDWI) (Xu, 2006), the automated water extraction index (AWEI) (Feyisa et al., 2014), and the enhanced water index (EWI) (Wang et al., 2015). Furthermore, the single band threshold segmentation method (Li et al., 2012; Lu et al., 2017) and the multiband transformation method (Pekel et al., 2014) are also in practice. The key step for using these methods in extracting the water boundary is to determine the threshold value for segmentation. The existing threshold determination methods include human visual judgment (Huang et al., 2008; Li et al., 2012) and sample statistical analysis (Feyisa et al., 2014; Pekel et al., 2014, 2016). The former relies on subjective experience, which causes the extraction results to be unstable and thus difficult to apply on larger scales and to large volumes of data. Although the latter can get more accurate results through extensive sampling statistics, the use of a unified threshold for the whole image or whole region may produce large errors in the local area. To overcome these problems, various comprehensive classification methods are widely used. Verpoorter et al. (2014) combined the principal component analysis (PCA) and the modified brightness index (MBI) to generate supervised classes and to divide these into water and non-water regions by using the decision tree method. Pekel et al. (2016) proposed an expert system by synthetic use of a visual analytical spectral library, the NDVI index, HSV transformation results, and the decision tree method. Khandelwal et al. (2017) introduced a global supervised classification based approach by defining initial spatial extents of each water body, using the global sample datasets, and incorporating all the spectral reflectance bands of the MODIS imagery. Use of supervised classification or the decision tree method may improve the accuracy of the water surface boundary extraction; however they can increase the difficulty and efficiency of the method at the same time. T. Zhang et al. (2017) proposed an automatic threshold determination method based on the LBV (L, the general radiance level; B, the visible–infrared radiation balance; V, the radiance variation vector between bands) transformation of Landsat 8 OLI surface reflectance images. It was verified as an accurate, simple and robust method for surface water extraction. However, cloud pixels and atmospheric correction influences were not considered.
China has one of the highest densities of rivers and lakes in the world. There are more than 1500 rivers with an area exceeding 1000 km2 and 2928 lakes with an area larger than 1 km2 which form a total surface water area of 91 020 km2 (Ma et al., 2011). However, owing to the influence of climate, geography, and landscape of the country, these surface water resources are unevenly distributed. They are found more in the south than in the north, and more in the east than in the west. With the development of the economy, the increase in the demand for industrial, agricultural and domestic water has placed great pressure on these surface water systems, especially during the irrigation and drought season (Gong et al., 2011; Barnett et al., 2015). Therefore, there is an urgent need for spatio-temporal continuous surface water datasets to support the efficient and robust management of water resources and to investigate the relationship between the national surface water and the global climate and human activities. However, until now, full publicly available data products with moderate spatial resolution and near-daily temporal resolution are still lacking in China.
In order to address these limitations and to fulfill the need to develop a comprehensive spatio-temporal dataset, this paper presents the Inland Surface Water Dataset in China (ISWDC) during the period of 2000–2016 (and will be updated continuously for the subsequent years on the Zenodo platform), which is derived from the 8 d and 250 m spatial resolution MODIS MOD09Q1 product. After recalling the methodology used in surface water mapping from the MODIS MOD09Q1 as described by Lu et al. (2017), the precision and accuracy of the dataset are reported, including the cross comparison with the existing national and global datasets.
The inland water of this dataset refers to a water body larger than 0.0625 km2 of the terrestrial land of China. The MODIS MOD09Q1 imagery was used to extract surface water (https://ladsweb.modaps.eosdis.nasa.gov/search/, last access: 14 May 2018). MOD09Q1 is a MODIS level 3 land surface reflectance product. It is an 8 d synthetic imagery of Band 1 (red band) and Band 2 (near-infrared band) with a spatial resolution of 250 m. In this study the near-infrared band is directly used to extract the surface water. There are 22 scenes covering the whole territory of China for every single date in a form of a mosaic. For the complete temporal coverage from 24 February 2000 to 26 December 2016, a total of 16 698 images were used. The SRTM (Shuttle Radar Topography Mission) DEM (Digital Elevation Model) data with 90 m spatial resolution are used as an ancillary data for surface water extraction, which is jointly operated by NASA's JPL (NASA's Jet Propulsion Laboratory) and NIMA (National Imagery and Mapping Agency (Slater et al., 2006).
Two types of reference dataset are used for cross comparison. The first is a derived sub-dataset of surface water from the China national 30 m land cover dataset from 2000, 2005 and 2010 (Liu et al., 2014; Wu et al., 2017). The second is the global surface water (GSW) at 30 m resolution from 2000 to 2015 produced by Pekel et al. (2016).
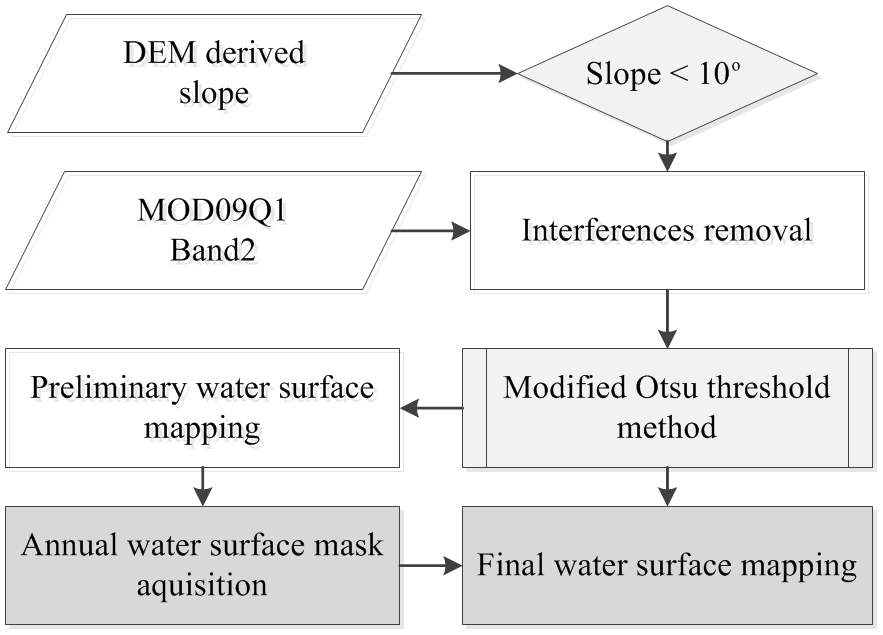
The threshold segmentation method proposed by Lu et al. (2017), which employs single bands with one-by-one segmentation of water bodies, is used to extract the surface water boundary, which includes four steps: interferences removal, preliminary water surface mapping, annual water surface mask acquisition, and water surface boundary extraction (Fig. 1). In this study the last two steps of the method are updated and improved as shown in Sect. 3.1 and 3.2.
3.1 Annual water surface mask acquisition
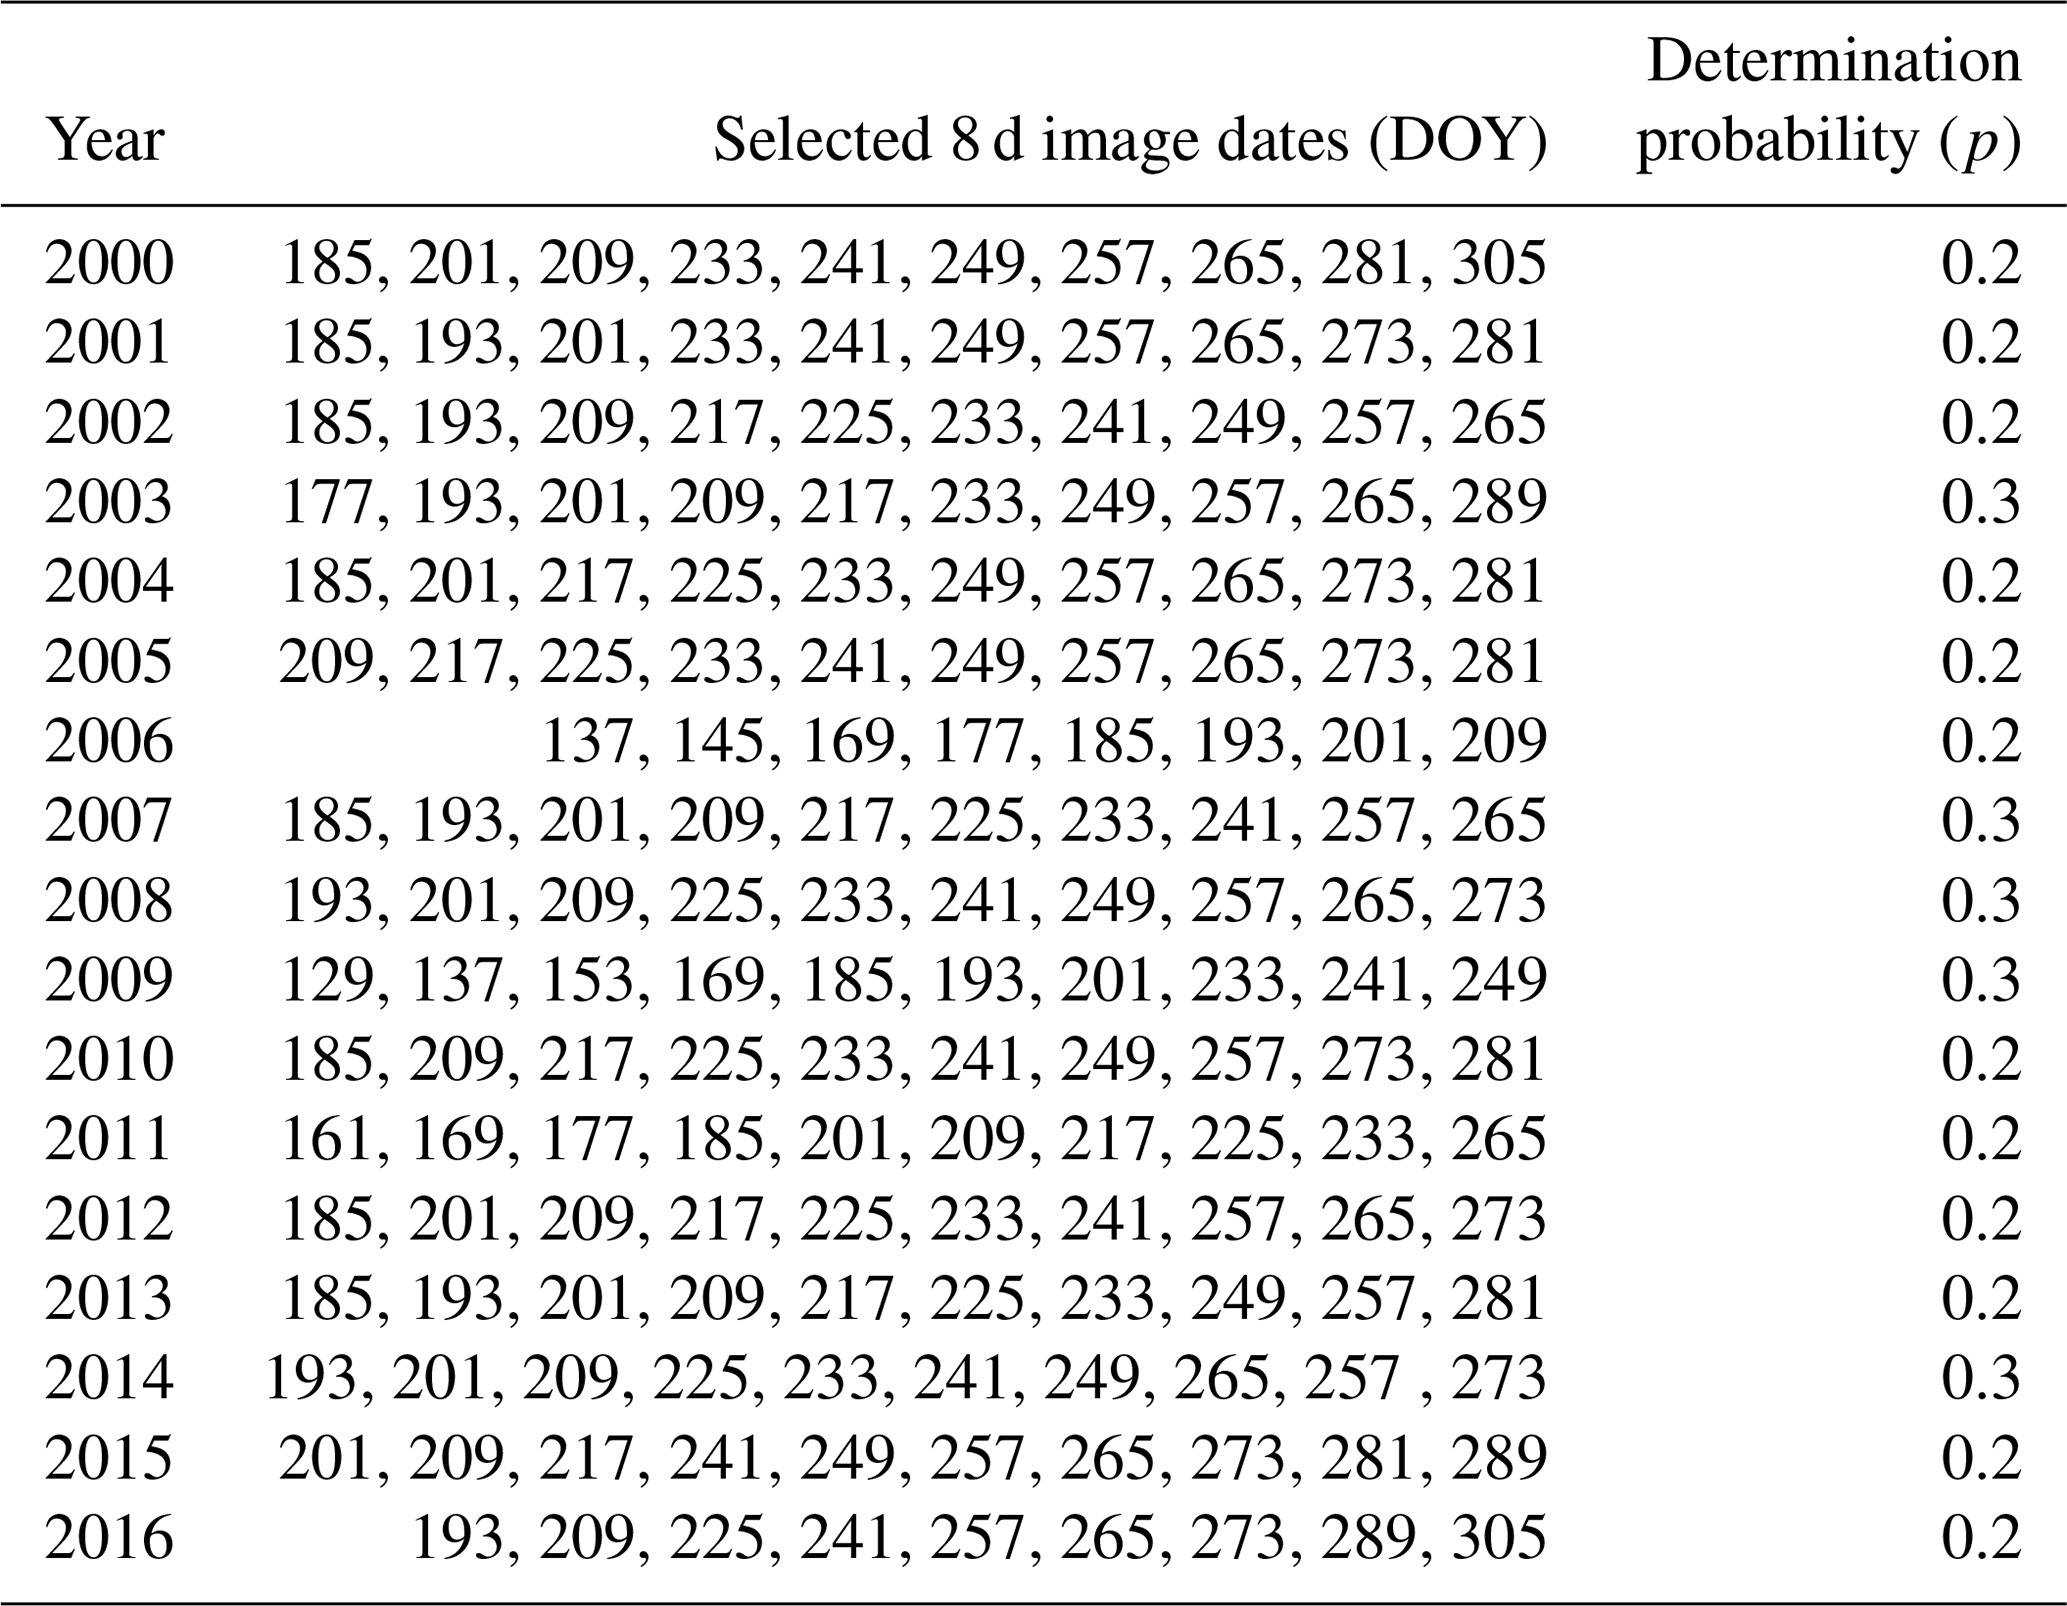
The water surface mask is a key input data for excluding land disturbance factors that affect the extraction of the water surface boundary. It is generated from the preliminary water surface mapping results based on the modified Otsu threshold method applied on the selected images having less cloud cover and better quality in each year (Lu et al., 2017). In order to eliminate error in water area information caused by the cloud and cloud shadow in this process, the determination probability (p) parameter is used based on the fact that the cloud and its shadow will not appear in the same position for several days. The equation is as follows:
where n is the number of the preliminary water surface mapping images, di is the pixel value of image i, D is the pixel value of the annual water surface mask, and p is the determination probability for identifying water pixels. In this study the reference images from 2013 to 2016 were selected and the determination probability (p) was determined based on the same rule as within Lu et al. (2017). Furthermore, the annual reference images and determination probability (p) of 2000–2012 are directly used here because they were originally obtained based on the whole images of China (Table 2).
Table 2The images used for annual water surface mask generation and the determination probability each year.
3.2 Final water surface mapping
Before determining the threshold value for each water body in the final step of the water surface extraction method (Lu et al., 2017), the average pixel value in the mask area is used to eliminate the influence of the land pixels. Although this way can improve the accuracy of water surface extraction, the average pixel value in different seasons will also be different. In order to optimize this process, 423 samples from lakes and rivers in different regions of the country are selected (Fig. 2) to obtain a reference average pixel value in different seasons. Two images with the least clouds cover are selected for each season in each year, and the average pixel values for spring, summer, and autumn are calculated based on the water body samples. They were used as the upper-limit threshold for determining the pixel value range for the final step of water surface mapping. In the process of water turning into ice in winter, the pixel value of ice is higher than that of water, and it accounts for a large proportion. The average pixel value will cause the ice layer to be extracted as the water surface; the minimum pixel value of the samples is used as the upper-limit threshold for water surface mapping in winter. Finally, based on the upper-limit thresholds in different seasons each year, the final binary water surface images of different time periods are obtained by using the modified Otsu threshold method again (Lu et al., 2017).
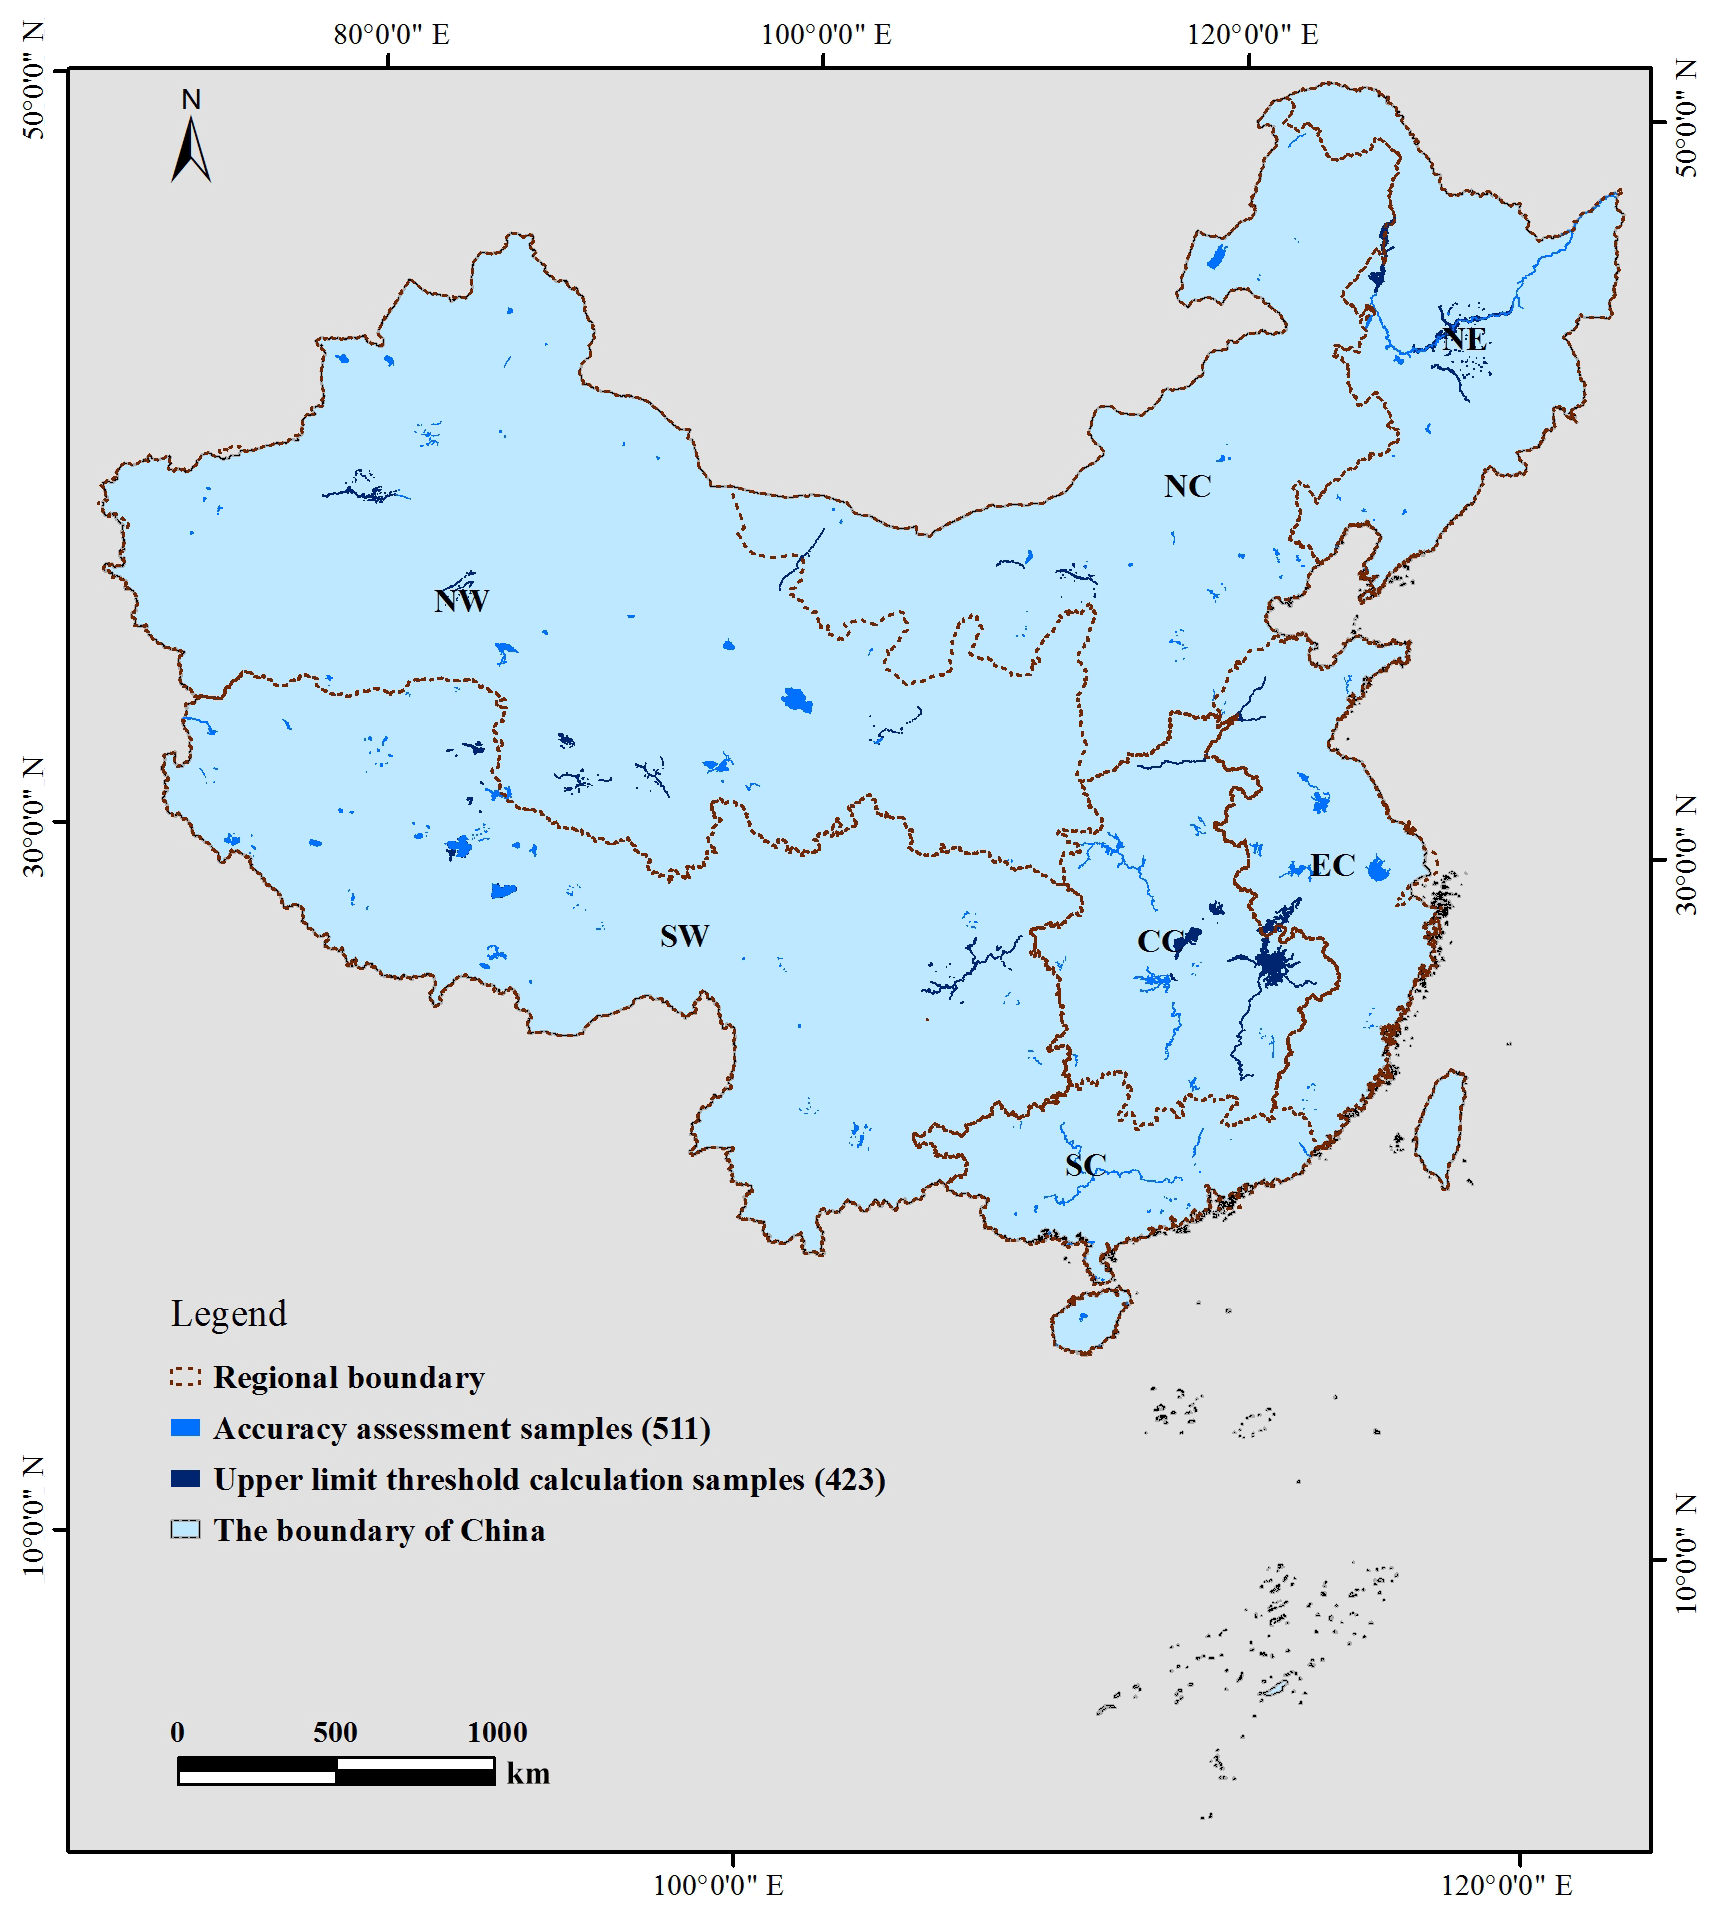
Figure 2The boundary of China, the accuracy assessment and the upper-limit threshold calculation samples for surface water extraction. NW: Northwest China, SW: Southwest China, SC: South China, CC: Central China; NC: North China, NE: Northeast China, EC: East China.
4.1 Comparison with the national land cover dataset
Based on the 30 m resolution national land cover dataset of 2000, 2005, and 2010, 511 samples from lakes and rivers spreading out across the country are selected as ground truth data (Fig. 2). This includes 11 very large water bodies with areas larger than 1000 km2, 12 large water bodies with areas larger than 500 km2 and less than 1000 km2, 29 medium-sized water bodies with area larger than 100 km2 and less than 500 km2, and 459 smaller water bodies with areas less than 100 km2. They were compared with the maximum ISWDC in the corresponding years.
The results show that the ISWDC is highly consistent with the reference land-cover-derived surface water data. The coefficients of determination (R2) in 2000, 2005, and 2010 are found to be 0.9974, 0.992, and 0.9932, respectively, as shown in Fig. 3. The confusion matrix analysis results show that the average user accuracy is 91.13 %, the average producer accuracy is 88.95 %, and the average kappa coefficient is 0.88 in 3 years (Table 3).
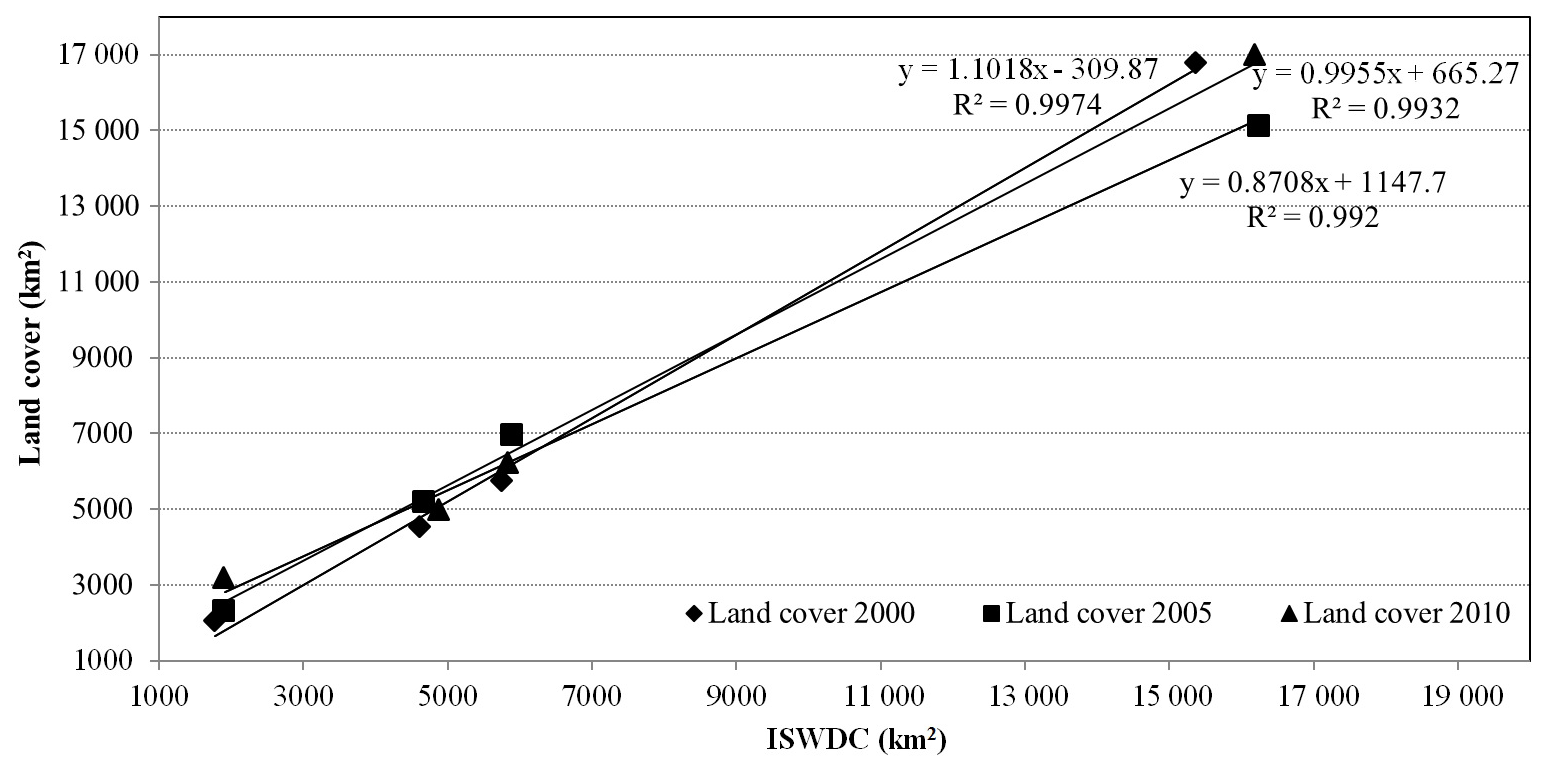
Figure 3Comparison of the total areas of surface water body samples with different size (<100, 100–500, 500–1000, >1000 km2) between ISWDC and the national land-cover-derived surface water data.
Table 3Accuracy analysis samples in different regions and the accuracy evaluation results.

As the national land cover data in 2000, 2005, and 2010 are based on 30 m Landsat images that were mainly obtained in the summer season, the water surface in these datasets can be equated with annual maximum water surface results. So we compared them with our maximum ISWDC from the corresponding years. The calculated R2 is based on the area of different size of water bodies. The larger the R2, the better the consistency and the smaller the area error between the two datasets. Furthermore, the results of the confusion matrix are equivalent to pixel scale analysis although it is not as intuitive as visual contrast.
4.2 Assessment against the global surface water dataset
The time series of annual ISWDC and GSW permanent water bodies of the whole of China with an area larger than 0.0625 km2 from 2000 to 2015 were also compared. The results show that the two datasets possess very good consistency (R2=0.6532) (Fig. 4a) and very similar change dynamics (Fig. 4b). The annual ISWDC and GSW permanent water bodies in 2015 also indicate similar spatial patterns in different regions (Fig. 5). For the lake groups in the central Tibetan Plateau, the comparison between ISWDC obtained from MODIS and Landsat-derived GSW indicated a closer pattern between the two results (Fig. 5a). For the rivers and lakes interlaced with the Poyang Lake region, in addition to the narrow width of the river and some small water bodies, the coincidence between the two datasets is also very high (Fig. 5b). The over-extracted water (red regions in Fig. 5) on the margins for large water bodies like Siling Co, Nam Co, Poyang Lake, and some of the wide rivers, and the under-extracted slender rivers and small water bodies (green regions in Fig. 5), for the ISWDC dataset, are mainly caused by the mixed pixel effects due to relatively coarse spatial resolution of the MODIS images.
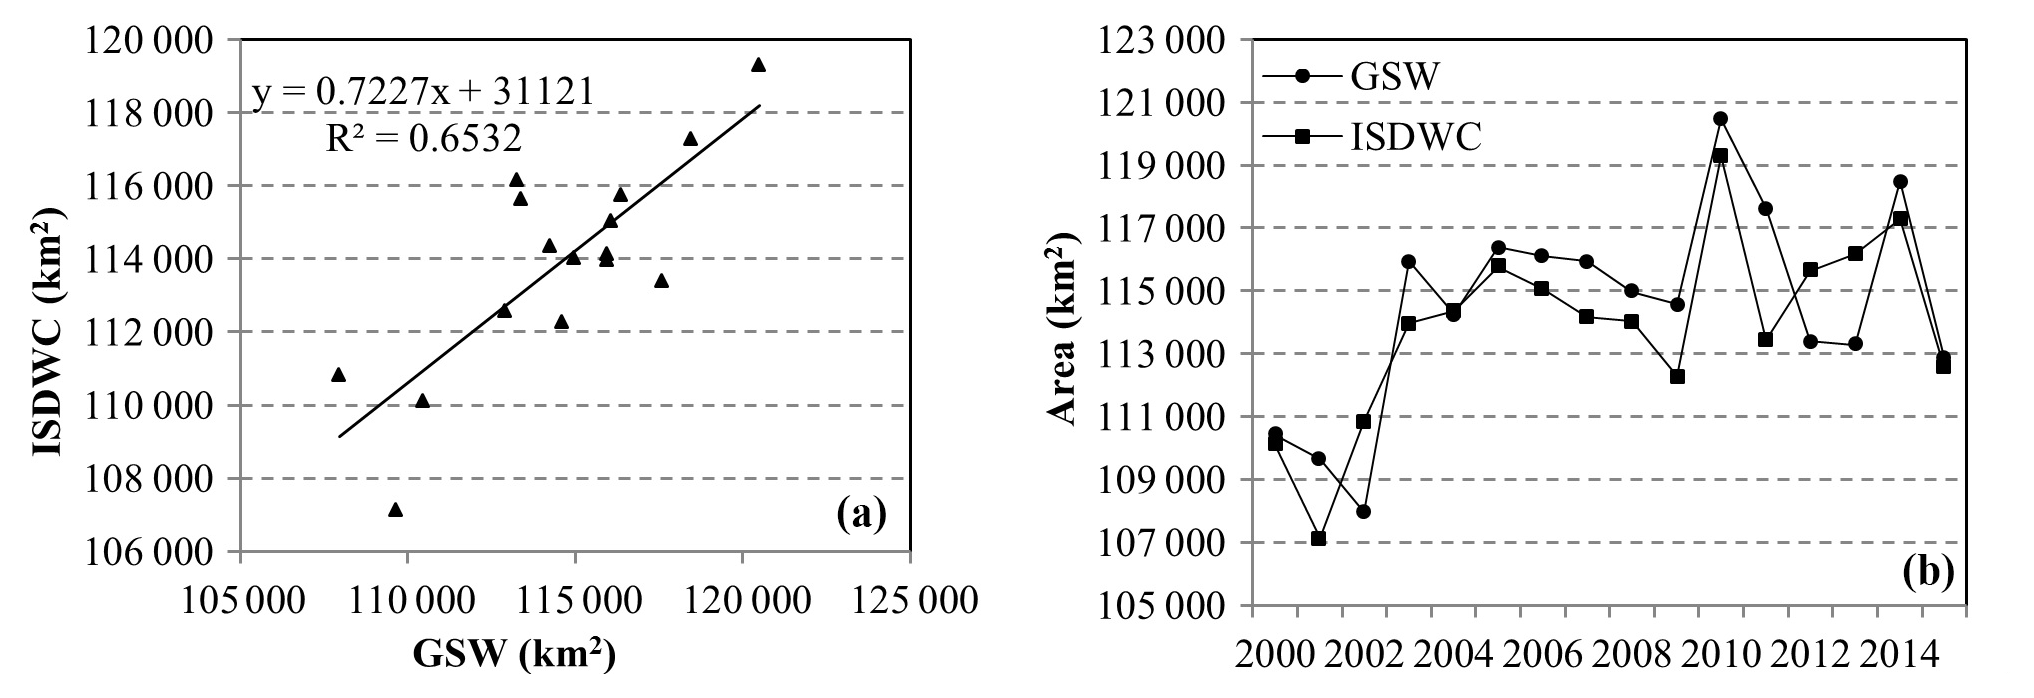
Figure 4Comparison of the time series annual ISWDC and GSW permanent water bodies of the whole of China from 2000 to 2015. (a) is the correlation analysis result, and (b) is the change trend comparison result.

Figure 5Comparison of permanent water bodies derived from ISWDC and GSW over the sites of the central Tibetan Plateau (a) and Poyang Lake region (b).
Time series of the surface water dataset can be used to analyze the inter-annual and seasonal variation characteristics of surface water area, including the inter-annual variation trend, abrupt change time, intra-annual hydrological process monitoring, etc. (Huang et al., 2018; Xing et al., 2018). Similarly, it can also be used as cross-validation reference data for global surface water datasets with a similar spatial resolution (Klein et al., 2017) and as a key input parameter for regional and global hydro-climatic model calibration and evaluation (Khan et al., 2011; Stacke and Hagemann, 2012).
For example, based on the ISWDC from 2000 to 2016, the annual variation of surface water in China can be obtained by superimposing all the 8 d time series water surface area data of each year. Figure 6 shows that the surface water area began to increase in early March and increased gradually in spring and summer. After reaching its peak in autumn, it then began to decrease gradually. The annual variation of surface water area in different regions can also be portrayed by calculating the multi-year average of every 8 d data. Figure 7 shows that the surface water area of Southwest China (SW) and Northwest China (NW) is very large and inter-seasonally it varies greatly compared to the surface water area of other regions. The surface water area in Northeast China (NE) began to increase rapidly in spring. It reached a peak in May and decreased slightly in June–July. After reaching its maximum in August–September, it began to decline again in October. In North China (NC) surface water area is relatively small, but the change still shows some seasonality. There is a significant increase in summer and autumn, but the range of increase and decrease is relatively small. Surface water area in Central China (CC) and Eastern China (EC) varies steadily during the year. It reaches its maximum in summer and begins to decrease gradually in late summer and early autumn. Surface water area in South China (SC) was relatively stable throughout the year.

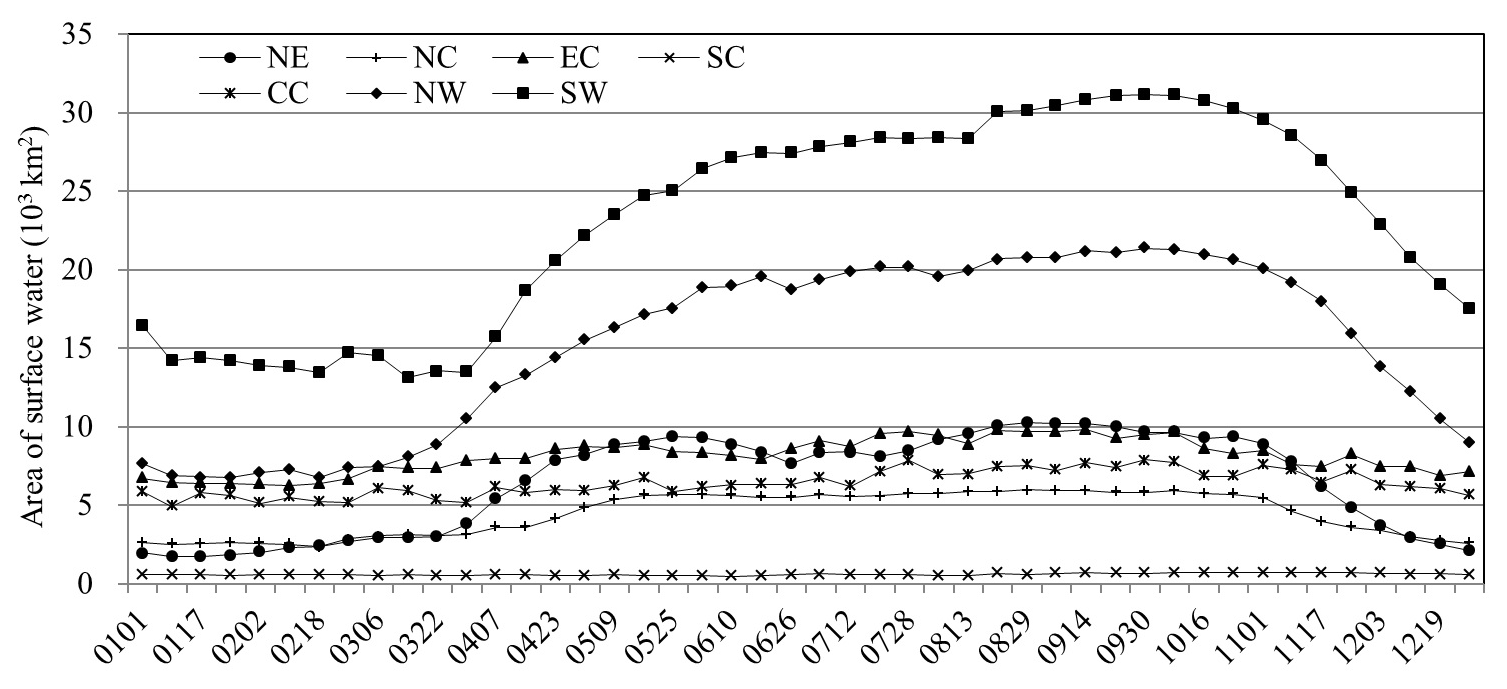
Figure 7The 8 d surface water area in different regions of China from 2000 to 2016. NE: Northeast China, NC: North China, EC: East China, SC: South China, CC: Central China, NW: Northwest China, SW: Southwest China.
Furthermore, the spatial distributions of surface water can clearly be depicted by means of multi-year average analysis. The results in Table 4 show that surface water of inland China is mainly distributed in western China, accounting for 49.13 % of the total surface water area, with 29.88 % in the Southwest China (SW) and 19.25 % in the Northwest China (NW), followed by the Central China (CC) and East China (EC), which accounted for 8.13 % and 24.78 % of the total surface water area, respectively. The North China (NC), Northeast China (NE) and South China (SC) account for the other 17.96 % of the national surface water area.
Table 4The average distribution of surface water area in inland China from 2000 to 2016.

The ISWDC dataset is distributed under a Creative Commons Attribution 4.0 License. The data may be downloaded from the data repository Zenodo at https://doi.org/10.5281/zenodo.2616035 (Lu et al., 2019). In each 8 d surface water image, the pixel values of 1 and 0 represent the water and the background respectively. The 8 d data in each month can be used to calculate the monthly water occurrence and all the 8 d data in each year can be used to calculate the yearly water occurrence, by summing up all the surface water images together in the corresponding time periods. The vector datasets of the 8 d surface water boundaries extracted from the raster data products can also be obtained through the same link.
In this study, the 8 d time series 250 m resolution surface water dataset of inland China (ISWDC) from 2000 to 2016 has been introduced. It is a publicly available data product with prominent features of long time series, moderate spatial resolution and high temporal resolution. The ISWDC is a valuable basic data source for the analysis of dynamic changes of surface water in China over the past 20 years.
The results have been validated based on the 2000, 2005 and 2010 national land-cover-derived surface water data and show high accuracy. The average user accuracy is 91.13 %, the average producer accuracy is 88.95 %, and the average kappa coefficient is 0.88 for these 3 years. Furthermore, a comparison with the GSW service underlines the reliability of temporal processes and spatial distribution. In terms of temporal variation, the ISWDC and the GSW possess excellent consistency and very similar change dynamics during the whole time period, which simply show that both datasets are highly correlated. For the spatial-distribution characteristics, the ISWDC in 2015 has similar spatial patterns in different regions to that of the GSW dataset, especially for larger water bodies such as lakes, water reservoirs, and wide rivers.
The advantage of the ISWDC dataset is its high level of revealing the spatio-temporal variability of inland surface water. Based on this dataset, the spatial-distribution characteristics and temporal-variation processes of surface water can be described through the multi-year average spatial statistics and annual data overlapping analysis. In addition, the dataset can also be used as a cross-validation reference data for other global surface water datasets and as a key input parameter for regional and global hydro-climatic models.
However influenced by the algorithm design and the data sources used, the results have certain limitations. First of all, as for other surface water datasets derived from multi-spectral sensors, the ISWDC only includes open water surfaces, while water bodies which are covered by vegetation are not captured. Secondly, as ISWDC only uses MODIS MOD09Q1 near-infrared band for water surface extraction, thus the accuracy of datasets depends mainly on the quality of the original 8 d synthetic images. When clouds exist in the water distribution region of the synthetic image at a certain time, the cloud-covered water surface will not be extracted and causes an underestimation for extracting water bodies. In addition, the reference images used to produce the annual water surface mask will also affect the accuracy of the final results. For example, if the selected image does not contain the information of the actual maximum water surface occurrence in that year, it may lead to the exclusion of that part of the water pixels which lies outside the mask. Finally, because of the small difference in reflectance between the ice–water mixing boundary in autumn and spring, the accuracy of water surface area extraction will be limited in these two seasons.
Although the water surface extraction method designed in this study is aimed at extracting water surface information from the MODIS MOD09Q1 images, its core process is the automatic thresholding for the estimation of water bodies one by one. Therefore, this method is also applicable to traditional water body indices, such as NDWI, MNDWI, and AWEI, or to other water surface information based on enhanced thematic data. In the future, while continuing to extend the existing datasets from 2017 to present by using this method, the 30 m GSW dataset in China will be extended. At the same time, the national 10 m spatial-resolution water surface dataset based on Sentinel-2 imagery will be produced. After the national-scale datasets are completed, the corresponding global-scale datasets are also expected.
SL supervised the downloading and processing of satellite images and designed the methodology. JM contributed to downloading, processing satellite images, and extracting the surface water data (ISWDC). XM extracted the reference surface water data from the national land cover datasets and analyzed the accuracy of the ISWDC. HT extracted the global surface water (GSW) from the Google Earth Engine platform. HL made contributions to the structure, design and revision of the paper. MHAB optimized the paper's structure, figures and English grammar. All authors have read and approved the final paper.
The authors declare that they have no conflict of interest.
We thank NASA for the use of EOSDIS and LAADS DAAC platforms (https://ladsweb.modaps.eosdis.nasa.gov/, last access: 8 July 2018) and NASA-JPL and NIMA for providing the MODIS and SRTM datasets. We also thank JRC and Google Earth Engine (https://earthengine.google.com, last access: 3 September 2018) for providing the global surface water (GSW) dataset.
This research has been supported by the National Key Research and Development Program of China (grant nos. 2017YFC0405802, 2016YFC0503507-03), the Key Program of the National Natural Science Foundation of China (grant no. 91637209), and the Strategic Priority Research Program of the Chinese Academy of Sciences (grant no. XDA19070201).
This paper was edited by Ge Peng and reviewed by three anonymous referees.
Barnett, J., Rogers, S., Webber, M., Finlayson, B., and Wang, M.: Transfer project cannot meet China's water needs, Nature, 527, 295–297, https://doi.org/10.1038/527295a, 2015.
Carroll, M. L., Townshend, J. R., DiMiceli, C. M., Noojipady, P., and Sohlberg, R. A.: A new global raster water mask at 250 m resolution, Int. J. Dig. Earth, 2, 291–308, https://doi.org/10.1080/17538940902951401, 2009.
Du, Z., Bin, L., Ling, F., Li, W., Tian, W., Wang, H., Gui, Y., Sun, B., and Zhang, X.: Estimating surface water area changes using time-series Landsat data in the Qingjiang River Basin, China, J. Appl. Remote Sens., 6, 3609, https://doi.org/10.1117/1.JRS.6.063609, 2012.
Feng, M., Sexton, J. O., Channan, S., and Townshend, J. R.: A global, high-resolution (30-m) inland water body dataset for 2000: first results of a topographic–spectral classification algorithm, Int. J. Dig. Earth, 9, 113–133, https://doi.org/10.1080/17538947.2015.1026420, 2015.
Feyisa, G. L., Meilby, H., Fensholt, R., and Proud, S. R.: Automated Water Extraction Index: A new technique for surface water mapping using Landsat imagery, Remote Sens. Environ., 140, 23–35, https://doi.org/10.1016/j.rse.2013.08.029, 2014.
Gao, B.: NDWI A Normalized Difference Water Index for Remote Sensing of Vegetation Liquid Water From Space, Remote Sens. Environ., 266, 257–266, https://doi.org/10.1016/S0034-4257(96)00067-3, 1996.
Gong, P., Yin, Y., and Yu, C.: China: Invest Wisely in Sustainable Water Use, Science, 331, 1264–1265, https://doi.org/10.1126/science.331.6022.1264-b, 2011.
Huang, C., Chen, Y., Zhang, S., and Wu, J.: Detecting, extracting, and monitoring surface water from space using optical sensors: A review, Rev. Geophys., 56, 333–360, https://doi.org/10.1029/2018RG000598, 2018.
Huang, H., Zhao, P., Chen, Z., and Guo, W.: Research on the method of extracting water body information from ASTER remote sensing image, Remote Sens. Technol. Appl., 23, 525–528, https://doi.org/10.11873/j.issn.1004-0323.2008.5.525, 2008.
Khan, S. I., Hong, Y., Wang, J., Yilmaz, K. K., Gourley, J. J., Adler, R. F., Brakenridge, G. R., Habib, S., and Irwin, D.: Satellite Remote Sensing and Hydrologic Modeling for Flood Inundation Mapping in Lake Victoria Basin: Implications for Hydrologic Prediction in Ungauged Basins, IEEE Trans. Geosci. Remote Sens., 49, 85–95, https://doi.org/10.1109/TGRS.2010.2057513, 2011.
Khandelwal, A., Karpatne, A., Marlier, M. E., Kim, J., Lettenmaier, D. P., and Kumar, V.: An approach for global monitoring of surface water extent variations in reservoirs using MODIS data, Remote Sens. Environ., 202, 113–128, https://doi.org/10.1016/j.rse.2017.05.039, 2017.
Klein, I., Dietz, A. J., Gessner, U., Galayeva, A., Myrzakhmetov, A., and Kuenzer, C.: Evaluation of seasonal water body extents in Central Asia over the past 27 years derived from medium-resolution remote sensing data, Int. J. Appl. Earth Observ. Geoinfo., 26, 335–349, https://doi.org/10.1016/j.jag.2013.08.004, 2014.
Klein, I., Gessner, U., Dietz, A. J., and Kuenzer, C.: Global WaterPack – A 250 m resolution dataset revealing the daily dynamics of global inland water bodies, Remote Sens. Environ., 198, 345–362, https://doi.org/10.1016/j.rse.2017.06.045, 2017.
Lai, Y., Qiu, Y., Fu, W., and Shi, L.: Monitoring and analysis of surface water in Kashgar region based on TM imagery in last 10 years, Remote Sens. Info., 28, 50–57, https://doi.org/10.3969/j.issn.1000-3177.2013.03.009, 2013.
Li, X., Xiao, J., Li, F., Xiao, R., Xu, W., and Wang, L.: Remote Sensing monitoring of the Qinghai Lake based on EOS /MODIS data in recent 10 years, J. Nat. Resour., 22, 1962–1970, https://doi.org/10.11849/zrzyxb.2012.11.015, 2012.
Liu, J., Kuang, W., Zhang, Z., Xu, X., Qin, Y., Ning, J., Zhou, W., Zhang, S., Li, R., Yan, C., Wu, S., Shi, X., Jiang, N., Yu, D., Pan, X., and Chi, W.: Spatiotemporal characteristics, patterns and causes of land use changes in China since the late 1980s, Acta Geograph. Sin., 69, 3–14, https://doi.org/10.1007/s11442-014-1082-6, 2014.
Liu, J., Jia, N., Kuang, W., Xu, X., Zhang, S., Yan, C., Li, R., Wu, S., Hu, Y., Du, G., Chi, W., Pan, T., and Ning, J.: Spatio-temporal patterns and characteristics of land-use change in China during 2010–2015, Acta Geograph. Sin., 73, 789–802, http://www.geog.com.cn/CN/10.11821/dlxb201805001 (last access: 5 July 2019), 2018.
Lu, G. and He, H.: View of global hydrological cycle, Adv. Water Sci., 17, 419–424, 2006.
Lu, S., Ma, J., Ma, X., Tang, H., Zhao, H., and Ali Bai Hasan, M.: Time series of Inland Surface Water Dataset in China (ISWDC) [Dataset], Zenodo, https://doi.org/10.5281/zenodo.2616035, 2019.
Lu, S., Jia, L., Zhang, L., Wei, Y., Baig, M., Zhai, Z., Ment, J., Li, X., and Zhang, G.: Lake water surface mapping in the Tibetan Plateau using the MODIS MOD09Q1 product, Remote Sens. Lett., 8, 224–233, https://doi.org/10.1080/2150704X.2016.1260178, 2017.
Luo, C., Xu, C., Cao, Y., and Tong, L.: Monitoring of water surface area in Lake Qinghai from 1974 to 2016, J. Lake Sci., 29, 1245–1253, https://doi.org/10.18307/2017.0523, 2017.
Ma, R., Yang, G., Duan, H., Jiang, J., Wang, S., Feng, X., Li, A., Kong, F., Xue, B., Wu, J., and Li, S.: China's lakes at present: Number, area and spatial distribution, Sci. China Earth Sci., 41, 394–401, https://doi.org/10.1007/s11430-010-4052-6, 2011.
McFeeters, S. K.: The use of the Normalized Difference Water Index (NDWI) in the delineation of open water features, Int. J. Remote Sens., 17, 1425–1432, https://doi.org/10.1080/01431169608948714, 1996.
Niu, Z., Zhang, H., Wang, X., Yao, W., Zhou, D., Zhao, K., Zhao, H., Li, N., Huang, H., Li, C., Yang, J., Liu, C., Liu, S., Wang, L., Li, Z., Yang, Z., Qiao, F., Zheng, Y., Chen, Y., Sheng, Y., Gao, X., Zhu, W., Wang, W., Wang, H., Weng, Y., Zhuang, D., Liu, J., Luo, Z., Cheng, X., Guo, Z., and Gong, P.: Mapping Wetland Changes in China between 1978 and 2008, Chinese Sci. Bull., 57, 1400–1411, https://doi.org/10.1007/s11434-012-5093-3, 2012.
Pekel, J., Vancutsem, C., Bastin, L., Clerici, M., Vanbogaert, E., Bartholome, E., and Defourny, P.: A near real-time water surface detection method based on HSV transformation of MODIS multi-spectral time series data, Remote Sens. Environ., 140, 704–716, https://doi.org/10.1016/j.rse.2013.10.008, 2014.
Pekel, J. F., Cottam, A., Gorelick, N., and Belward, A. S.: High-resolution mapping of global surface water and its long-term changes, Nature, 540, 418–422, https://doi.org/10.1038/nature20584, 2016.
Rogers, A. S. and Kearney, M. S.: Reducing signature variability in unmixing coastal marsh Thematic Mapper scenes using spectral indices, Int. J. Remote Sens., 20, 2317–2335, https://doi.org/10.1080/01431160310001618103, 2004.
Slater, J. A.: The SRTM Data Finishing Process and Products, Photogramm. Eng. Remote Sens., 72, 237–247, https://doi.org/10.14358/PERS.72.3.237, 2015.
Song, C., Huang, B., Ke, L., and Richards, K. S.: Remote sensing of alpine lake water environment changes on the Tibetan Plateau and surroundings: A review, ISPRS J. Photogramm. Remote Sens., 92, 26–37, https://doi.org/10.1016/j.isprsjprs.2014.03.001, 2014.
Stacke, T. and Hagemann, S.: Development and evaluation of a global dynamical wetlands extent scheme, Hydrol. Earth Syst. Sci., 16, 2915–2933, https://doi.org/10.5194/hess-16-2915-2012, 2012.
Tulbure, M. G., Broich, M., Stehman, S. V., and Kommareddy, A.: Surface water extent dynamics from three decades of seasonally continuous Landsat time series at subcontinental scale in a semi-arid region, Remote Sens. Environ., 178, 142–157, https://doi.org/10.1016/j.rse.2016.02.034, 2016.
Verpoorter, C., Kutser, T., Seekell, D. A., and Tranvik, L. J.: A global inventory of lakes based on high-resolution satellite imagery, Geophys. Res. Lett., 41, 6396–6402, https://doi.org/10.1002/2014GL060641, 2014.
Wan, W., Xiao, P., Feng, X., Li, H., Ma, R., Duan, H., and Zhao, L.: Monitoring lake changes of Qinghai-Tibetan Plateau over the past 30 years using satellite remote sensing data, Chinese Sci. Bull., 59, 1021–1035, https://doi.org/10.1007/s11434-014-0128-6, 2014.
Wan, W., Long, D., Hong, Y., Ma, Y., Yuan, Y., Xiao, P., Duan, H., Han, Z., and Gu, X.: A lake dataset for the Tibetan Plateau from the 1960s, 2005, and 2014, Sci. Data, 3, 160039, https://doi.org/10.1038/sdata.2016.39, 2016.
Wang, S., Baig, M. H. A., Zhang, L., Jiang, H., Ji, Y., Zhao, H., and Tian, J.: A Simple Enhanced Water Index (EWI) for Percent Surface Water Estimation Using Landsat Data, Selected Topics in Applied Earth Observations and Remote Sensing, IEEE J., 8, 90–97, https://doi.org/10.1109/JSTARS.2014.2387196, 2015.
Wu, B., Bao, A., Chen, J., Huang, J., Li, A., Liu, C., Ma, R., Wang, Z., Yan, C., Yu, X., Zeng, Y., and Zhang L.: Land cover in China, Beijing: Science Press, 2017 (in Chinese).
Xing, L., Tang, X., Wang, H., Fan, W., and Wang, G.: Monitoring monthly surface water dynamics of Dongting Lake using Sentinel-1 data at 10 m, Peer J., 6, e4992, https://doi.org/10.7717/peerj.4992, 2018.
Xu, H. Q.: Modification of normalized difference water index (NDWI) to enhance open water features in remotely sensed imagery, Int. J. Remote Sens., 27, 3025–3033, https://doi.org/10.1080/01431160600589179, 2006.
Zhang, G., Yao T., Xie, H., Zhang, K., and Zhu, F.: Lakes' State and Abundance across the Tibetan Plateau, Chinese Sci. Bull., 59, 3010–3021, https://doi.org/10.1007/s11434-014-0258-x, 2014.
Zhang, G., Li, J., and Zheng, G.: Lake-area mapping in the Tibetan Plateau: an evaluation of data and methods, Int. J. Remote Sens., 38, 742–772, https://doi.org/10.1080/01431161.2016.1271478, 2017.
Zhang, T., Ren, H., Qin, Q., Zhang, C., and Sun, Y.: Surface Water Extraction From Landsat 8 OLI Imagery Using the LBV Transformation, IEEE J. Select. Top. Appl. Earth Observ. Remote Sens., 10, 4417–4429, https://doi.org/10.1109/JSTARS.2017.2719029, 2017.