the Creative Commons Attribution 4.0 License.
the Creative Commons Attribution 4.0 License.
 | 09 Sep 2019
Fifty years of recorded hillslope runoff on seasonally frozen ground: the Swift Current, Saskatchewan, Canada, dataset
Anna E. Coles
Jeffrey J. McDonnell
Brian G. McConkey
Long records of hillslope runoff and nutrient concentrations are rare – on seasonally frozen ground they are almost non-existent. The Swift Current hillslopes at the Swift Current Research and Development Centre on the Canadian Prairies provide such a long-term hydrological record. Runoff, runoff nutrient concentration, snowpack depth, density and water equivalent, soil moisture, and soil nutrient concentration were monitored on the three 5 ha hillslopes over a 50-year period (1962–2011). Digital elevation data are available for the three hillslopes at a 2 m horizontal resolution, and, for one of the hillslopes (Hillslope 2), at a 0.25 m horizontal resolution. Runoff from the hillslopes was generated episodically during snowmelt and occasional rainfall events. Hillslope runoff was measured with a 0.61 m H-flume. Daily runoff nutrient concentration data are available for nitrate–N (March 1971–April 2011), ammoniacal–N (February 1996–April 2011), and phosphate-P (March–April 1971; June 1991–April 2011). Snowpack data (snowpack depth, density, and water equivalent) were determined via manual snow surveys carried out several times each winter, between January and March, between 1965 and 2011. Gravimetric soil moisture content was measured in October and April each year between 1971 and 2011 at five depth intervals (0–15, 15–30, 30–60, 60–90, and 90–120 cm) at nine points on each hillslope. We provide these hillslope data in two publicly available repositories: (1) 1962–2011 data on runoff, runoff nutrients, snowpack, soil moisture, soil nutrients, and crop and tillage practices at https://doi.org/10.23684/hhn5-rz52 (McConkey and Thiagarajan, 2018); and (2) digital elevation data at https://doi.org/10.20383/101.0117 (Coles et al., 2018). Complete climate data recorded at a Environment and Climate Change Canada meteorological station located 390 m from the three hillslopes are publicly available at http://climate.weather.gc.ca/ (last access: 30 August 2019).


Long-term datasets that chronicle hydrological processes within the context of climate and land management change are rare. This is especially true for cold regions with seasonally frozen ground and where remoteness and inclement weather limit continuous measurements. Long-term experimental datasets that do exist in such regions are diminishing quickly (Laudon et al., 2017). For hillslope-scale long-term experiments over seasonally frozen ground, such records are particularly uncommon. Here we present an unusually long 50-year record for a set of three monitored agricultural hillslopes in southwestern Saskatchewan, Canada, that includes runoff, runoff nutrients, snowpack, soil moisture, and soil nutrients for a 50-year period, during which the hillslopes underwent controlled, comparative changes in agricultural practices.
The hillslope-scale dataset is at the spatial scale intermediate between more traditional long-term catchment-scale datasets (e.g., Water Survey of Canada (WSC) Historical Data, the United States Geological Survey (USGS) National Streamflow Information Program, or the UK National River Flow Archive) and point-scale datasets (e.g., TERENO-SOILCan network, Pütz et al., 2016, or the Reynold's Creek soil lysimeter network, Seyfried et al., 2001). As such, hillslope-scale measurements of precipitation and runoff, together with internal measurements of soil moisture, snowpack, and soil nutrients, offer an opportunity to understand mechanistically the links between climate trends in rainfall and snowmelt inputs and runoff outputs. Further, in terms of land use change in dry agroecosystems, they offer an opportunity to understand how tillage, seeding, and crop rotational practices affect the hydrology of agricultural hillslopes as well as nutrient delivery to downstream water bodies.
The collation of our long-term hillslope database has been motivated largely by the importance of water management and sustainability for dryland agriculture on seasonally frozen, snowmelt-dominated terrain. This paper reports on an archive of downloadable data from an experimental, agriculturally managed hillslope site at Swift Current, Saskatchewan. This dataset documents the characteristics more broadly of the semiarid portions of the northern Great Plains of North America. It serves as a resource for long-term analyses and model formulation, calibration, and testing of land management and climate change effects on agricultural hillslopes.
The three hillslopes (also referred to as “watersheds” in the dataset) are located at South Farm (50∘ N, 107∘ W), an agricultural research site of the Swift Current Research and Development Centre of Agriculture and Agri-food Canada, approximately 5 km southeast of Swift Current, Saskatchewan (Fig. 1). The hillslopes adjoin each other and are rectangular in shape, with areas of 4.25 ha (Hillslope 1), 4.66 ha (Hillslope 2), and 4.86 ha (Hillslope 3). The hillslopes are approximately 150 m wide in the east–west direction and 300–320 m long in the north–south direction. They were artificially diked with raised grassed berms constructed in the 1950s by Agriculture and Agri-food Canada. Hydrological observations at the hillslopes began in 1962 to address the effects of agricultural land management practices on runoff water supply and quality, chemical transport, and soil erodibility.

Figure 1(a) Location of the Swift Current hillslopes in Canada. (b) Aerial photograph (facing south) of the Swift Current hillslopes (from right to left: Hillslope 1, Hillslope 2, Hillslope 3), taken in a year when wheat was grown. The runoff flumes, measurement locations for snowpack and soil moisture, and the meteorological station are indicated. Figure modified, with permission, from Cessna et al. (2013) and Coles et al. (2017).
Table 1Crop rotationa (and tillage) history of the three hillslopes.
a F – fallow, W – spring wheat (Triticum aestivum L.), grass (Psathyrostachys juncea (Fisch.) Nevski), GM – green manure chickling vetch (Lathyrus sativus), LP – pulse crop, lentil (Lens culinaris L.), or field pea (Pisum sativum L.) in alternating pulse crop years. b conv till – conventional tillage with cultivator including harrows or rod weeder used in last operation before seeding with hoe drill.
The hillslopes have undulating topography and slope towards the north-northwest with gradients of 1 %–4 %. Digital elevation models (DEMs), obtained using a Leica Viva GS15 from 17 to 18 April 2012, are available for all three hillslopes at a 2 m horizontal resolution (Coles et al., 2018). These DEMs were obtained by mounting the Leica Viva GS15 rover to a side-by-side vehicle at a height of 2 m above the ground surface. The vehicle was driven methodically up and down each hillslope, achieving full coverage of each hillslope (Coles et al., 2018). The GPS was set to automatically collect points every 2 m and at instances when the elevation change exceeded 0.15 m (Coles et al., 2018). The survey was referenced to a permanent Agriculture and Agri-food Canada benchmark located near to the hillslopes, to give elevations in meters above sea level. Location data for these DEMs are in the projected coordinate system UTM Zone 13N with GRS 1980 datum. Two additional DEMs, obtained using an Optech ILRIS-LR Terrestrial Laser Scanner in summer 2014, are available for Hillslope 2 at a 0.25 m horizontal resolution (Coles et al., 2018b). These two finer DEMs of Hillslope 2 were obtained from surveys on 7 July 2014 and 24 September 2014, before and after a simulated seeding of the hillslope. They therefore capture the surface micro-topography of a tilled hillslope with random soil clod undulations, as well as a seeding-induced ridge-and-furrow topography. These DEMs were obtained by mounting the laser scanner at the top of a 15 ft (4.57 m) scaffolding tower located on the eastern margin of Hillslope 2 and also from the top of a vehicle parked in the northeastern corner of the hillslope. The elevation data are relative elevations (not absolute elevations). Location data for these DEMs are in the projected coordinate system UTM Zone 13N with GRS 1984 datum. Additional information on the generation of the 2 m and 0.25 m DEMs can be found in Coles et al. (2018).
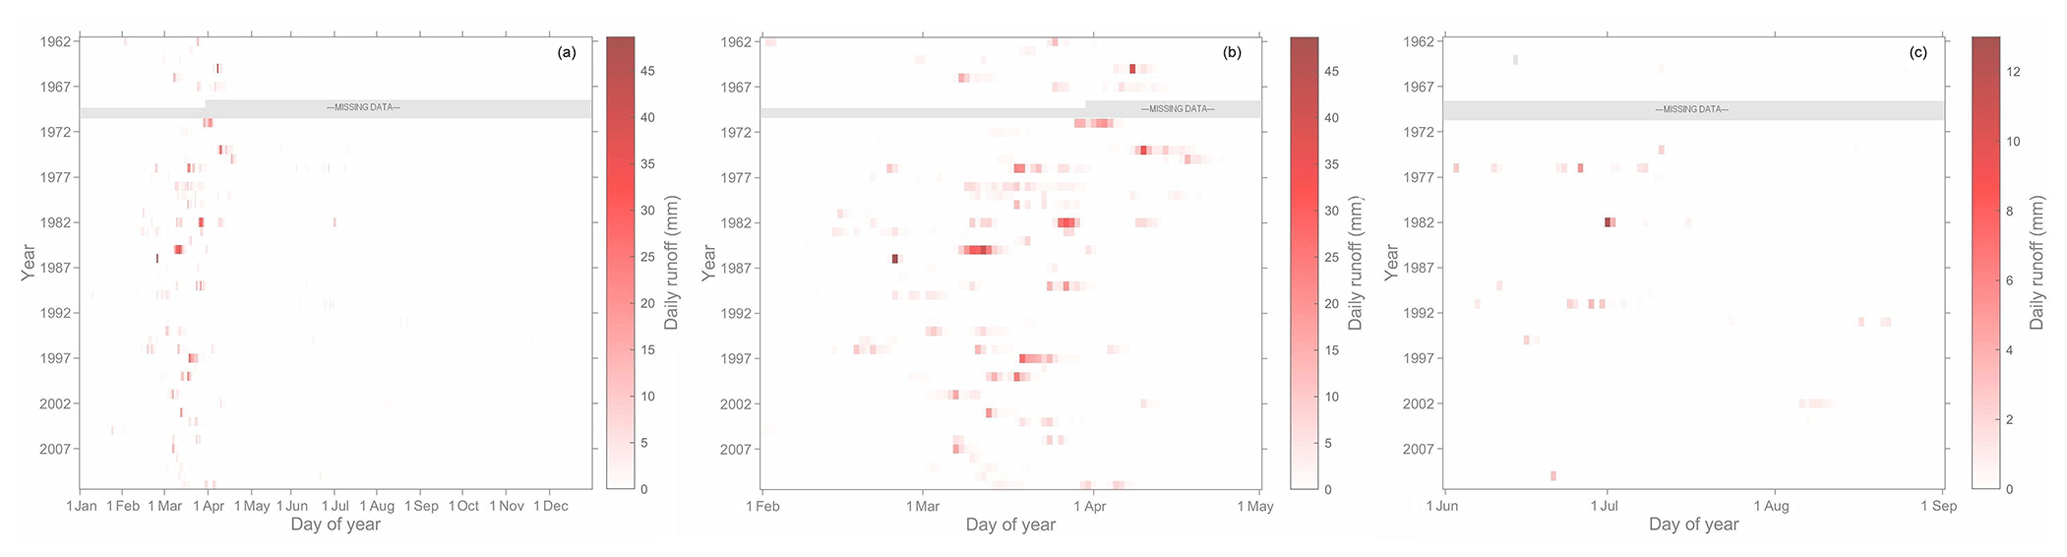
Figure 2Daily runoff (mm) for the 50-year period on Hillslope 2. (a) shows the full calendar year for the 50-year period (1 January 1962 to 31 December 2011). (b) shows just the spring period (here, 1 February to 1 May), for increased clarity of the spring snowmelt-runoff data. (c) shows just the summer period (here, 1 June to 1 September), for increased clarity of the summer rainfall-runoff data.
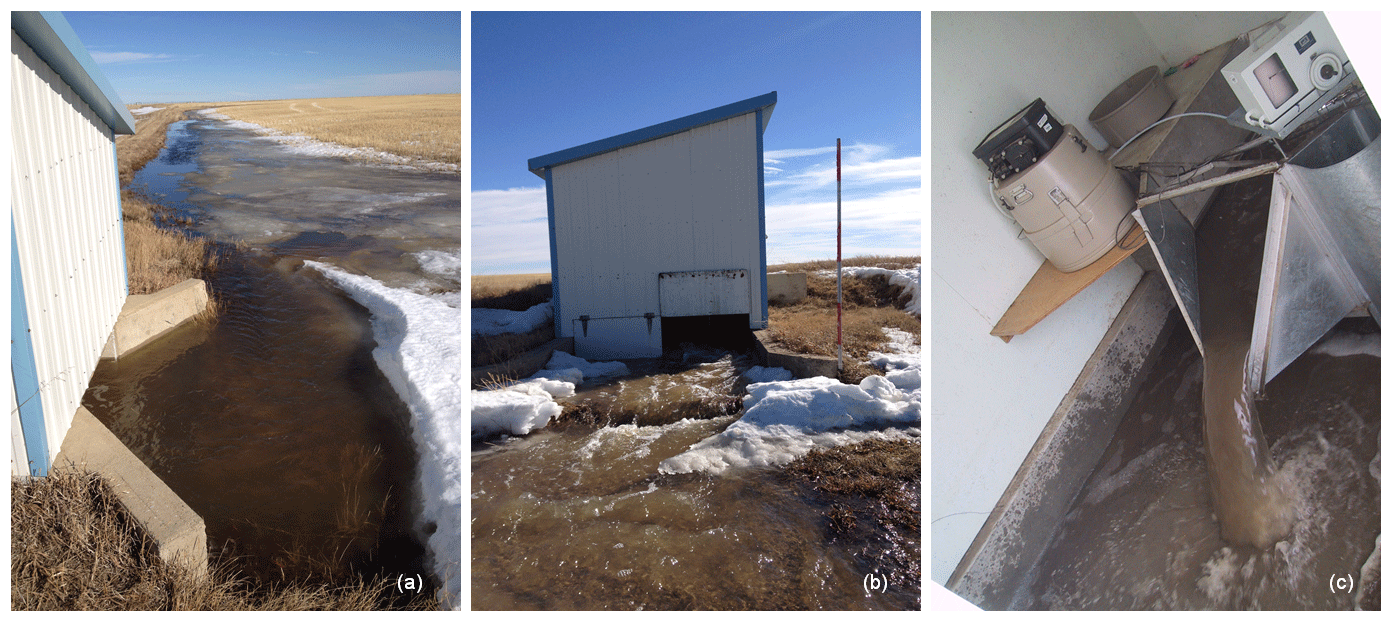
Figure 3Photographs of the runoff shed at Hillslope 2. (a) Facing east, at the inflow side of the shed (taken March 2014). (b) Facing south, at the outflow side of the shed (taken March 2014). (c) Inside the shed, showing a 0.61 m H flume, a Stevens water level chart recorder, and an automated ISCO 3700 Portable Sampler.
The soils are Orthic Brown Chernozems (Ayres et al., 1985), specifically Swinton silt loam in the upper four-fifths of the hillslopes, where the solum is developed within loess, and Haverhill loam in the lower fifth of the hillslope, where past erosion has resulted in the solum extending into the underlying loamy till (McConkey et al., 1997). The surficial 0–15 cm soil layer consists of 50.4 % silt, 31.4 % sand, and 18.2 % clay, has a bulk density of 1.22 g cm−3, and has a saturated hydraulic conductivity of 14.2 mm h−1 (Coles and McDonnell, 2018). Silt content decreases with depth, while clay content increases with depth. Mean soil depth, as measured with a dynamic cone penetrometer, is 2.65 m (Coles and McDonnell, 2018).
The hillslopes have been predominantly under an annual rotation of wheat (Triticum aestivum L.) and fallow (Table 1). This two-crop rotation is with the exception of a period (1977–1980) of grass (Psathyrostachys juncea (Fisch.) Nevski) and a period (1982–1985) of annual wheat on Hillslopes 1 and 2; an annual rotation (1994–2010) of wheat and legume green manure (Lathyrus sativus L.) without use of herbicides or mineral fertilizers on Hillslope 1; and an annual rotation (2004–2011) of wheat and pulses (lentils and peas; Lens culinaris L. and Pisum sativum L., respectively) on Hillslope 2. The hillslopes have largely been under conventional tillage practice with a heavy-duty cultivator, with the exception of the period 1993–2011 when Hillslope 2 was switched to no tillage practice, with weed control entirely with herbicides. Unlike the other two hillslopes, Hillslope 3 has had a consistent two-crop rotation and consistent tillage management since 1962.

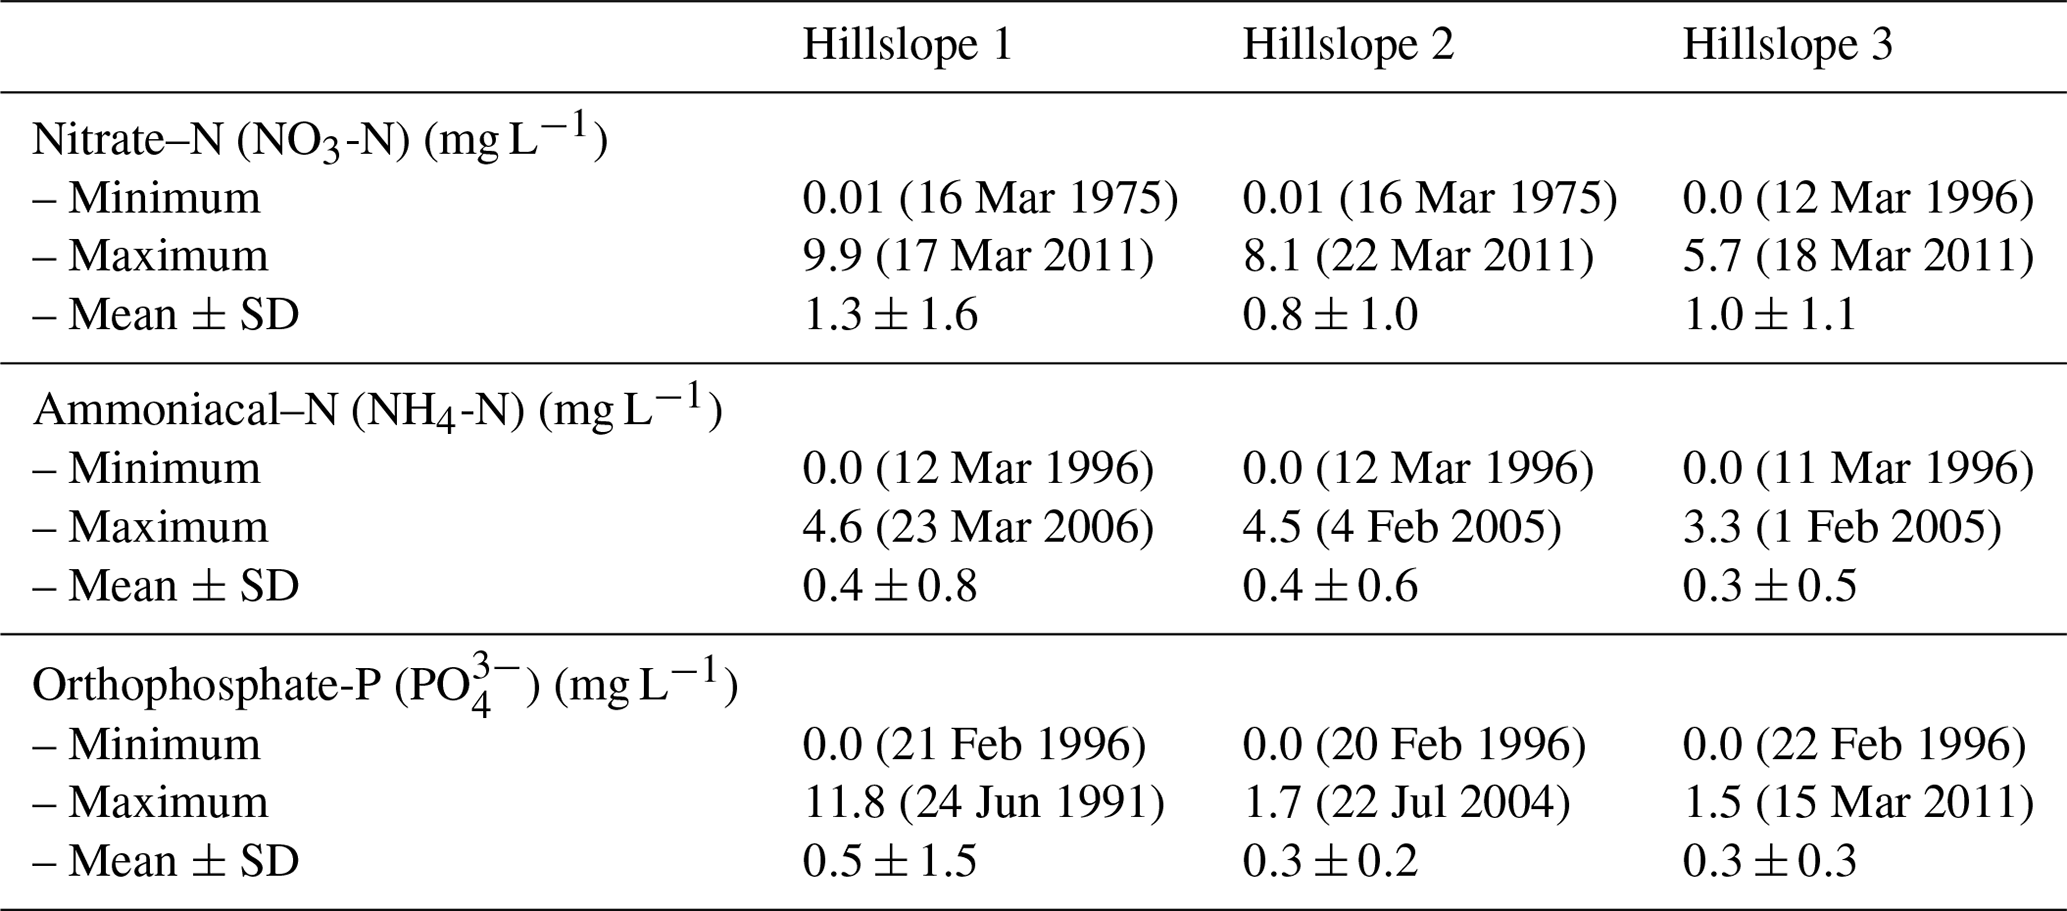
Table 4Summary statistics of runoff nutrient concentration data.
From 1962 to 2011, runoff, runoff nutrient concentration, snowpack characteristics, soil moisture, and soil nutrient concentration were monitored on the hillslopes. The year 2011 marked the final year of regular monitoring of the hillslopes by the Swift Current Research and Development Centre of Agriculture and Agri-food Canada. In 2013 and 2014, monitoring of runoff, snowpack characteristics, and soil moisture was undertaken in collaboration with the University of Saskatchewan; these data are presented separately (Appels et al., 2017; Coles and McDonnell, 2018). If regular monitoring of the hillslopes resumes, the data repository will be updated accordingly. Meteorological data from an Environment and Climate Change Canada meteorological station located 390 m to the south-southeast complement the hillslope dataset.
These data have proven valuable for the study of a variety of research questions related to the interactions between agricultural practices, climate, hydrology, and nutrient export. Studying the effects of agricultural practices on nutrient export and water quality, Nicholaichuk and Read (1978) showed guideline-exceeding N and P concentrations in runoff from unfertilized hillslopes. Schneider et al. (2019) used the long-term data set to show that the conversion to no-till farming caused an increase in snowmelt runoff, which subsequently increased nutrient exports. Cessna et al. (2013) found an increased amount of herbicide exported in runoff from conservation tillage hillslopes, due to the increased use of herbicides. McConkey et al. (1997) showed that soil erosion was greatest in April during snowmelt-runoff events over partially frozen soil and that erosion occurring during rainfall-runoff events was relatively unimportant. Hydrological process studies at this site include Coles et al. (2017), who explored the hierarchies of importance of various controls on snowmelt-runoff generation. Appels et al. (2017) and Coles and McDonnell (2018) used single melt season intensive data collection to quantify the spatial patterns of hydrological variables and the generation of snowmelt-runoff connectivity over low-angled terrain. Finally, climate change studies at this site have shown warming winter and spring temperatures, decreasing snowfall amounts, and a resultant decrease in snowmelt-runoff amounts, earlier spring runoff timing, and an increase in summer rainfall amounts but no change in rainfall-driven runoff (Cutforth et al., 1999; Coles et al., 2017).
The available data are summarized in Table 2 and detailed below.
Table 5Summary statistics of hillslope-averaged snowpack data (only using data from the last survey before the end of winter).

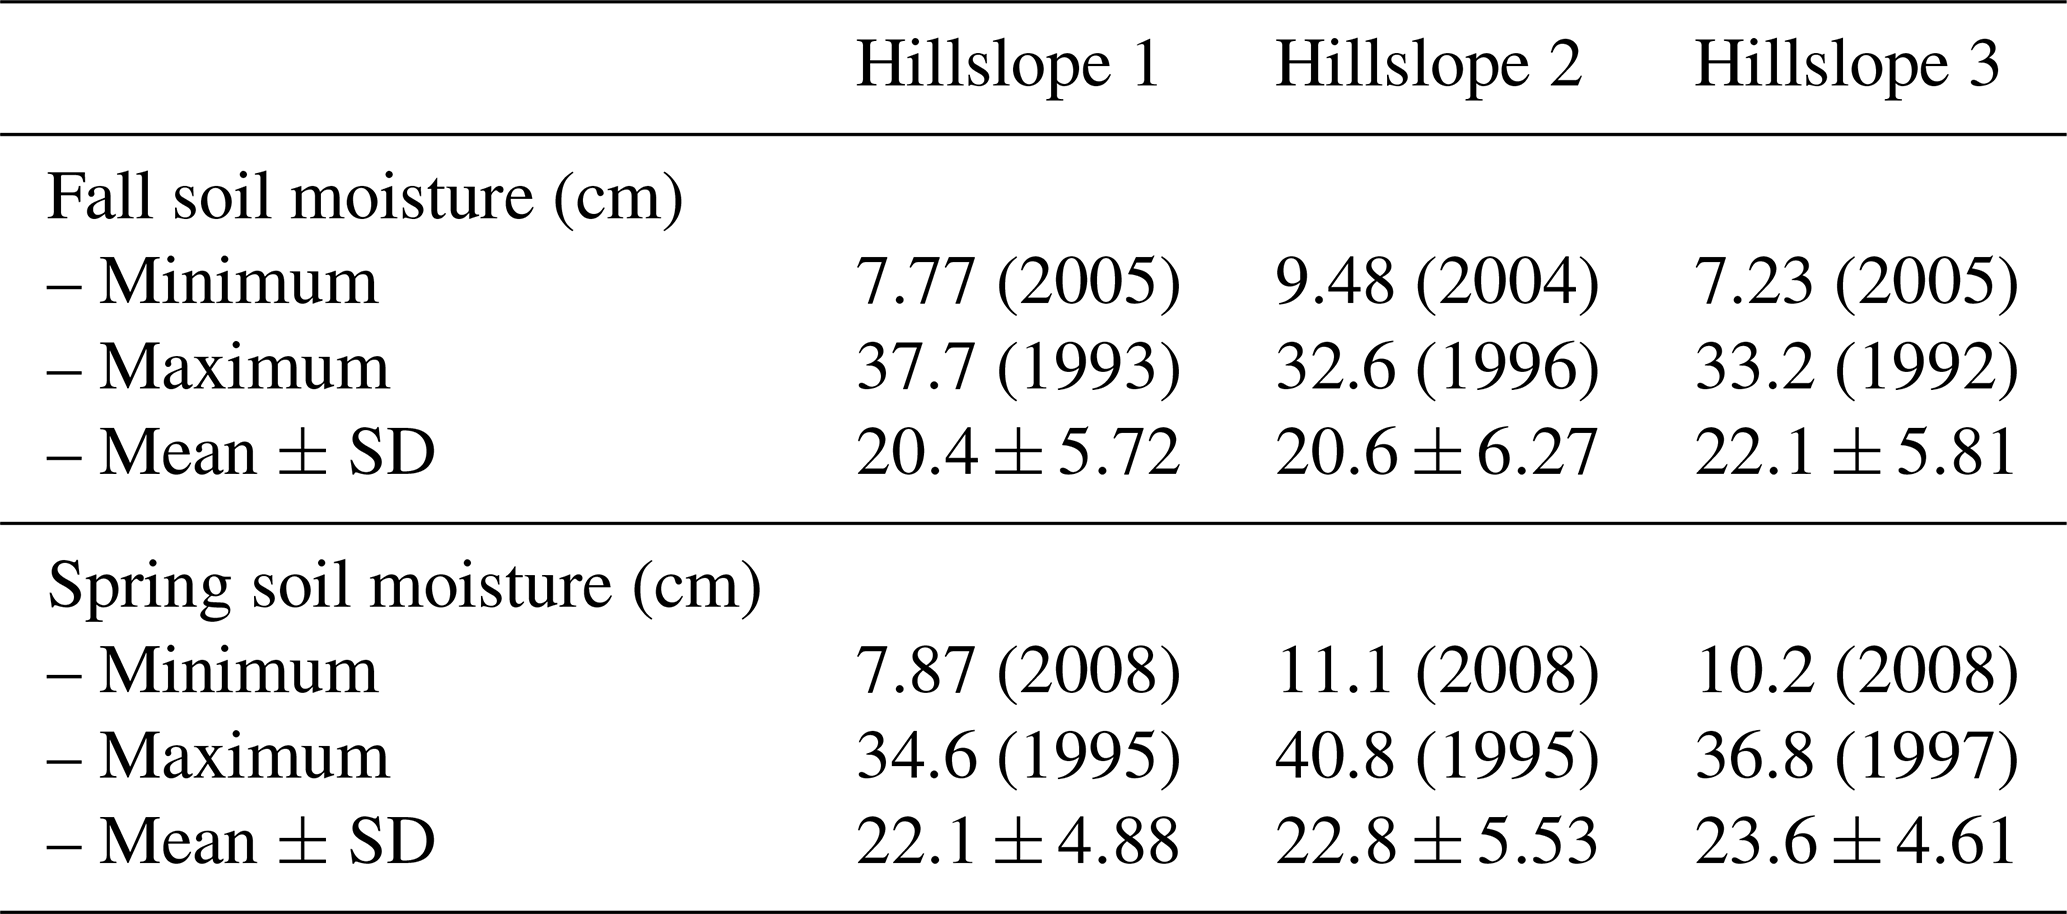
Table 6Summary statistics of soil moisture data (for simplicity, data are aggregated over the five depth intervals and presented for the entire 0–120 cm soil profile; however, data are recorded separately by the depth interval in the dataset).
4.1 Runoff
Runoff from the hillslopes is non-continuous and generated during snowmelt and occasionally during heavy rainfall events. Figure 2 shows the 50-year runoff record for one hillslope (Hillslope 2). Of the 50 years on record, 46 of those years saw measurable flow during spring snowmelt (on at least one of the hillslopes) and 28 years saw measureable hillslope-scale runoff during non-melt rainfall-runoff events (also on at least one of the hillslopes). Because the flumes are so small, the minimum measureable instantaneous flow through the flume is 0.07 L. Assuming a reliable reading would need 30 s at that flow rate, this translates to a minimum measureable daily flow of 0.000049 mm d−1 (Hillslope 1), 0.000045 mm d−1 (Hillslope 2), and 0.000043 mm d−1 (Hillslope 3). The dataset includes data on daily runoff (mm) and daily peak flow (L s−1). Any missing data are shown by an “NA” and also flagged with an “m”.
The raised grassed berms prevent runoff from being transferred between the hillslopes. Runoff from the hillslopes is routed through a 0.61 m H flume (Bos, 1989) at the downstream outlet (north-northeastern corner) of each hillslope. The flume state was measured between January 1962 and December 2011 using a Stevens (Portland, Oregon, USA) water level chart recorder in the stilling well of each flume. Since 1994, a water level recorder shaft position encoder (Belfort Instrument Co., Baltimore, Maryland, USA) has been the primary method to record water level. Daily cumulative runoff amounts (mm) were calculated from these water level measurements using a standard H flume rating curve (Bos, 1989). The H flumes were heated in cold weather to prevent icing. Prior to 1993, the flumes were in the open and heated with propane-fueled heaters under the flumes. After 1993, the flume sides and bottoms were electrically heated with resistance heaters and the flumes were in a small building that was also electrically heated (Fig. 3). There are no runoff data from March 1969 to November 1970 as the flumes were not monitored. A heavy rainfall event on 14 June 1964 caused flow rates to exceed the flume capacity. Runoff during this event is reported as “NA” in the dataset, but total daily runoff was estimated to be 72 mm with a peak flow of 60 mm h−1 (McConkey et al., 1997). Table 3 provides a summary of the runoff statistics.
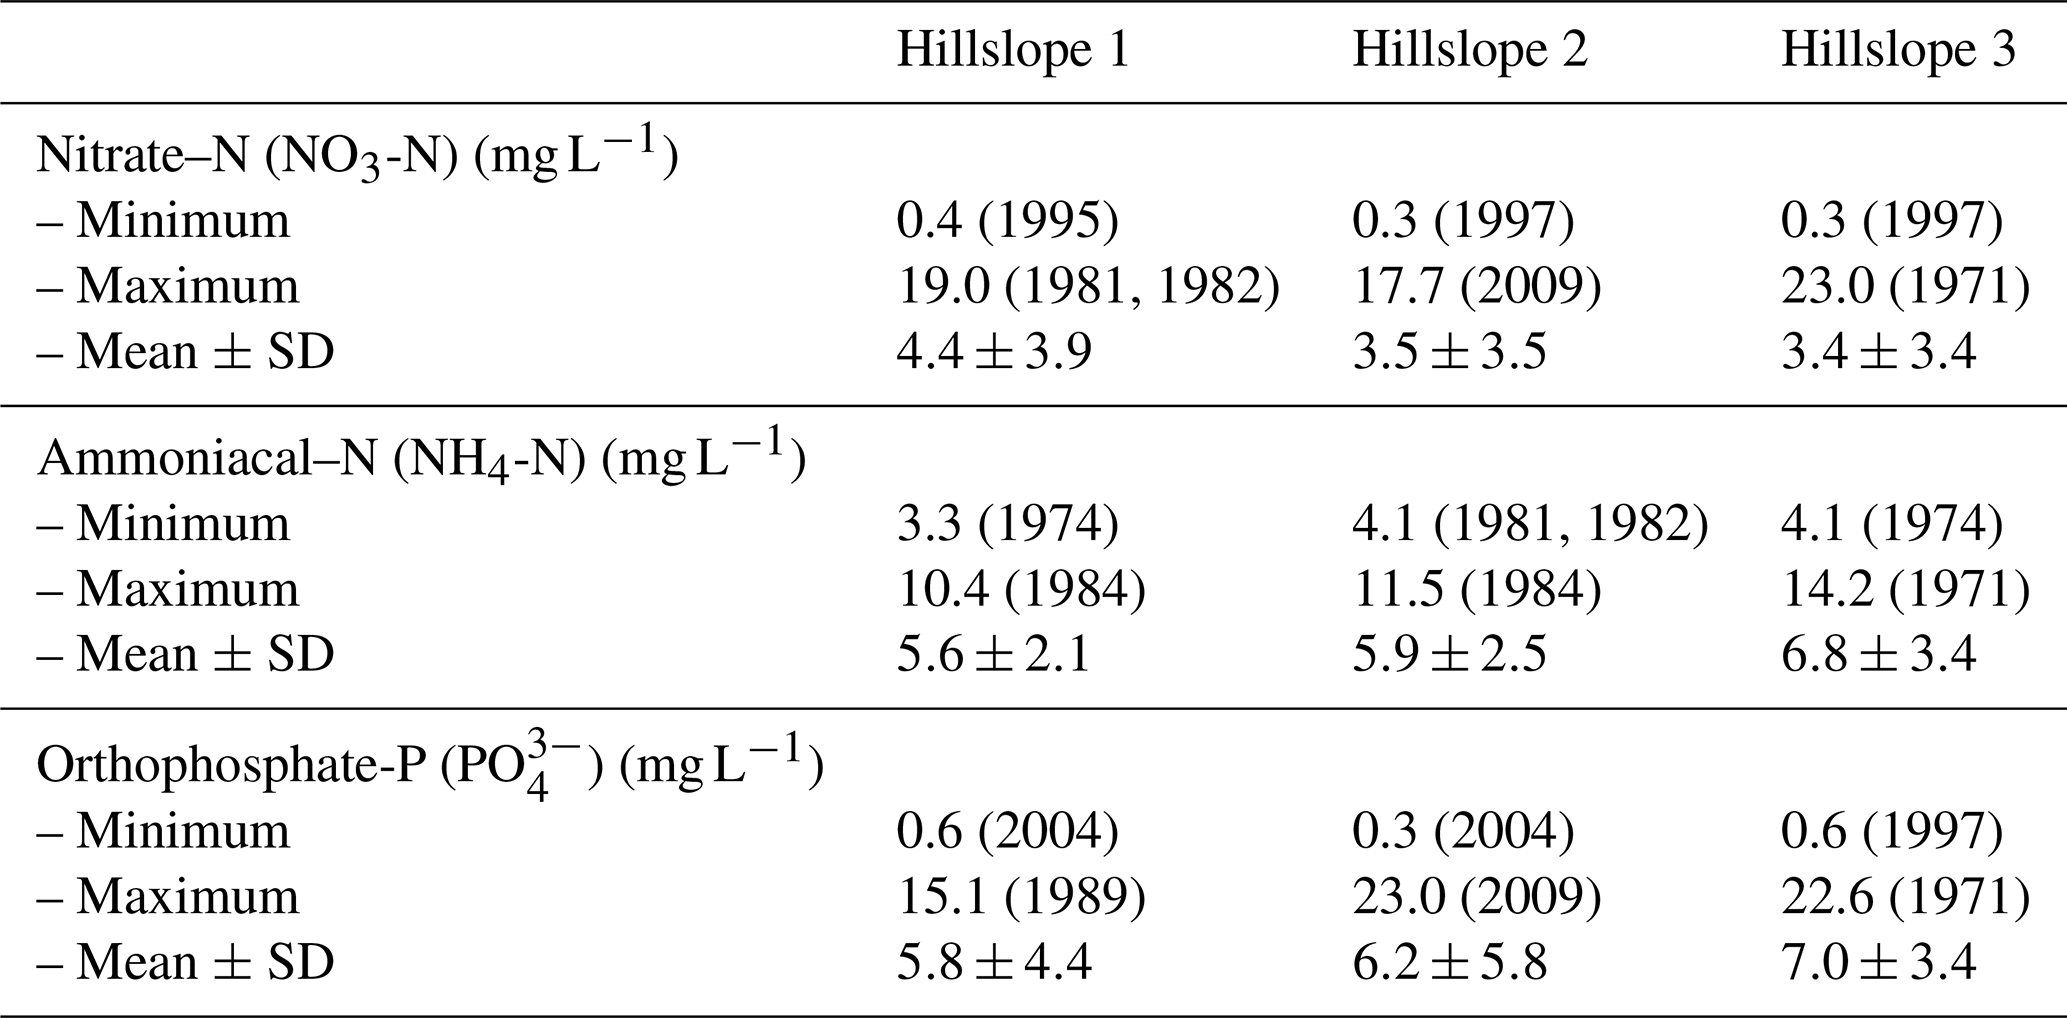
Table 7Summary statistics of soil nutrient concentration data.
4.2 Runoff nutrient concentrations
Nutrient concentrations in the runoff were measured on a daily basis during runoff events from runoff samples taken from the flume at the downstream outlet of each hillslope. Concentration data (in mg L−1) are available for nitrate–N (1971–2011), ammoniacal–N (1996–2011), and orthophosphate-P (1971; 1991–2011).
Prior to 1993, on days with appreciable runoff, water samples were collected manually in 0.5 L glass containers at mid-morning (10:00 h ± 30 min) and mid-afternoon (15:00 h ± 30 min). From 1993 onward, 0.5 L samples were collected using an automated water sampler (ISCO 3700 Portable Sampler, Isco, Inc.) previously described by Cessna et al. (2013). The collected water samples were filtered (No. 42, Whatman International filter papers, Maidstone, England) and then analyzed for dissolved NO3−N and orthophosphate-P according to the analytical procedure of Hamm et al. (1970) and for ammonium–nitrogen (NH4−N) according to the analytical procedure of Gentry and Willis (1988). The runoff nutrient concentration data are summarized in Table 4.
4.3 Snow depth, density, and water equivalent
Snowpack data were determined for each hillslope by manual snow surveys each year between 1965 and 2011. At nine points on each hillslope (as shown in Fig. 1), an average snow depth (cm) was determined from multiple locations in the close vicinity of the point with a graduated rod and density (g cm−3) was measured once per point as the mass of snow of measured depth taken in a 7.5 cm diameter core; the mass was determined in the field with a calibrated spring scale. The snow water equivalent (SWE; cm) was calculated from average snow depth multiplied by density. Snow surveys were carried out several times each winter, between January and March. Hillslope-averaged snow depth, density, and SWE were calculated from the nine points for each survey. These data are summarized in Table 5.
4.4 Soil moisture
Gravimetric soil moisture content (water fraction by volume of soil) was measured twice each year between 1971 and 2011: in fall prior to freeze-up (sometime in September–November) and in spring following snowmelt (sometime in April–May). The measurements were taken at the same nine points on each hillslope at which snow characteristics were measured (Fig. 1), at five depth intervals per point: 0–15, 15–30, 30–60, 60–90, and 90–120 cm. The soil moisture was measured from a subsample of the entire mixed interval and reported for the mid-point of the interval. These gravimetric soil moisture contents were converted to volumetric soil moisture using average bulk density across the hillslopes derived from occasional measurements from mass of soil taken in cores of a known volume and depth. These bulk densities were 1.26 g cm−3 for 0–15 cm, 1.29 g cm−3 for 15–30 cm, 1.39 g cm−3 for 30–60 cm, 1.54 g cm−3 for 60–90 cm, and 1.63 g cm−3 for 90–120 cm. Hillslope-averaged soil moisture at each depth was calculated from the nine points. Soil moisture data in the dataset are reported in centimeters of water for each soil profile depth interval. A summary of the soil moisture aggregated over the entire 0–120 cm soil profile is presented in Table 6.
4.5 Soil nutrient concentrations
A subsample from the same samples collected for soil moisture in fall and spring was air-dried and analyzed for NO3-N (1970–1992; 1994–2010), bicarbonate-extractable (Olsen) P (1970–1992; 1994–2010), and ammoniacal–N (1970–1992) (Hamm et al., 1970). Data are reported in the dataset in units of concentration (mg L−1) and mass (kg ha−1). A summary of the fall soil nutrient concentration data is presented in Table 7.
4.6 Meteorology
To complement the hillslope data, meteorological data are available from the Environment and Climate Change Canada meteorological station (station name: Swift Current CDA; Climate ID: 4028060; WMO ID: 71446; and downloadable at http://climate.weather.gc.ca/, last access: 30 August 2019), 390 m south of the southwestern corner of Hillslope 1 and within 1 km of all three hillslopes. These data include daily (1962–present) precipitation (snowfall and rainfall), temperature, wind speed and direction, and snow depth, and hourly (1995–present) temperature, wind speed and direction, and relative humidity.
Data from the three Swift Current hillslopes are available at https://doi.org/10.23684/hhn5-rz52 (McConkey and Thiagarajan, 2018). This depository includes the runoff, runoff nutrient concentrations, snowpack, soil moisture, soil nutrient concentrations, and crop and tillage data. Herbicide and sediment concentration data are not included in this dataset. We have also made available the digital elevation data for the site, which can be accessed at https://doi.org/10.20383/101.0117 (Coles et al., 2018). The Environment and Climate Change Canada meteorological data are available at http://climate.weather.gc.ca/ (last access: 30 August 2019).
This paper has presented details of a long-term (1962–2013) dataset from three 5 ha research hillslopes at the Swift Current Research and Development Centre (of Agriculture and Agri-food Canada) in southern Saskatchewan on the northern Great Plains. The hillslopes are seasonally frozen and under agricultural management. Runoff from the hillslopes is non-continuous and is dominated by spring snowmelt. The dataset includes runoff, runoff nutrient concentrations, snowpack depth, density and water equivalent, soil moisture, soil nutrient concentrations, and crop and tillage data. Digital elevation data are also available for the three hillslopes at a 2 m horizontal resolution, and, for one of the hillslopes (Hillslope 2), at a 0.25 m horizontal resolution. A nearby Environment and Climate Change standard meteorological station provides a dataset of precipitation, temperature, and other climate conditions at daily (1962 onwards) and hourly (1995 onwards) resolution. Data from the three hillslopes and the meteorological station are now available online. This rich dataset is a valuable source for hydrological response analysis and model formulation and calibration within the context of climate and land management change.
AEC, JJM, and BGM conceptualized the paper. AEC wrote the original draft, carried out data analysis, and produced the figures and tables (with the exception of Table 1, which BGM produced). AEC, JJM, and BGM reviewed and edited later drafts.
The authors declare that they have no conflict of interest.
This article is part of the special issue “Water, ecosystem, cryosphere, and climate data from the interior of Western Canada and other cold regions”. It is not associated with a conference.
This hillslope dataset exists thanks to the hard work of many Agriculture and Agri-food Canada researchers, technicians, and students over the last 6 decades. Don Reimer and Marty Peru are thanked especially for their dedicated technical service to the hillslopes from 1971 to 1994 and from 1995 to 2011, respectively. We thank Warren Helgason, Michael Solohub, and Amber Peterson (University of Saskatchewan) and Mark Russell, Cuyler Onclin, and Samson Mengistu (Environment and Climate Change Canada) for their surveying efforts to create the DEMs. We thank Willemijn Appels for her contributions to the dataset and Chris Spence and Charles Maule for their earlier reviews of this paper.
This paper was edited by Warren D. Helgason and reviewed by Christopher Spence and Charles Maule.
Appels, W. M., Coles, A. E., and McDonnell, J. J.: Infiltration into frozen soil: From core-scale dynamics to hillslope-scale connectivity, Hydrol. Process., 32, 66–79, https://doi.org/10.1002/hyp.11399, 2017.
Ayres, K. W., Acton, D. F., and Ellis, J. G.: The soils of the Swift Current map area 72J Saskatchewan, Saskatchewan Institute of Pedology, Publ. 86, Extension Division, University of Saskatchewan, Saskatoon, SK, Extension Publ. 481, 1985.
Bos, M. G.: Discharge measurement structures, ILRI publication, International Institute for Land Reclamation and Improvement, Wageningen, the Netherlands, 1989.
Cessna, A. J., McConkey, B. G., and Elliott, J. A.: Herbicide transport in surface runoff from conventional and zero tillage fields, J. Environ. Qual., 42, 782–793, 2013.
Coles, A. E.: Runoff generation over seasonally-frozen ground: trends, patterns, and processes, University of Saskatchewan, Saskatoon, Canada, http://hdl.handle.net/10388/7790 (last access: 30 August 2019), 2017.
Coles, A. E. and McDonnell, J. J.: Fill and spill drives runoff connectivity over frozen ground, J. Hydrol., 558, 115–128, 2018.
Coles, A. E., McConkey, B. G., and McDonnell, J. J.: Climate change impacts on hillslope runoff on the northern Great Plains, 1962–2013, J. Hydrol., 550, 538–548, 2017.
Coles, A., Russell, M., Onclin, C., Helgason, W., Peterson, A., Solohub, M., and McDonnell, J.: The Swift Current hillslopes, Saskatchewan: Digital elevation data, Federated Research Data Repository, https://doi.org/10.20383/101.0117, 2018.
Cutforth, H. W., McConkey, B. G., Woodvine, R. J., Smith, D. G., Jefferson, P. G., and Akinremi, O. O.: Climate change in the semiarid prairie of southwestern Saskatchewan: Late winter–early spring, Can. J. Plant Sci., 79, 343–350, 1999.
Gentry, C. E. and Willis, R. B.: Improved method for automated determination of ammonium in soil extracts, Commun. Soil Sci. Plant Anal., 19, 721–737, 1988.
Hamm, J. W., Radford, F. G., and Halstead, E. H.: The simultaneous determination of nitrogen, phosphorus and potassium in sodium bicarbonate extracts of soils, in: Technicon International Congress, Advances in automatic analysis, Vol. 2, Industrial Analysis, Futura Publ. Co., Mt. Kisco, NY, 65–69, 1970.
Laudon, H., Spence, C., Buttle, J., Carey, S. K., McDonnell, J. J., McNamara, J. P., Soulsby, C., and Tetzlaff, D.: Save northern high-latitude catchments, Nat. Geosci., 10, 324–325, 2017.
McConkey, B. and Thiagarajan, A.: Swift Current Water Chemistry – Long Term Tillage Study – 1962–2011, Agriculture and Agri-Food Canada, https://doi.org/10.23684/hhn5-rz52, 2018.
McConkey, B. G., Nicholaichuk, W., Steppuhn, H., and Reimer, C. D.: Sediment yield and seasonal soil erodibility for semiarid cropland in western Canada, Can. J. Soil Sci., 77, 33–40, 1997.
Nicholaichuk, W. and Read, D. W.: Nutrient runoff from fertilized and unfertilized fields in western Canada, J. Environ. Qual., 7, 542–544, 1978.
Pütz, Th., Kiese, R., Wollschläger, U., Groh, J., Rupp, H., Zacharias, S., Priesack, E., Gerke, H. H., Gasche, R., Bens, O., Borg, E., Baessler, C., Kaiser, K., Herbrich, M., Munch, J.-C., Sommer, M., Vogel, H.-J., Vanderborght, J., and Vereecken, H.: TERENO-SOILCan: A lysimeter-network in Germany observing soil processes and plant diversity influenced by climate change, Environ. Earth Sci., 75, 1242, https://doi.org/10.1007/s12665-016-6031-5, 2016.
Schneider, K. D., McConkey, B. G., Thiagarajan, A., Elliott, J. A., and Reid, D. K.: Nutrient loss in snowmelt runoff: results from a long-term study in a dryland cropping system, J. Environ. Qual., 48, 831–340, 2019.
Seyfried, M. S., Hanson, C. L., Murdock, M. D., and Van Vactor, S.: Long-term lysimeter database, Reynolds Creek Experimental Watershed, Idaho, United States, Water Resour. Res., 37, 2853–2856, 2001.