the Creative Commons Attribution 4.0 License.
the Creative Commons Attribution 4.0 License.
 | 28 Jan 2019
Glider data collected during the Algerian Basin Circulation Unmanned Survey
Yuri Cotroneo
Giuseppe Aulicino
Simon Ruiz
Antonio Sánchez Román
Marc Torner Tomàs
Ananda Pascual
Giannetta Fusco
Emma Heslop
Joaquín Tintoré
Giorgio Budillon
We present data collected in the framework of the Algerian BAsin Circulation Unmanned Survey (ABACUS) project. The main objective of ABACUS is the monitoring of the basin circulation and of the surface and intermediate water masses' physical and biological properties in a key region of the Mediterranean Sea circulation. Data presented here have been collected through deep glider cruises in the Western Mediterranean Sea during the autumns of 2014, 2015 and 2016; activities at sea are expected to be repeated during the coming years, so that the dataset will be extended. Glider missions were conducted in the Algerian Basin, between the island of Mallorca and the Algerian coast. Across the three glider missions, eight repeated transects were completed which enabled us to investigate the basin-scale circulation and the presence of mesoscale structures, utilising both the adaptive sampling capabilities of the gliders and the higher resolution of the data.
After collection, all data passed a quality control procedure and were then made available through an unrestricted repository host by the SOCIB Data Centre at https://doi.org/10.25704/b200-3vf5. The actual dataset spans three autumn seasons, providing an important contribution to the data collection in the chronically undersampled Algerian Basin.
Temperature and salinity data collected in the first 975 m of the water column allowed us to identify the main water masses and describe their characteristics, improving the understanding of the dynamics of the region. On the timescale of the project, data show a large variability in the surface layer and reduced variability in the intermediate and deep layers.
Our measurements have been successfully compared to data previously collected in the area from 1909 to 2011. Results showed similar overall distribution, ranges and variability to the historical data, with no outliers in the surface or deep layers.


The south-western Mediterranean Sea is an important transit region characterised by the presence of both fresh surface waters coming from the Atlantic (Atlantic Water, hereafter AW) and more saline waters which typically reside in the Mediterranean region. At intermediate levels (400–1000 m) there is Levantine Intermediate Water (LIW), typified by subsurface temperature and salinity maxima, while deeper layers (> 1000 m) are characterised by Western Mediterranean Deep Water (WMDW) (Millot, 1999; Millot et al., 2006). Most of the Western Mediterranean includes the Algerian Basin (AB), a wide and deep basin comprised of the Balearic Islands, the Algerian coast and the Sardinia Channel, where an intense inflow–outflow regime exists and complex circulation patterns are present (e.g. Pascual et al., 2013; Cotroneo et al., 2016; Aulicino et al., 2018). Typically, AW entering through the Strait of Gibraltar flows eastward at the AB surface, mainly inside the Algerian Current (AC), while more saline water masses, formed in the eastern and northern parts of the Mediterranean, flow westward at the intermediate and deep layers (Millot, 1985; Testor et al., 2005). As previously demonstrated by several studies, AW and Mediterranean waters interact at different scales, from the basin scale to the mesoscale and sub-mesoscale (Robinson and Golnaraghi, 1994; Fusco et al., 2003; Vidal-Vijande et al., 2011), allowing a high seasonal and interannual variability in the basin. This aspect is favoured by the presence of the AC. After leaving the Alboran Sea (Tintoré et al., 1991), this along-slope current, 30–50 km wide, flows eastward along the Algerian coast, carrying the AW eastwards (Testor et al., 2005). Typically, the AC becomes unstable along its path due to complex hydrodynamic processes and forms several meanders which frequently evolve to isolated cyclonic and anticyclonic mesoscale eddies (e.g. Millot, 1985; Moran et al., 2001; Ruiz et al., 2002; Font et al., 2004; Escudier et al., 2016; Cotroneo et al., 2016; Pessini et al., 2018), promoting intense mesoscale activity all over the AB. These structures present high levels of kinetic energy (Pascual et al., 2013; Escudier, 2016) and impact the distribution of physical and chemical properties of water masses, especially at surface and intermediate depths (Taupier-Letage et al., 2003; Olita et al., 2011).
In the last two decades, both satellites and numerical simulations' data have been largely used to study mesoscale processes, partially balancing the scarcity of in situ observations. This improved our knowledge of the large-scale surface features (Vignudelli et al., 2003; Isern-Fontanet et al., 2016), but a complete understanding of mesoscale and sub-mesoscale processes in the basin is still needed. Toward this aim, frequent dedicated observations at higher horizontal and vertical resolution, along the water column, are essential (Pascual et al., 2017). Multi-platform monitoring strategies, which enable the integration of data from satellites, autonomous underwater vehicles (AUVs) and numerical models, have already demonstrated their capabilities in the assessment of oceanographic processes in different regions of the global ocean, such as the Atlantic Ocean (Shcherbina et al., 2015) and the Mediterranean Sea (Carret et al., 2018; Troupin et al., 2018; Pascual et al., 2017; Aulicino et al., 2016). The value of these is improved when implemented along repeated monitoring lines coincident with the satellite ground tracks (Aulicino et al., 2018). Among other AUVs, measurements at small sampling intervals collected through gliders (< 5 km spatial resolution) have contributed to several ocean studies (Rudnick, 2016; Heslop et al., 2012), from dynamics (e.g. Ruiz et al., 2009; Bosse et al., 2016; Cotroneo et al., 2016; Thomsen et al., 2016) to the physical and biogeochemical exchanges (e.g. Ruiz et al., 2012; Bouffard et al., 2010; Cotroneo et al., 2016; Olita et al., 2017) or the assessment of altimetry data (Heslop et al., 2017). However, gliders generally have a limited speed ranging between 0.35 and 0.50 m s−1 in the horizontal (Davis et al., 2003; Rudnick et al., 2004; Jones et al., 2005; Merckelbach et al., 2010) that can cause synopticity problems to arise when monitoring mesoscale phenomena (Rudnick and Cole, 2011; Alvarez and Mourre, 2012; Aulicino et al., 2016; Cotroneo et al., 2016) or wide areas (Liblik et al., 2016). Thus, their combination with reliable satellite products, numerical simulations and, when available, other platforms, such as drifters, ARGO floats and ship-borne CTDs or multiple glider missions, represents a good strategy for implementing observatories for marine science research which aim to study basin-scale and/or coastal processes (Aulicino et al., 2018) for which issues of synchronicity are a concern.
Furthermore, this integrated glider-based approach is also important for validating new satellite products, such as the now fully operational Sentinel-3 mission (Drinkwater and Rebhan, 2007; Heslop et al., 2017) and the upcoming Surface Water and Ocean Topography (SWOT) wide-swath radar interferometer (Fu and Ferrari, 2008), whereby multi-platform data are expected to help to distinguish noise from small dynamical structures, as a result of cross-calibrations between the different sensors (Bouffard et al., 2010; Pascual et al., 2013).
In this study, we present data collected through three SLOCUM G2 (Fig. 1) glider missions carried out in the AB during autumn 2014, 2015 and 2016. These cruises were developed along a repeated monitoring line set across the AB and allowed the collection of a huge dataset of physical and biological ocean parameters in the first 975 m of the water column. For each mission, the glider main track was chosen to lie under overflying altimeter satellites tracks, in order to optimise the inter-comparison of the data from the two platforms. Additionally, during the 2014 and 2015 glider cruises, the sampling track was changed in order to sample specific mesoscale circulation structures in the area. Even though this study is restricted to a particular area, i.e. the AB, we strongly believe that the scientific community could use these data to enlarge the knowledge of the western Mediterranean Sea and to refine the implementation of glider missions and integrated multi-platform observatories in other regions. Glider characteristics, sensors details, paths and mission strategies are described in Sect. 2; data format and quality control procedures are presented in Sect. 3. In Sect. 4, a comparison between Algerian BAsin Circulation Unmanned Survey (ABACUS) observations and historical data, as well as sample ABACUS transects, is presented. Finally, Sect. 5 reports main conclusions.
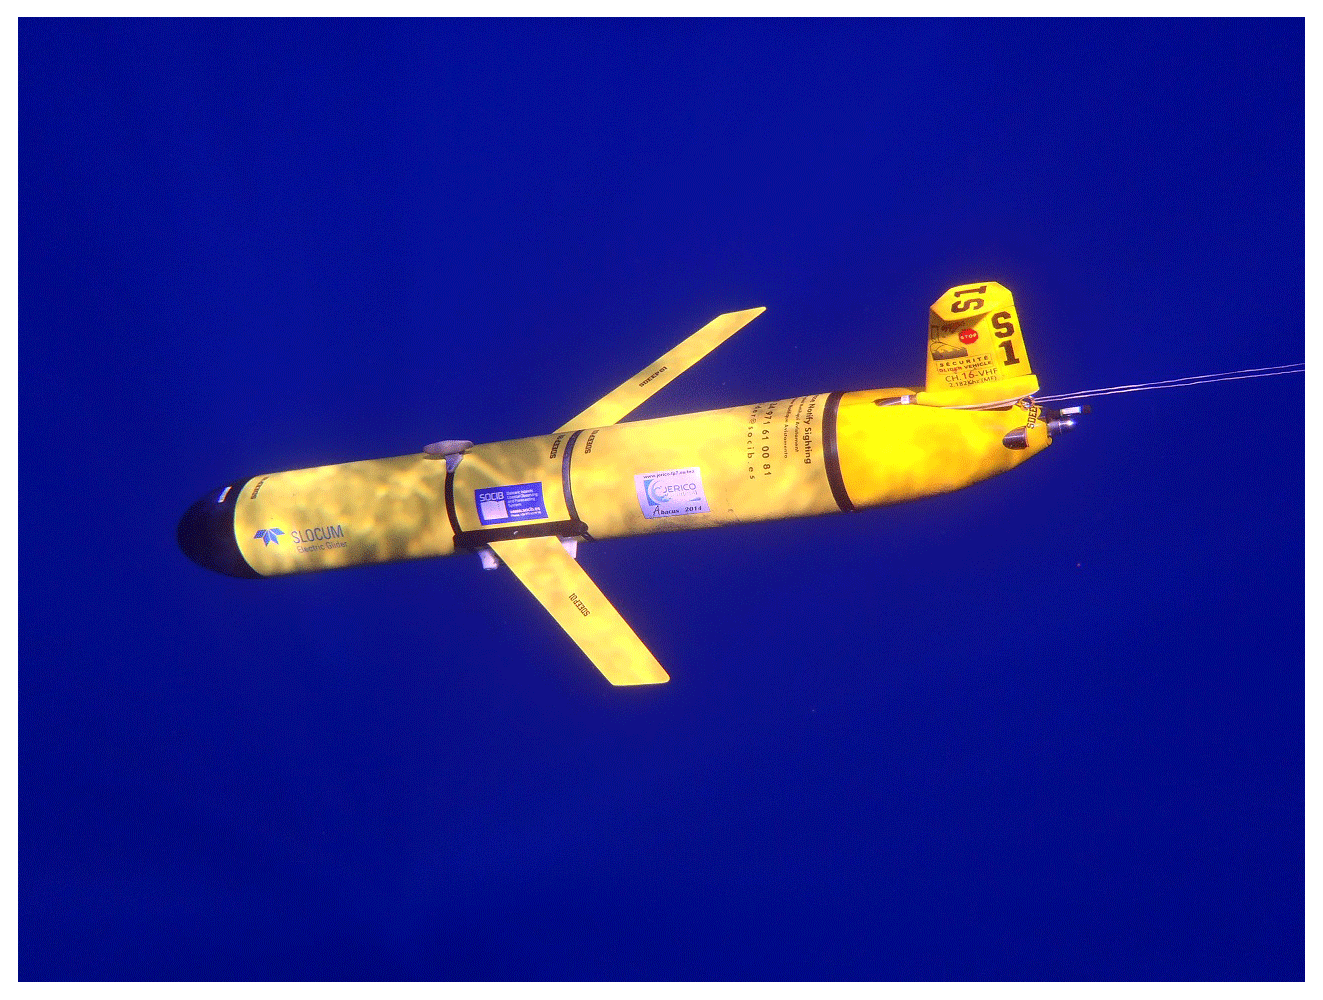
Figure 1The SLOCUM G2 glider during the ABACUS pre-mission test at sea. Credit M. Torner.
Gliders are AUVs able to provide high-resolution hydrographic and biochemical measurements. These vehicles control their buoyancy to allow vertical motion in the water column and make use of their hydrodynamic shape and small fins to make horizontal motions. Changing the position of the centre of gravity with respect to the centre of buoyancy helps to control both pitch and roll (Webb et al., 2001). This results in a typical saw-toothed navigation pathway to a maximum depth of 975 m.
During the autumns from 2014 to 2016, three deep SLOCUM G2 glider missions were carried out in the AB (Fig. 2) using two gliders from the same constructor, with the same characteristics and overpassing the same calibration procedures.
ABACUS glider missions were performed in the framework of the SOCIB (Balearic Islands Coastal Observing and Forecasting System) Glider Facility Open Access Programme and supported by the Joint European Research Infrastructure network for Coastal Observatories (JERICO) TransNational Access (TNA). Funding agreements were developed under the JERICO TNA third call (grant no. 262584) for ABACUS 1, the SOCIB external access for ABACUS 2 and JERICO-NEXT TNA first call (grant no. 654410) for ABACUS 3.
Up to 2016, a total of eight repeated transects were completed between the island of Mallorca and the Algerian coast. In 2014 and 2015, after the completion of the defined transects, the glider track was changed in order to sample specific mesoscale structures in the study area (Fig. 2).
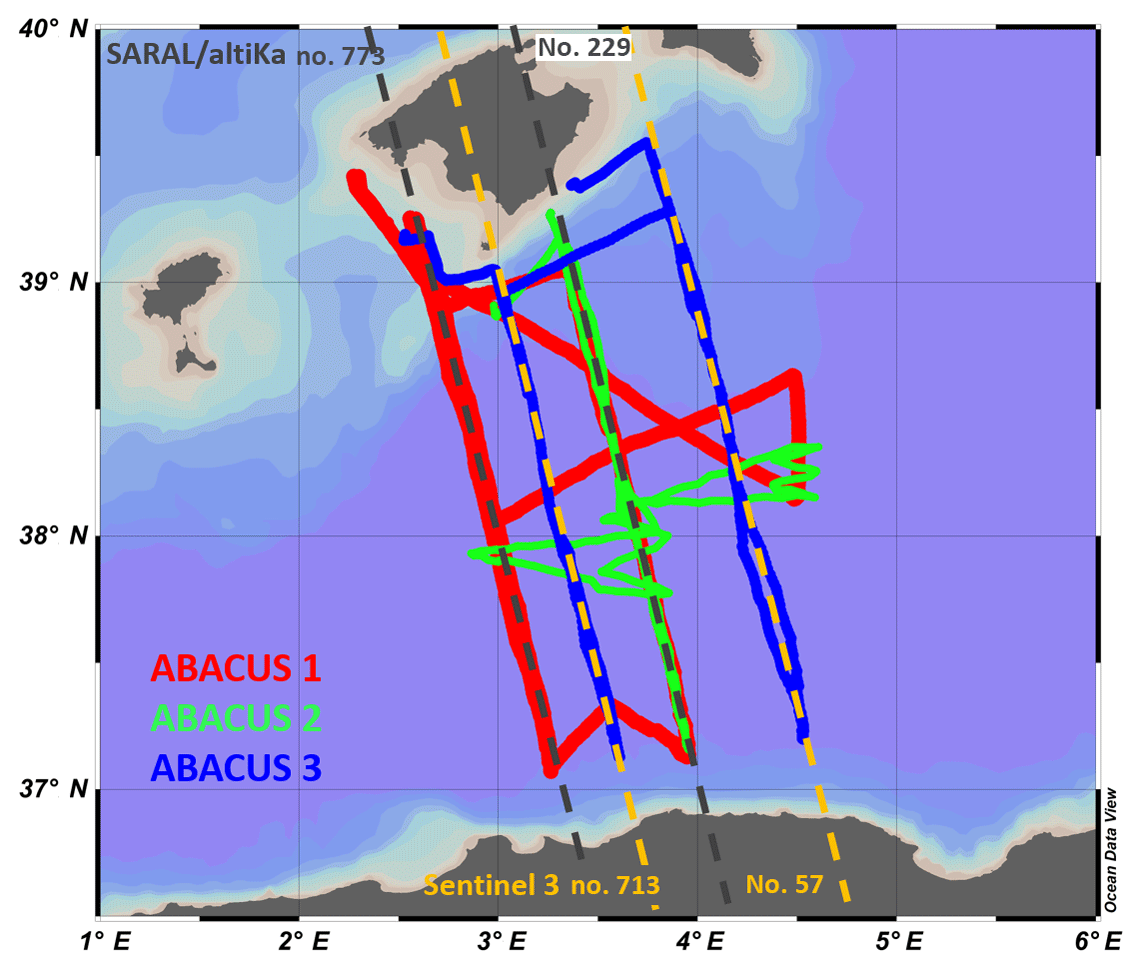
Figure 2Glider tracks during the missions: ABACUS 1 (red dots), ABACUS 2 (green dots) and ABACUS 3 (blue dots). The deviations from the monitoring line were undertaken to sample some mesoscale structures identified through near-real-time satellite altimetry and SST maps. The ground tracks of the SARAL/AltiKa (grey dashed lines) and Sentinel-3 (yellow dashed lines) satellites over the study area are also shown.
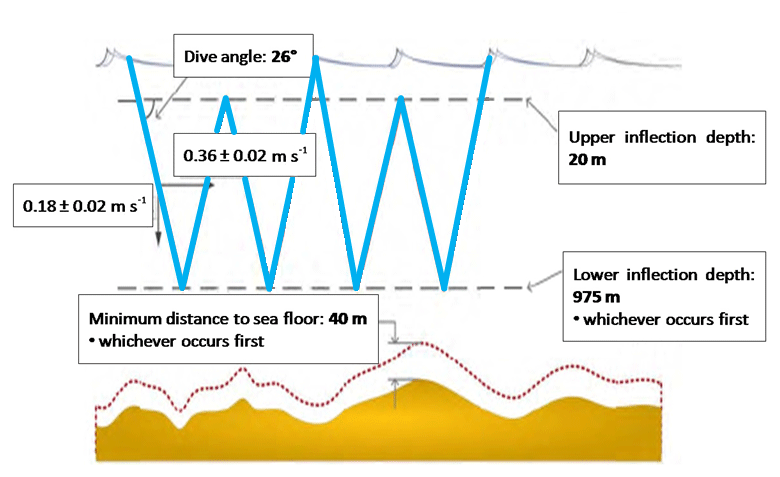
Figure 3Glider navigation scheme during the ABACUS missions. The upper inflection depth was changed after the ABACUS 1 mission in order to allow the glider to reach the surface more frequently.
During these cruises ABACUS gliders collected temperature, salinity, turbidity, oxygen and chlorophyll (Chl a) concentration data in the first 975 m of the water column. Each mission had an average duration of about 40 days and was always performed between September and December. In situ data collection was supported by remotely sensed data from different platforms over the Western Mediterranean Sea. In particular, gridded altimetry data provided by the Archiving, Validation and Interpretation of Satellite Oceanographic data (AVISO), sea surface temperature (SST) and Chl a concentration information from MODerate resolution Imaging Spectroradiometer (MODIS) data acquired by NASA were used to provide a large-scale description of the dynamics and surface water masses. ABACUS field activities were performed in collaboration with SOCIB and the Mediterranean Institute for Advanced Studies (IMEDEA) using a SLOCUM G2 glider for deep water (975 m maximum sampling depth) with a vertical speed of 0.18±0.02 m s−1, resulting in a horizontal velocity of about 0.36 m s−1. During all missions, the general data acquisition design was set to dive with a descending angle of 26∘ between 20 m and maximum depth (Fig. 3) with limited presence and sampling in the layer of 0–20 m depth. In particular, during the 2014 mission, data collection in the surface (0–20 m depth) was limited at every third ascending profile, resulting in a sampling spatial resolution of 8.4 km for depths shallower than 20 m. In 2015 we collected a complete cast from surface to bottom at about 5 km resolution, as a result of the increased general resolution of the glider sampling, which was now performed during both upcast and downcast. Finally, in 2016 we tested the glider possibility to sample the entire water column from 0 to 975 m depth at the resolution of 2.8 km. This was obtained by sampling during both upcast and downcast and by programming the glider to reach the surface after every cast. The experiment was successful, but limited in time due to battery constraints. For this reason, during ABACUS 3, the layer between 0 and 20 m depth is sampled at a variable resolution between 2.8 and 8 km.
As described, the glider was programmed to reach the surface at different rates and spatial resolution during the three ABACUS missions, and this resulted in a variable resolution of sampling of the very surface layer (0–20 m depth).
Several physical and optical biochemical sensors were carried aboard the glider for measuring the ocean temperature, salinity, oxygen, turbidity and Chl a concentration, at different rates according to depth. In particular, ABACUS gliders were equipped with a glider-customised CTD by Sea-bird Scientific (https://www.seabird.com/moving-platform/glider-payload-ctd-gpctd/family?productCategoryId=54627473789&brParentId=54627473787, last access: 23 January 2019), measuring temperature, salinity (derived from conductivity) and depth, and a two-channel combination fluorometer and turbidity sensor by Wetlabs Instruments (https://www.seabird.com/combination-sensors/eco-flntu/family?productCategoryId=54758054352, last access: 23 January 2019), both of them embedded inside the central hull segment of the glider commonly known as the “science bay”. Additionally, an oxygen optode to measure absolute oxygen concentration and saturation (%) by AADI (https://www.aanderaa.com/productsdetail.php?Oxygen-Optodes-2, last access: 23 January 2019) was externally mounted on the aft, and wet, section of the glider.
The accuracy of the measurements, their vertical resolution and depth range vary according to the specific instrument and measured variable as reported in Table 1.
Temperature, salinity and oxygen data were sampled to full diving depth (0–975 m depth), while the acquisition of the other optical parameters ceased at 300 m depth.
Table 1Sampling rate and vertical resolution of ABACUS gliders' data (adapted from Cotroneo et al., 2016; Aulicino et al., 2018).
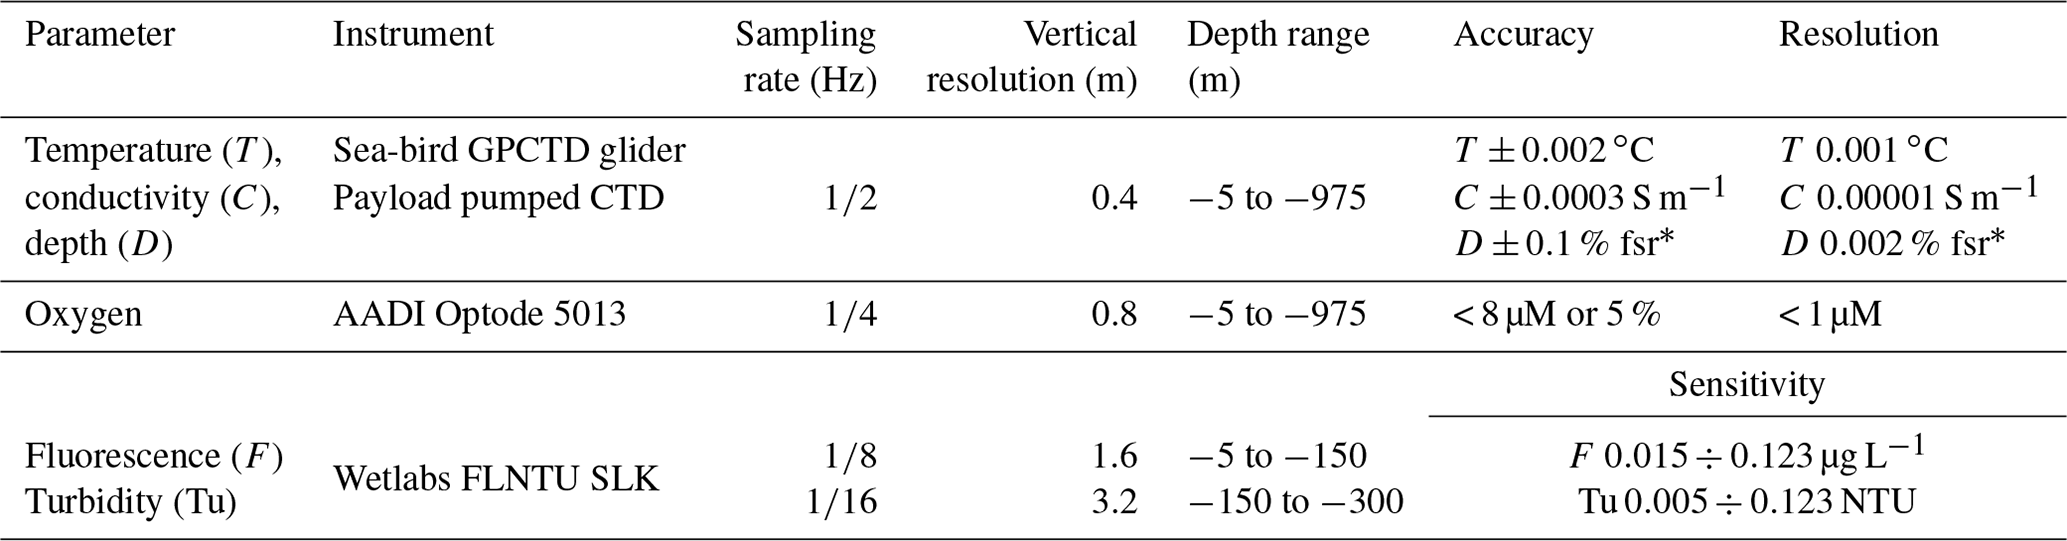
* full-scale range
A specific sampling rate was defined for each instrument (Table 1). Physical parameters (temperature and salinity) were sampled at 1∕2 Hz, resulting in a vertical resolution of 0.4 m along the water column. Oxygen concentration was acquired at 1∕4 Hz (vertical resolution 0.8 m) whilst turbidity and chlorophyll were sampled at 1∕8 Hz down to 150 m depth and at 1∕16 Hz from that level down to 300 m depth, with a vertical resolution of 1.6 and 3.2 m respectively.
Calibration processes and regular maintenance were carried out before and after every glider mission and guarantee the quality of the measurements. While temperature and salinity sensors were regularly calibrated, unfortunately the optical sensors used during the ABACUS missions were not calibrated before the cruises. This results in the impossibility of using the derived variable values as absolute values. Nonetheless, gradients along space, depth and time can successfully be observed and discussed.
Generally, real-time data transmission from the glider can be adaptively configured before and during the mission. For the ABACUS missions, it was set to occur at about every 6 h, in correspondence with every second upcast for most of the glider transects. Real-time data (with a file size ranging between 20 and 90 Kb) were transmitted using Iridium satellite link and contained a subset of all measurements, populated taking one out of every three samples for each parameter. This strategy permitted the retrieval of a first overview of the data collected, as well as the eventual transmission of new sampling and navigation directives to the glider. The full resolution dataset remained stored locally inside the glider until the vehicle was physically brought back to SOCIB facilities once the mission was completed. Then, data were transferred to the SOCIB Data Centre, where pre-processing, processing and validation were carried out and NetCDF files created.
The structure and content of the ABACUS NetCDF file are described in Sect. 3.
The pre-mission activities were carried out at the SOCIB glider facility (Tintoré et al., 2013) and included all ballasting, pressure tests, compass validation and adjustment operations needed to assure the glider capability to reach the surface. This capability is achieved by adjusting the overall weight of the vehicle and by distributing part of that weight so that inclination and roll are neutral when the glider sets its mechanical actuators (pump, mass shifter, air bladder and fin) in neutral mode (0 cc, 0 in., no inflation and 0 rad respectively). This tuning is driven by the hydrographical characteristics of the target waters to be navigated, i.e. their minimum density, since they condition the execution of the operations mentioned. Within this scope, the climatological maximum value of temperature and the minimum value of salinity for the studied area and period have been analysed. These data were used as extreme hydrographic characteristics of the target waters and allowed us to derive the minimum density (1024.0683 kg m−3) needed to precisely tune the glider for the target waters. This tune-up is required in order to make sure that the vehicle will always be able to break into the surface and to raise its tail above the water to enable clear and robust communications.
As regards compass, Merckelbach et al. (2008) developed a method to assess the glider compass error in SLOCUM gliders. This approach has been followed for gliders used during the later ABACUS experiments. The methodology should take place at any location away from sources of hard or soft electromagnetic material (e.g. sport ground); thus it was performed in a forest clearing to minimise electromagnetic interference effects. Using a wooden platform, the glider was placed horizontally and a plastic-made compass stand aligned with true north was used, allowing precise and repetitive heading gradients of 15∘. The measurement error was then estimated by calculating the difference between the heading measured by the glider and the heading that was physically imposed using the stand. A maximum error of less than 10∘ was observed during the three tests so that compass recalibration was not considered necessary.
All these operations were performed on the two SLOCUM glider used during the ABACUS missions (SLDEEP001 for 2014 and 2016; SLDEEP000 for 2015) as part of the pre-mission tests and contributed to the assessment of the quality of the data collected.
The glider tracks were designed to cross the basin from the island of Mallorca (Spain) to about 37 km off the Algerian coast (Fig. 2). The timing of the missions was accurately planned in order to provide synoptic in situ data with respect to the satellite SARAL/ALtiKa and Sentinel-3A passages, being also comparable among the different ABACUS missions (Aulicino et al., 2018).
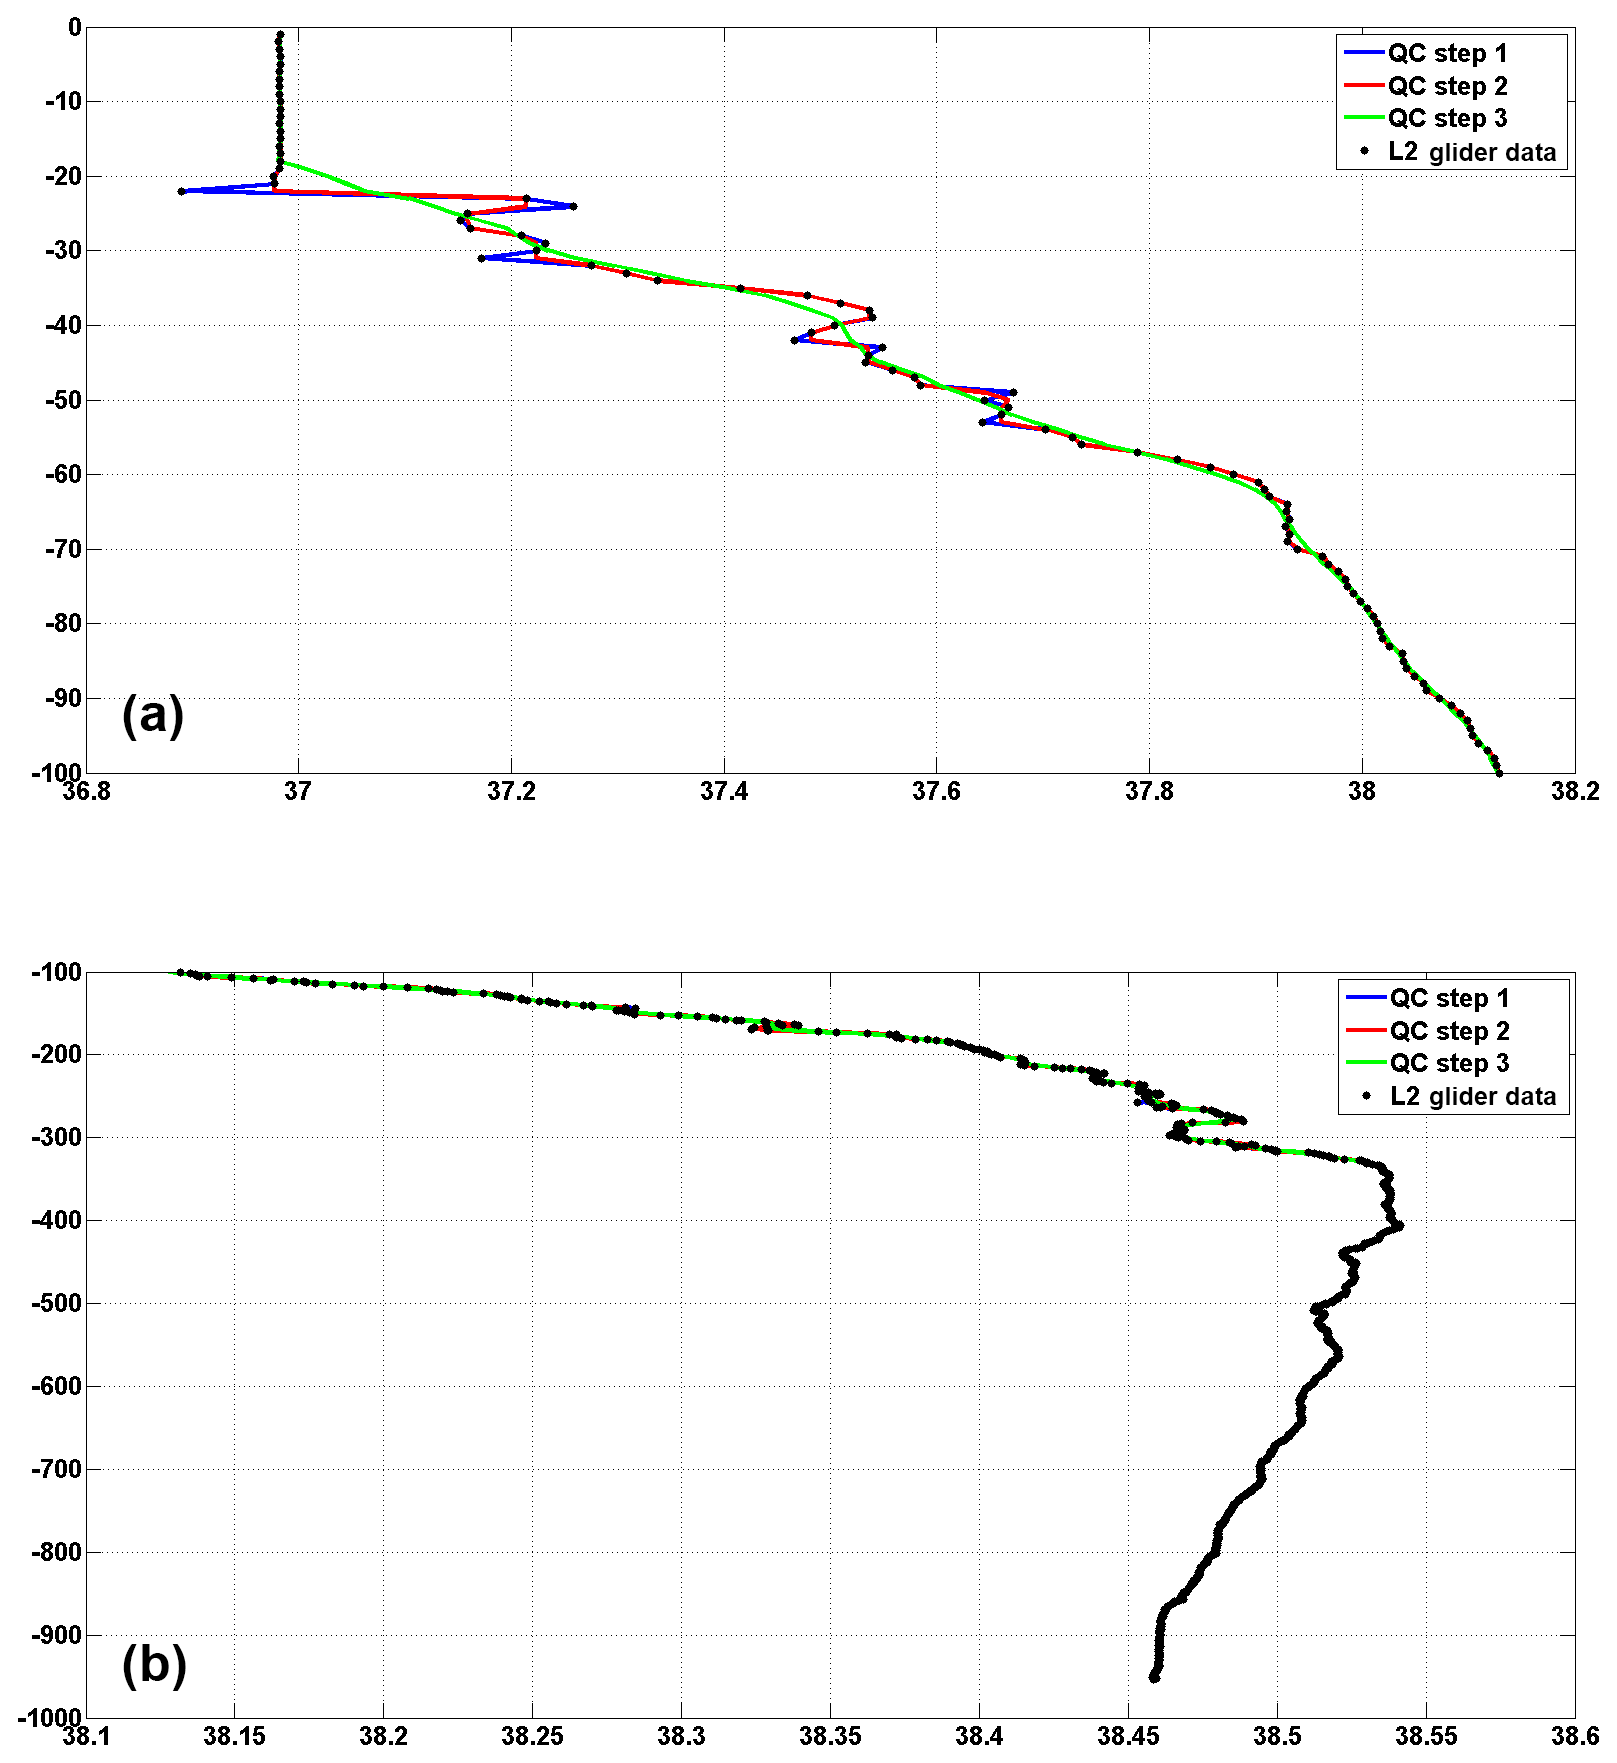
Figure 4Effect of the additional quality control used to generate level 3 data. An example is shown for a salinity profile of the ABACUS 1 mission. The surface layer is shown in (a) (0–100 m depth), while the intermediate and deep water layers are shown in (b) (from 100 to 975 m depth). Black dots represent the original level 2 data after the standard quality control procedures, the blue line shows the single missing data interpolation, the median filter effect is shown by the red line and finally the green line represents the effect of the five-point running mean on the data.
In 2014, during the ABACUS 1 mission, three glider transects were completed along the neighbouring SARAL/AltiKa ground tracks 229 and 773 from 15 September to 19 December 2014. The satellite overpassed the glider on 17 September and 26 November 2014 (track 773) and on 12 December 2014 (satellite track 229). During the ABACUS 2 mission, which was carried out from 18 November to 11 December 2015, the glider was overflown by the SARAL/AltiKa satellite on 23 October, along the ground track 229 with the glider halfway along the transect. In fact, analysis of the data collected during the 2014 mission highlighted the need of a higher degree of synopticity between the glider and satellite data. A specific deployment plan was then designed for the following ABACUS missions in order to have the glider approximately in the middle of the transect during the satellite passages. The improvements obtained in synopticity are extensively discussed in Cotroneo et al. (2016) and Aulicino et al. (2018).
During October 2014, a deviation from the planned sampling track was conducted in order to investigate the presence of a mesoscale eddy and to sample it (see red butterfly-shaped track in Fig. 2). The presence of the eddy was first identified on the basis of near-real-time satellite altimetry and SST, then the glider track was modified during one of the glider surface communication periods. The adaptive sampling capabilities of the glider were then successfully used to perform two full-depth transects across the mesoscale eddy (Cotroneo et al., 2016). After that, the scheduled ABACUS sampling track was restarted. The same strategy was applied in 2015 when the glider deviated twice from the planned track to monitor the edge of a possible mesoscale eddy (saw-toothed green track in Fig. 2).
Finally, the ABACUS 3 mission took place from 4 November to 23 December 2016, and two new glider transects were performed along the Sentinel-3A ground tracks 57 and 713, the latter being located between the SARAL/AltiKa ground tracks 229 and 773 (see Fig. 2). During this mission the glider was overflown on 12 November 2016 (track 57) and 5 December 2016 (track 713). All the details about dates of the missions and main water masses identified are reported in Table 2.
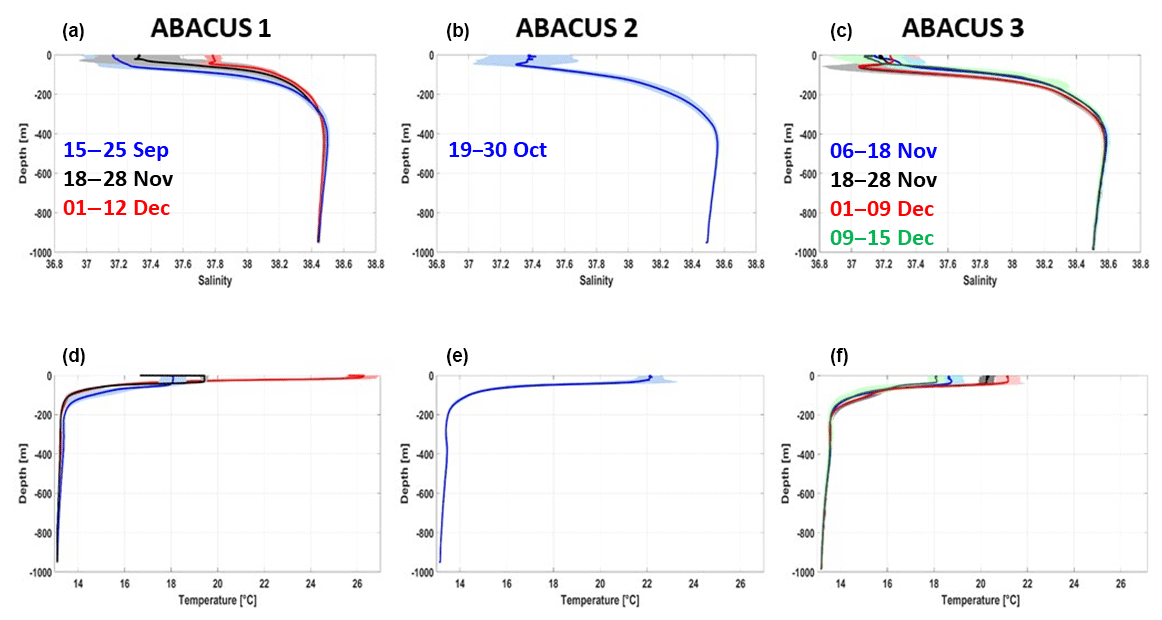
Figure 5Mean salinity (a–c) and temperature (d–f) profiles (thick lines) for each ABACUS transect. From left to right, ABACUS 1, ABACUS 2 and ABACUS 3 data are represented. For each mission, the first available mean profile is shown in blue, the second in black, the third in red and the fourth in green. The shaded area represents the standard deviation calculated at each depth for each mean profile.
Resolution of sampling was defined according to the energetic constraints of the platform and to the scientific aims of the missions, which required a high resolution in both horizontal and vertical directions to monitor large-scale as well as mesoscale processes. During the ABACUS 1 mission, the glider was programmed to sample only during downcasts with a final along-track resolution of almost 4 km once the oblique profiles are projected into the vertical. As a result of the first data analysis, the sampling plan for the following missions was modified. During ABACUS 2 (2015) and ABACUS 3 (2016) cruises, both downcasts' and upcasts' data were collected, thus obtaining an improved spatial along-track resolution of about 2 km, while diving angle and speed remained unchanged. Apart from increasing horizontal sampling resolution, this new strategy also has an effect on data quality, enabling the application of the thermal lag correction developed by Garau et al. (2011), which requires consecutive up and down profiles of temperature and salinity.
After each mission, data were transferred from the internal glider memory to the SOCIB Data Centre, where data processing was carried out and production of delayed time NetCDF files at different elaboration levels (i.e. level 0, level 1, level 2) occurred (Troupin et al., 2016; Cusi et al., 2013) before web dissemination of the data.

Figure 6Θ–S diagram comparing historical oceanographic observations from 1909 to 2011 (black dots) to ABACUS data (red dots). The associated map shows the spatial distribution of the data.
Each NetCDF file comprises the main cruise information, data and a short abstract. Level 0 contains the raw data collected by the glider without any elaboration or correction and organised in vectors. Level 1 includes data regularised, corrected and/or derived from raw glider data. Each variable is stored as sequences of measurements along the glider trajectory, with interpolated position coordinates to match the times of measurement by the sensor, and with unit conversions and filters applied. Each variable is described and commented on individually. The level 2 dataset includes the regularly sampled vertical profiles generated from depth binning of (level 1) glider data that have already processed. The profiles are obtained by interpolation of level 1 data to produce regular homogeneous and instantaneous profiles from each up- or downcast, using the mean time and position of the corresponding cast for the profile location and time. In this level, each variable is stored in a matrix. Depth increases with the number of rows, with each row corresponding to 1 m depth, while time, and consequently the number of profiles, changes along the columns.
Delayed mode data processing for level 1 and 2 included thermal lag correction, filtering and 1 m bin vertical averaging (Troupin et al., 2016). In particular, in level 1 and 2, filters are mainly focused on the processing of pressure data through a low pass filter and on the interpolation of missing values. Nevertheless, some unexpected high oxygen concentration and high salinity values, as well as abrupt temperature value changes, were still present in the surface layer after this standard quality control protocol. The presence of these unexpected values at the shallower turning depth of the glider supports the hypothesis of a possible effect of glider navigation phase change on the sampling capability.
For this reason, during the 2015 and 2016 missions, the glider was programmed to reach the surface after every profile in order to avoid this issue, improve the data collection in the very surface layer (depth < 20 m) and provide a more suitable dataset for the comparison with satellite data.
Nevertheless, an additional quality control procedure was developed and regularly performed at the Parthenope University of Naples on all ABACUS data. In particular, this procedure includes an additional single-point spike control, the interpolation of single missing data along the profiles, the application of a dedicated median filter, a five-point running mean along the depth and, finally, an iterative comparison between adjacent profiles. This tool allowed us to identify and discard bad data and artefacts that were still present after the standard quality control. This final product is indicated as level 3 of the ABACUS dataset. An example of the level 3 elaboration steps is given in Fig. 4. This additional procedure was routinely adopted for the quality control of all ABACUS glider missions for each geophysical parameter.
All dataset elaboration levels from 0 to 2 are available at https://doi.org/10.25704/b200-3vf5, while level 3 data are freely available upon direct request to the authors. Data samples presented in this paper are obtained from level 3 data.

Figure 7Θ–S diagram comparing historical oceanographic observations (black dots) during the autumn season (September–December from 1909 to 2011) to ABACUS data (red dots). The associated map shows the spatial distribution of the data.
Figure 5 shows the mean temperature and salinity profile calculated for each transect completed during the ABACUS cruises from 2014 to 2016. For each mission, a mean profile was calculated using data of a single Mallorca–Algerian coast (or vice versa) transect. In this figure, the first available mean profile for each mission is shown in blue, the second in black, the third in red and the fourth in green. Standard deviation along depth during each transect was also computed for both temperature and salinity (shaded areas in Fig. 5).
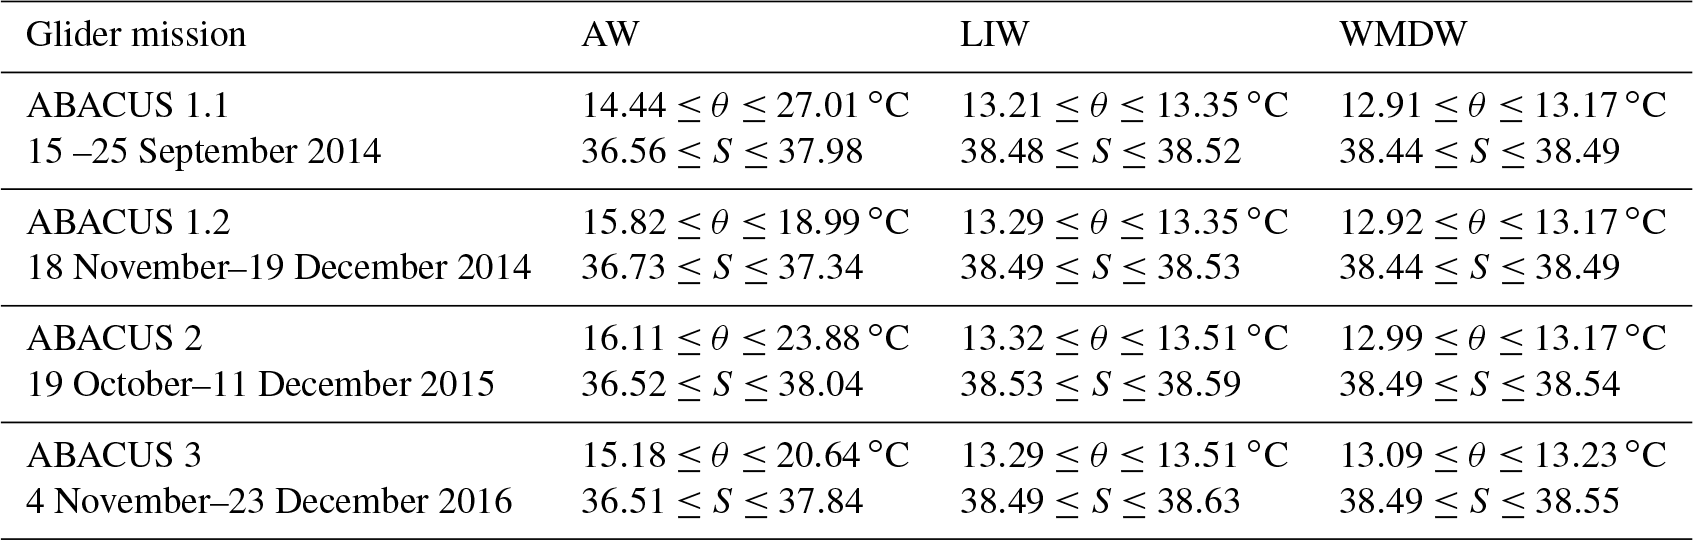
Table 2Temperature and salinity range values measured for Atlantic Water (AW), Levantine Intermediate Water (LIW) and Western Mediterranean Deep Water (WMDW) during ABACUS 1, ABACUS 2 and ABACUS 3 missions.
The ABACUS profiles are characterised by a high level of variability in the surface layer that considerably decreases in the intermediate and deeper layers, in agreement with existing literature in the area (Manca et al., 2004; Fusco et al., 2008). Salinity mean standard deviation values calculated over the entire water column for each available transect range between 0.01 (ABACUS second transect) and 0.04 (ABACUS 1 first and 3rd transect; ABACUS 2; ABACUS 3 from second to fourth transect. Mean standard deviation values, calculated for the temperature, range between 0.05 ∘C (ABACUS 2) and 0.15 ∘C (ABACUS 3 first, third and fourth transect). Higher standard deviation values (up to 0.43 for salinity and 7.3 ∘C for temperature in the surface layer of ABACUS 1 first transect and ABACUS 2 respectively) are found when single depths are considered.
These values are generally larger than the precision of the glider sensors previously described (Table 1). This supports the assumption that glider measurements are accurate enough to represent the variability of the basin. Ship-based CTD profiles collected at the same time and location of the ABACUS casts and corrected to bottle samples could provide material for an interesting comparison between glider and CTD probe data, but unfortunately, no ship-based CTD data were collected in correspondence with the ABACUS missions up to 2016.
In order to test the reliability of ABACUS dataset, a comparison was performed between glider data and a set of historical oceanographic measurements collected in the study area. In particular, a composite dataset including temperature and salinity data along the water column was created, merging data from the MEDAR/MEDATLAS II project (MEDAR Group, 2002), from the Coriolis CORA-3.4 Dataset (Cabanes et al., 2013) and from the World Ocean Hydrographic Profiles (WOHP) V1.0 database, in agreement with Viktor Gouretski). The resulting dataset, consisting of about 2450 profiles, spans from 1909 to 2011 with a regular distribution of the data across the different seasons. After the application of standard quality control procedures, including spike removal and the comparison among nearby profiles, the calculation of potential temperature (Θ) was carried out and the Θ–S couples from this dataset and the ABACUS observations were compared.
Figure 6 shows the comparison between ABACUS Θ–S data and all the available observations in the study area. The ABACUS dataset consists of 2415 profiles with the same data distribution as the historical data and no outliers in the surface or deep layers. These results confirm that glider ABACUS data captured, and correctly describe, the main thermohaline properties of the AB water masses and their variability.

Figure 8Surface layer (0–300 m depth) along-track sections of potential temperature (a), salinity (b) and oxygen concentration (c) obtained from ABACUS 3 glider data. Black triangles indicate the position of the single glider profiles.
In order to perform an additional and more accurate test of the data reliability, we selected the data collected during the autumn season (September–December) from the merged historical dataset. This subset, consisting of 400 profiles, was then used for a second comparison with the ABACUS data. Results are shown in the Θ–S diagram in Fig. 7. Again, the ABACUS data successfully represent the hydrographic variability of the area, even when analysing data from a selected season. Furthermore, the reduced number of historical data in the autumn season and their sparse distribution are a clear indication of the relative importance of the ABACUS dataset for studying the AB.
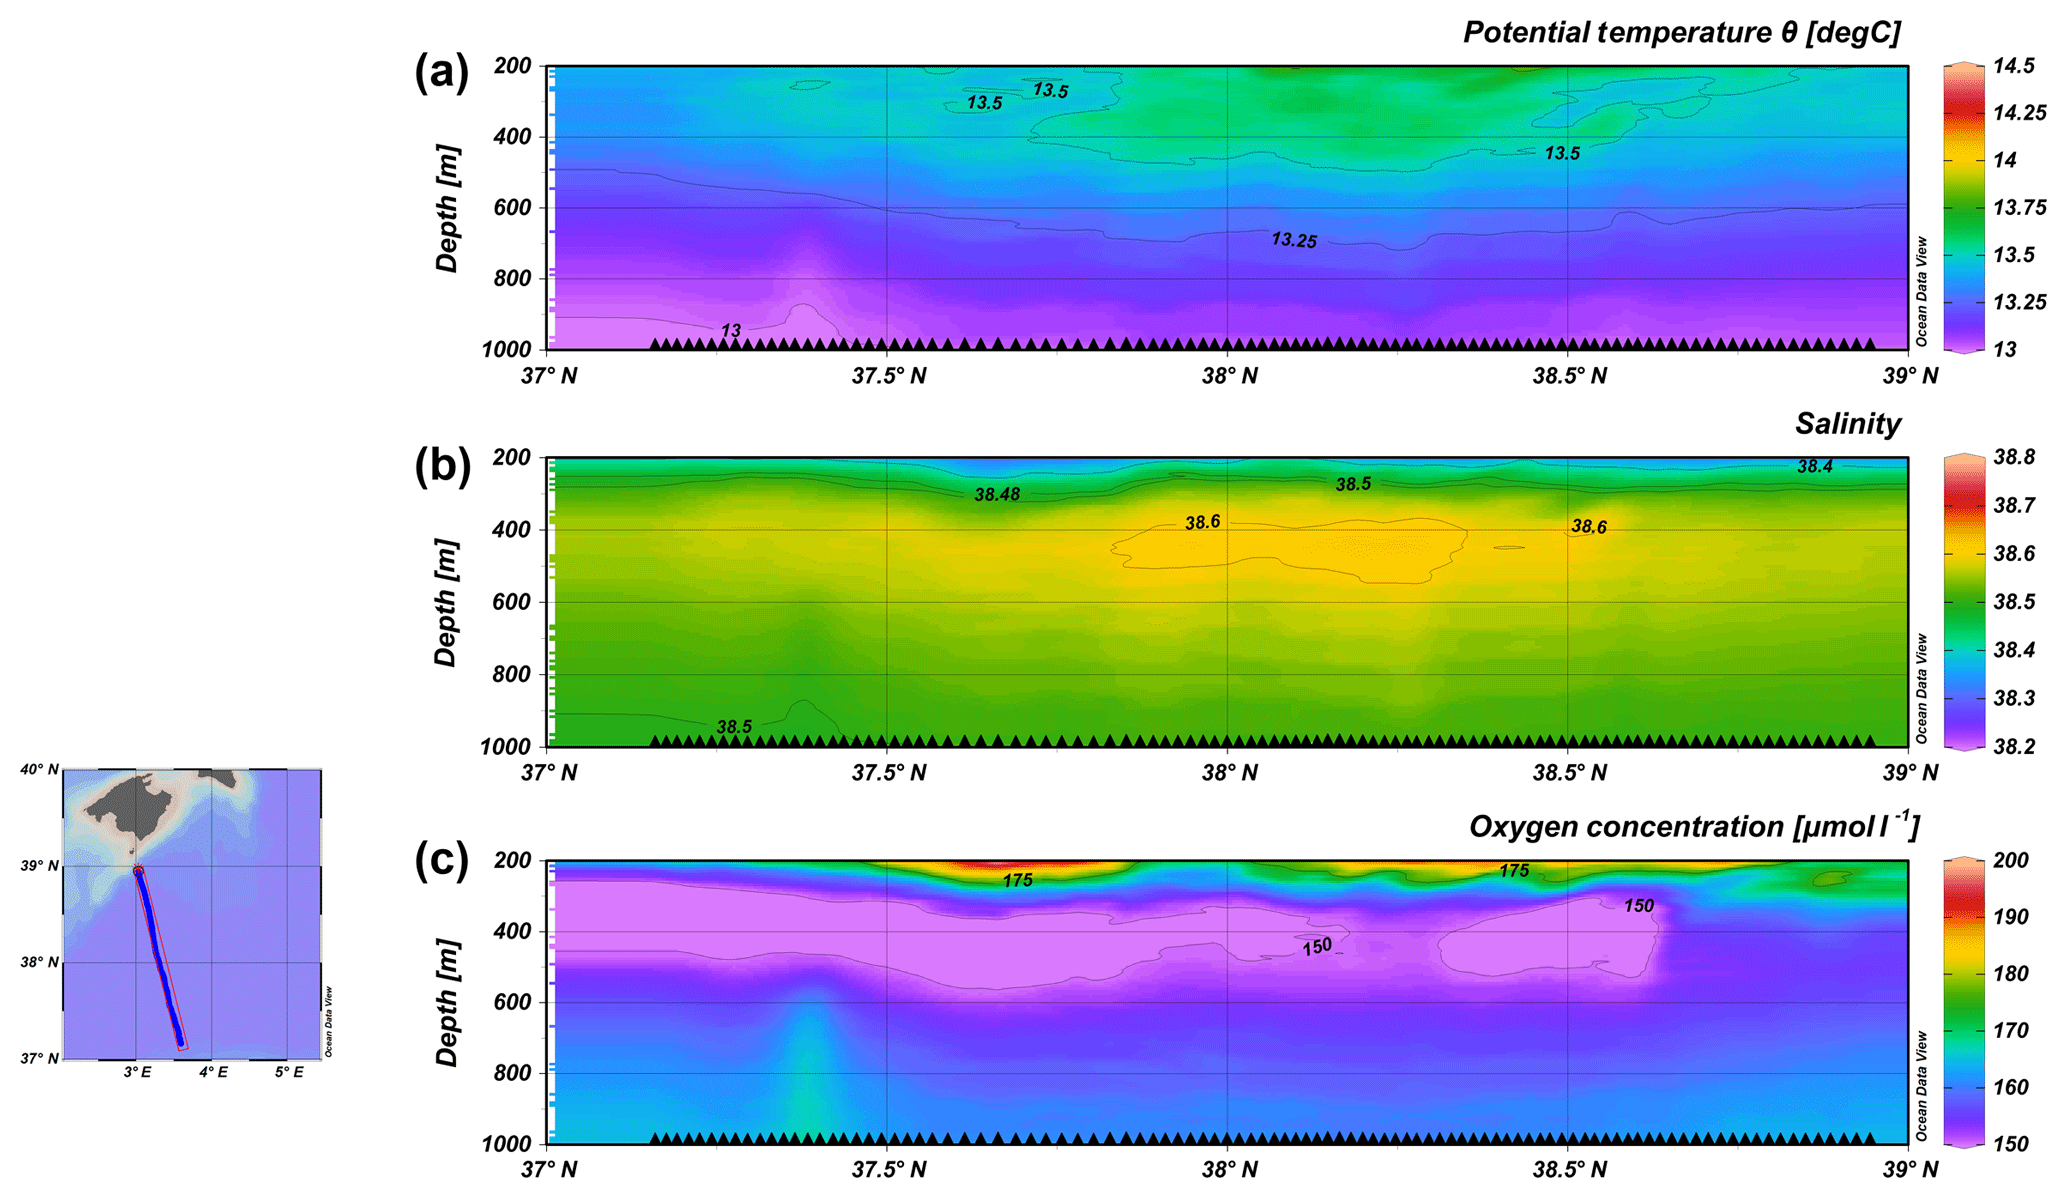
Figure 9Intermediate and deep layer (200–975 m depth) along-track sections of potential temperature (a), salinity (b) and oxygen concentration (c) obtained from ABACUS 3 glider data. Black triangles indicate the position of the single glider profiles.
Several typical Mediterranean water masses have been identified in the θ–S diagrams derived from the glider mounted CTD during the three ABACUS missions at sea. A summary overview is provided in Table 2. The surface layer (0 to 50 m depth) was characterised by AW whose properties vary greatly according to different stages of mixing, precise geographical position and residence time in the Mediterranean Sea. Potential temperature, for example, ranges between 14.4 and 27.0 ∘C, with colder waters always identified in the southern part of the AB. More mixed and modified waters are present in its northern sector due to the influence of Balearic waters (Cotroneo et al., 2016). As expected, the effect of seasonal cooling can be detected too; in fact, December missions present lower mean surface water temperatures (below 19 ∘C).
As for salinity, its values in the surface layer range between 36.51 and 38.04, with higher values measured next to the Mallorca Channel, characterised by a shallow bottom and easier intrusion of saltier waters (Aulicino et al., 2018).
The intermediate layers were typically constituted of LIW, characterised by a potential temperature generally lower than 13.5 ∘C, a salinity of about 38.5 and a low oxygen concentration (see example in Fig. 8c). Its presence was mostly identified between 300 and 550 m depth.
The deepest observed layers (between 700 and 975 m depth) were usually characterised by the presence of WMDW, with typical θ values ranging between 12.9 and 13.2 ∘C and salinity ranging between 38.44 and 38.49. These waters were saltier (about 0.05) during autumn 2015 and 2016 than in the 2014 glider mission.
The main properties of the water masses, as well as their spatial and vertical variability and distribution, can be successfully observed through the analysis of vertical transects.
Figures 8 and 9 show the vertical along-track sections of temperature, salinity, oxygen concentration, Chl a concentration and turbidity collected along the most recent transect of the ABACUS project. This north–south transect was completed during ABACUS 3, from 1 to 9 December 2016, along the Sentinel-3 ground track number 713.
Temperature and salinity data collected in the surface layer (Fig. 8a, b) show a clear signature of the AC presence. Lower temperatures and salinities are recorded in the southern part of the transect, highlighting the presence of AW recently entering the Mediterranean Sea. On the other hand, the northern part of the transect is characterised by more saline and warm waters with typical Mediterranean properties. Oxygen concentration in the surface layer presents the expected distribution, without any significant latitude pattern (Fig. 8c).
The north–south pattern is again evident in the Chl a concentration section (Fig. 8d). An increase in the chlorophyll signal is recorded in correspondence with the AC system at 50 m depth and, with lower intensity, at the northern edge of the transect where terrestrial nutrient input from the island of Mallorca may be more important.
The Chl a concentration increase in the southern part of the transect shows the presence of a lower concentration area at about 37.3∘ N. This signal may be associated with meanders or filaments of the AC that deviate from the eastward pattern of the current and impact on the biological properties of the water masses.
The same signal can also be identified in the temperature and salinity sections, even if with reduced intensity. The deeper layers (from 200 to 975 m depth) are mainly characterised by the presence of the LIW. The relatively low oxygen concentration values and increased salinity signals recorded between 300 and 500 m depth along most of the transect are a clear signature of the LIW presence (Fig. 9).
The 800–975 m depth layer also shows the presence of a small-scale structure at about 37.3∘ N.
In this layer, a lower temperature and salinity signal associated with increased oxygen concentration can be found from 600 to 975 m depth. This structure may be associated with the signals observed in the surface layer and surely deserves further investigation. All these data confirm the glider's ability to describe the main water mass properties at all scales from the basin scale to the mesoscale and capture small-scale structure along the water column and the investigated track. An example of mesoscale variability analysed through ABACUS 1 glider data can be found in Cotroneo et al. (2016), which presents the vertical sections of multiparametric observations collected across a mesoscale eddy.
ABACUS glider data from 2014 to 2016 are available to the public in NetCDF format through an unrestricted repository at https://doi.org/10.25704/b200-3vf5 (Budillon et al., 2018). A set of NetCDF files for data from level 0 to level 2 is created for each glider deployment.
The SOCIB Data Centre hosts the data repository and offers a useful interface for data visualisation and download.
The Mediterranean Sea is known to be particularly sensitive to changes in external forcings, thus being one of the most responsive areas to climate change (Schroeder et al., 2017; Gualdi et al., 2013), and its waters have already shown the presence of significant trends, even in the deepest layers (Fusco et al., 2008; Budillon et al., 2009). In this framework, the ABACUS dataset provides about 2400 complete casts along the water column down to 975 m depth across the Algerian Basin, one of the key areas of the western Mediterranean where monitoring programmes should be improved and intensified.
In particular, here we present data collected during a series of glider missions carried out from 2014 to 2016 in the framework of the ABACUS project. This effort allowed the collection of a large dataset of physical (temperature and salinity) and biochemical (oxygen concentration, turbidity and chlorophyll concentration) high-resolution in situ observations. The reliability of these measurements was tested and assessed through different quality control procedures, as well as through comparisons with available historical datasets.
This dataset is available through an unrestricted repository at https://doi.org/10.25704/b200-3vf5, where NetCDF files including different elaboration levels (from 0 to 2) and documentation are easily accessible. This multiparametric dataset is expected to be particularly beneficial to oceanographic studies focusing on the characterisation of the hydrographic and biochemical structure of the Western Mediterranean at all spatial scales. In fact, the presence of AW (at different modification stages), LIW and WMDW, as well as their interannual variability, can be observed and analysed, as reported by Aulicino et al. (2018). They included part of the presented dataset in their multiplatform analyses, stressing the usefulness of repeated glider monitoring in combination with altimetry and numerical simulations. Still, these observations already proved their contribution to the analyses of the mesoscale and sub-mesoscale processes in the study region (Cotroneo et al., 2016) whose study needs to be based on an appropriate high-resolution in situ dataset in order for these data to possibly be coupled with satellite remote sensing data.
Then, we believe that the ABACUS glider dataset represents a valid unrestricted product which could partially fill the lack of information in the AB, and a valuable tool for improving, together with similar information collected in the framework of other AUV projects, our knowledge about the dynamics of the Western Mediterranean and its physical and biochemical characteristics at different spatial scales.
Moreover, we expect that these data could be used to improve and validate information derived through numerical simulations, as well as to calibrate and validate present and future satellite observations, especially those acquired through radar altimetry.
In a future perspective, cost-efficient repeated glider cruises can then contribute to the creation of a network of endurance lines, monitoring both the short- and long-term variability of the main physical and biochemical parameters of the Mediterranean Sea. At a larger scale, the use of gliders is crucial in the Global Ocean Observing System to fill gaps in transition regions between the open ocean and shelf areas (Liblik et al., 2016) and to increase the array of observations in areas traditionally lacking in situ measurements, such as the southern Mediterranean Sea. The synergy between multiple glider surveys and other data sources, i.e. satellites, models, coastal radars, buoys and drifters, possibly including advisable occasional classical oceanographic cruises, could represent the best strategy to be implemented.
As for the AB, the ABACUS monitoring activities are expected to be repeated and enhanced during the coming years, taking into account the lessons learned through this study. From 2017 we have enlarged the ABACUS network and conducted more glider missions per year in order to monitor both seasonal and interannual variability along the Mallorca–Algerian coast transect.
YC and GA conceived and designed the manuscript. YC, GA, MT and JT collected the measurements and organised the glider missions. YC, GA and GF carried out the quality control analyses and the validation of the measurements against the historical samples. All authors analysed the obtained results, contributed to the writing and approved the final paper.
The authors declare that they have no conflict of interest.
The ABACUS 1 missions (2014) were supported by the Joint European Research Infrastructure network for Coastal Observatories (JERICO) TransNational Access (TNA) third call (grant agreement no. 262584).
The research leading to ABACUS 3 (2016) was supported by the European Union's H2020 Framework Programme (h2020-INFRAIA-2014-2015) (JERICO-NEXT grant agreement no. 654410).
Additional EU funding (PERSEUS grant agreement no. 287600) is acknowledged.
The activities described in this paper were developed in the framework of the Italian Flagship Project RITMARE.
Ananda Pascual wishes to acknowledge support from the PRE-SWOT project (CTM2016-78607-P) funded by the Spanish National Research Program.
The SOCIB Data Server hosts ABACUS data which are available at https://doi.org/10.25704/b200-3vf5.
The authors are particularly grateful to the SOCIB glider facility team and
the Data Centre and Engineering and Technology Deployment staff for their
efficient cooperation.
Edited by: Giuseppe M. R. Manzella
Reviewed by: two anonymous referees
Alvarez, A. and Mourre, B.: Optimum sampling designs for a glider–mooring observing network, J. Atmos. Ocean. Tech., 29, 601–612, 2016.
Aulicino, G., Cotroneo, Y., Lacava, T., Sileo, G., Fusco, G., Carlon, R., Satriano, V., Pergola, N., Tramutoli, V., and Budillon, G.: Results of the first wave glider experiment in the southern Tyrrhenian Sea, Adv. Oceanogr. Limnol., 7, 16–35, https://doi.org/10.4081/aiol.2016.5682, 2016.
Aulicino, G., Cotroneo, Y., Ruiz, S., Sánchez Román, A., Pascual, A., Fusco, G., Tintoré, J., and Budillon, G.: Monitoring the Algerian Basin through glider observations, satellite altimetry and numerical simulations along a SARAL/AltiKa track, J. Mar. Syst., 179, 55–71, https://doi.org/10.1016/j.jmarsys.2017.11.006, 2018.
Bosse, A., Testor, P., Houpert, L., Damien, P., Prieur, L., Hayes, D., Taillandier, V., Durrieude Madron, X., D'Ortenzio, F., Coppola, L., Karstensen, J., and Mortier, L.: Scales and dynamics of submesoscale coherent vortices formed by deep convection in the northwestern Mediterranean Sea, J. Geophys. Res., 121, 7716–7742, https://doi.org/10.1002/2016JC012144, 2016.
Bouffard, J., Pascual, A., Ruiz, S., Faugère, Y., and Tintoré, J.: Coastal and mesoscale dynamics characterization using altimetry and gliders: a case study in the Balearic Sea, J. Geophys. Res., 115, C10029, https://doi.org/10.1029/2009JC006087, 2010.
Budillon, G., Cotroneo, Y., Fusco, G., and Rivaro, P.: Variability of the Mediterranean Deep and Bottom Waters: Some Recent Evidences in the Western Basin, CIESM Workshop Monographs, 2009.
Budillon, G., Cotroneo, Y., Aulicino, G., Fusco, G., Heslop, E., Torner, M., and Tintoré, J.: SOCIB TNA Abacus (Version 1.0), SOCIB, https://doi.org/10.25704/b200-3vf5, 2018.
Cabanes, C., Grouazel, A., von Schuckmann, K., Hamon, M., Turpin, V., Coatanoan, C., Paris, F., Guinehut, S., Boone, C., Ferry, N., de Boyer Montégut, C., Carval, T., Reverdin, G., Pouliquen, S., and Le Traon, P.-Y.: The CORA dataset: validation and diagnostics of in-situ ocean temperature and salinity measurements, Ocean Sci., 9, 1–18, https://doi.org/10.5194/os-9-1-2013, 2013.
Carret, A., Birol, F., Estournel, C., Zakardjian, B., and Testor, P.: Synergy between in situ and altimetry data to observe and study the Northern Current variations (NW Mediterranean Sea), Ocean Sci. Discuss., https://doi.org/10.5194/os-2018-76, in review, 2018.
Cotroneo, Y., Aulicino, G., Ruiz, S., Pascual, A., Budillon, G., Fusco, G., and Tintoré, J.: Glider and satellite high resolution monitoring of a mesoscale eddy in the Algerian basin: Effects on the mixed layer depth and biochemistry, J. Mar. Syst., 162, 73–88, 2016.
Cusi, S., Torner, M., Martinez-Ledesma, M., Roque, D., Beltran, J. P., Ruiz, S., Casas, B., Castilla, C., Lizaran, I., Lora, S., Heslop, E., and Tintoré, J.: On the setup of an operational autonomous underwater glider facility, in: 5th MARTECH, Girona (Spain), 2013.
Davis, R. E., Eriksen, C. C., and Jones, C. P.: Autonomous buoyancy-driven underwater gliders, in: Technology and Applications of Autonomous Underwater Vehicles, edited by: Griffiths, G., Taylor and Francis, London, 2003.
Drinkwater, M. R. and Rebhan, H.: Sentinel-3: Mission Requirements Document, EOPSMO/1151/MD-md, 2007.
Escudier, R., Mourre, B., Juza, M., and Tintoré, J.: Subsurface circulation and mesoscale variability in the Algerian sub-basin from altimeter-derived eddy trajectories, J. Geophys. Res., 121, 6310–6322, https://doi.org/10.1002/2016JC011760, 2016.
Font, J., Isern-Fontanet, J., and Salas, J.: Tracking a big anticyclonic eddy in the westernMediterranean Sea, Sci. Mar., 68, 331–342, 2004.
Fu, L. L. and Ferrari, R.: Observing oceanic submesoscale processes from space, EOSTrans. Am. Geophys. Union, 89, 489–499, https://doi.org/10.1029/2008EO480003, 2008.
Fusco, G., Manzella, G. M. R., Cruzado, A., Gacic, M., Gasparini, G. P., Kovacevic, V., Millot, C., Tziavos, C., Velasquez, Z. R., Walne, A., Zervakis, V., and Zodiatis, G.: Variability of mesoscale features in the Mediterranean Sea from XBT data analysis, Ann. Geophys., 21, 21–32, https://doi.org/10.5194/angeo-21-21-2003, 2003.
Fusco, G., Artale, V., Cotroneo, Y., and Sannino, G.: Thermohaline variability of Mediterranean Water in the Gulf of Cádiz, 1948–1999, Deep-Sea Res. Pt. I, 55, 1624–1638, 2008.
Garau, B., Ruiz, S., Zang, G. W., Heslop, E., Kerfoot, J., Pascual, A., and Tintoré, J.: Thermal lag correction on Slocum CTD glider data, J. Atmos. Ocean. Tech., 28, 1065–1074, 2011.
Gualdi, S., Somot, S., Li, L., Artale, V., Adani, M., Bellucci, A., Braun, A., Calmanti, S., Carillo, A., Dell'Aquilla, A., Déqué, M., Dubois, C., Elizalde, A., Harzallah, A., L'Hévéder, B., May, W., Oddo, P., Ruti, P., Sanna, A., Sannino, G., Sevault, F., Scoccimarro, E., and Navarra, A.: The CIRCE simulations: A new set of regional climate change projections performed with a realistic representation of the Mediterranean Sea, B. Am. Meteor. Soc., 94, 65–81, https://doi.org/10.1175/BAMS-D-11-00136.1, 2013.
Heslop, E. E., Ruiz, S., Allen, J., Lopez-Jurado, J.-L., Renault, L., and Tintore, J.: Autonomous underwater gliders monitoring variability at “choke points” in our ocean system: A case study in the Western Mediterranean Sea, Geophys. Res. Lett., 39, L20604, https://doi.org/10.1029/2012GL053717, 2012.
Heslop, E. E., Sánchez-Román, A., Pascual, A., Rodríguez, D., Reeve, K. A., Faugère, Y., and Raynal, M.: Sentinel-3A views ocean variability more accurately at finer resolution, Geophys. Res. Lett., 44, 12367–12374, https://doi.org/10.1002/2017GL076244, 2017.
Isern-Fontanet, J., Olmedo, E., Turiel, A., Ballabrera-Poy, J., and García-Ladona, E.: Retrieval of eddy dynamics from SMOS sea surface salinity measurements in theAlgerian Basin (Mediterranean Sea), Geophys. Res. Lett., 43, 6427–6434, https://doi.org/10.1002/2016GL069595, 2016.
Jones, C., Creed, E., Glenn, S., Kerfoot, J., Kohut, J., Mudgal, C., and Schofield, O.: Slocum gliders – A component of operational oceanography, in: Proc. 14th Int. Symp. on Unmanned Untethered Submersible Technology, 21–24 August, Lee, NH, Autonomous Undersea Systems, 2005.
Liblik, T., Karstensen, J., Testor, P., Mortier, L., Alenius, P., Ruiz, S., Pouliquen, S., Hayes, D., Mauri, E., and Heywood, K.: Potential for an underwater glider component as part of the Global Ocean Observing System, Meth. Oceanogr., 17, 50–82, 2016.
Manca, B., Burca, M., Giorgetti, A., Coatanoan, C., Garcia, M.-J., and Iona, A.: Physical and biogeochemical averaged vertical profiles in the Mediterranean regions: an important tool to trace the climatology of water masses and to validate incoming data from operational oceanography, J. Mar. Syst., 48, 83–116, 2004.
MEDAR Group: MEDATLAS/2002 database, Mediterranean and Black Sea database of temperature salinity and bio-chemical parameters. Climatological Atlas, IFREMER Edition (4 Cdroms), 2002.
Merckelbach, L. M., Briggs, R. D., Smeed, D. A., and Griffiths, G.: Current measurements from autonomous underwater gliders, in: Proc. IEEE/OES 9th Work, Conf. Current Meas. Technol. (CMTC), March 2008, 61–67, 2008.
Merckelbach, L., Smeed, D., and Griffiths, G.: Vertical Water Velocities from Underwater Gliders, J. Atmos. Ocean. Tech., 27, 547–563, https://doi.org/10.1175/2009JTECHO710.1, 2010.
Millot, C.: Some features of the Algerian current, J. Geophys. Res., 90, 7169–7176, 1985.
Millot, C.: Circulation in the Western Mediterranean Sea, J. Mar. Syst., 20, 423–442, 1999.
Millot, C., Candela, J., Fuda, J. L., and Tber, Y.: Large warming and salinification of the Mediterranean outflow due to changes in its composition, Deep-Sea Res. Pt. I, 53, 655–666, 2006.
Moran, X. A. G., Taupier-Letage, I., Vazquez-Domınguez, E., Ruiz, S., Arın, L., Raimbault, P., and Estarda, M.: Physical-biological coupling in the Algerian basin (SW Mediterranean): influence of mesoscale instabilities on the biomass and production of phytoplankton and bacterioplankton, Deep-Sea Res., 48, 405–437, 2001.
Olita, A., Ribotti, A., Sorgente, R., Fazioli, L., and Perilli, A.: SLA-chlorophyll-a variability and covariability in the Algero-Provençal Basin (1997–2007) through combined use of EOF and wavelet analysis of satellite data, Ocean Dynam. 61, 89–102, 2011.
Olita, A., Capet, A., Mahadevan, A., Claret, A., Poulain, P.-M., Ribotti, Ruiz, S., Tintoré, J., Tovar-Sánchez, A., A., and Pascual, A.: Frontal dynamics boost primary production in the summer stratified Mediterranean Sea, Ocean Dynam., 67, 767–782, https://doi.org/10.1007/s10236-017-1058-z, 2017.
Pascual, A., Bouffard, J., Ruiz, S., Buongiorno Nardelli, B., Vidal-Vijande, E., Escudier, R., Sayol, J. M., and Orfila, A.: Recent improvements in mesoscale characterization of the western Mediterranean Sea: synergy between satellite altimetry and other observational approaches, Sci. Mar., 77, 19–36, https://doi.org/10.3989/scimar.03740.15A, 2013.
Pascual, A., Ruiz, S., Olita, A., Troupin, C., Claret, M., Casas, B., Mourre, B., Poulain, P. M., Tovar-Sanchez, A., Capet, A., Mason, E., Allen, J. T., Mahadevan, A., and Tintoré, J.: A multiplatform experiment to unravel Meso- and submesoscale processes in an intense front (AlborEx), Front. Mar. Sci., 4, 39, https://doi.org/10.3389/fmars.2017.00039, 2017.
Pessini, F., Olita, A., Cotroneo, Y., and Perilli, A.: Mesoscale eddies in the Algerian Basin: do they differ as a function of their formation site?, Ocean Sci., 14, 669–688, https://doi.org/10.5194/os-14-669-2018, 2018.
Robinson, M. and Golnaraghi, A.: Ocean Processes in Climate Dynamics: Global and Mediterranean examples, The physical and dynamical oceanography of the Mediterranean Sea, Kluwer Academic Publishing, Dordrecht, 1994.
Rudnick, D. L.: Ocean research enabled by underwater gliders, Annu. Rev. Mar. Sci., 8, 519–541, https://doi.org/10.1146/annurev-marine-122414-033913, 2016.
Rudnick, D. L. and Cole, S. T.: On sampling the ocean using underwater gliders, J. Geophys. Res., 116, C08010, https://doi.org/10.1029/2010JC006849, 2011.
Rudnick, D. L., Davis, R. E., Eriksen, C. C., Fratantoni, D. M., and Perry, M. J.: Undersea gliders for ocean research, Mar. Technol. Soc. J., 38, 73–84, 2004.
Ruiz, S., Font, J., Emelianov, M., Isern-Fontanet, I., Millot, C., Salas, J., and Taupier-Letage, I.: Deep structure of an open sea eddy in the Algerian Basin, J. Mar. Syst., 33–34, 179–195, 2002.
Ruiz, S., Pascual, A., Garau, B., Pujol, M. I., and Tintoré, J.: Vertical motion in the upper ocean from glider and altimetry data, Geophys. Res. Lett., 36, L14607, https://doi.org/10.1029/2009GL038569, 2009.
Ruiz, S., Renault, L., Garau, B., and Tintoré, J.: Underwater glider observations and modelling of an abrupt mixing event in the upper ocean, Geophys. Res. Lett., 39, https://doi.org/10.1029/2011GL050078, 2012.
Schroeder, K., Chiggiato, J., Josey, S. A., Borghini, M., Aracri, S., and Sparnocchia, S.: Rapid response to climate change in a marginal sea, Sci. Rep., 7, 4065, https://doi.org/10.1038/s41598-017-04455-5, 2017.
Shcherbina, A. Y., Sundermeyer, M. A., Kunze, E., D'Asaro, E., Badin, G., Birch, D., Brunner-Suzuki, A. E., Callies, J., Kuebel Cervantes, B. T., Claret, M., Concannon, B., Early, J., Ferrari, R., Goodman, L., Harcourt, R. R., Klymak, J. M., Lee, C. M., Lelong, M., Levine, M. D., Lien, R., Mahadevan, A., McWilliams, J. C., Molemaker, M. J., Mukherjee, S., Nash, J. D., Özgökmen, T., Pierce, S. D., Ramachandran, S., Samelson, R. M., Sanford, T. B., Shearman, R. K., Skyllingstad, E. D., Smith, K. S., Tandon, A., Taylor, J. R., Terray, E. A., Thomas, L. N., and Ledwell, J. R.: The LatMix Summer Campaign: Submesoscale Stirring in the Upper Ocean, B. Am. Meteor. Soc., 96, 1257–1279, https://doi.org/10.1175/BAMS-D-14-00015.1, 2015.
Taupier-Letage, I., Puillat, I., Raimbault, P., and Millot, C.: Biological response to mesoscale eddies in the Algerian basin, J. Geophys. Res., 108, 3245–3267, 2003.
Testor, P., Send, U., Gascard, J. C., Millot, C., Taupier-Letage, I., and Beranger, K.: The mean circulation of the southwestern Mediterranean Sea: Algerian gyres, J. Geophys. Res., 110, C11017, https://doi.org/10.1029/2004JC002861, 2005.
Thomsen, S., Kanzow, T., Krahmann, G., Greatbatch, R. J., Dengler, M., and Lavik, G.: The formation of a subsurface anticyclonic eddy in the Peru-Chile undercurrent and its impact on the near-coastal salinity, oxygen, and nutrient distributions, J. Geophys. Res.-Oceans, 121, 476–501, https://doi.org/10.1002/2015JC010878, 2016.
Tintoré, J., Gomis, D., Alonso, S., and Parrilla, G.: Mesoscale dynamics and vertical motion in the Alboran Sea, J. Phys. Oceanogr., 21, 811–823, 1991.
Tintoré, J., Vizoso, G., Casas, B., Heslop, E., Pascual, A., Orfila, A., Ruiz, S., Martínez-Ledesma, M., Torner, M., Cusi, S., Diedrich, A., Balaguer, P., Gómez-Pujol, L., Álvarez-Ellacuria, A., Gómara, S., Sebastian, K., Lora, S., Beltrán, J. P., Renault, L., Juza, M., Álvarez, D., March, D., Garau, B., Castilla, C., Cañellas, T., Roque, D., Lizarán, I., Pitarch, S., Carrasco, M. A., Lana, A., Mason, E., Escudier, R., Conti, D., Sayol, J. M., Barceló, B., Alemany, F., Reglero, P., Massuti, E., Vélez-Belchí, P., Ruiz, J., Oguz, T., Gómez, M., Álvarez, E., Ansorena, L., and Manriquez, M.: SOCIB: the Balearic Islands coastal ocean observing and forecasting system responding to science, technology and society needs, Mar. Technol. Soc. J., 47, 101–117, 2013.
Troupin, C., Pascual, A., Ruiz, S., Olita, A., Casas, B., Margirier, F., Poulain, P.-M., Notarstefano, G., Torner, M., Fernández, J. G., Rújula, M. À., Muñoz, C., Allen, J. T., Mahadevan, A., and Tintoré, J.: The AlborEX dataset: sampling of submesoscale features in the Alboran Sea, Earth Syst. Sci. Data Discuss., https://doi.org/10.5194/essd-2018-104, in review, 2018.
Troupin, C., Beltran, J. P., Heslop, E., Torner, M., Garau, B., Allen, J., Ruiz, S., and Tintoré, J.: A toolbox for glider data processing and management, Meth. Oceanogr, 13–14, 13–23, https://doi.org/10.1016/j.mio.2016.01.001, 2016.
Vidal-Vijande, E., Pascual, A., Barnier, B., Molines, J. M., and Tintoré, J.: Analysis of a 44-year hindcast for the Mediterranean Sea: comparison with altimetry and in situ observations, Sci. Mar., 75, 71–86, 2011.
Vignudelli, S., Cipollini, P., Reseghetti, F., Fusco, G., Gasparini, G. P., and Manzella, G. M. R.: Comparison between XBT data and TOPEX/Poseidon satellite altimetry in the Ligurian-Tyrrhenian area, Ann. Geophys., 21, 123–135, https://doi.org/10.5194/angeo-21-123-2003, 2003.
Webb, D. C., Simonetti, P. J., and Jones, C. P.: SLOCUM: an underwater glider propelled by environmental energy, IEEE J Ocean. Eng., 26, 447–452, https://doi.org/10.1109/48.972077, 2001.