the Creative Commons Attribution 4.0 License.
the Creative Commons Attribution 4.0 License.
 | 11 Nov 2019
The BernClim plant phenological data set from the canton of Bern (Switzerland) 1970–2018
This Rutishauser
François Jeanneret
Robert Brügger
Yuri Brugnara
Christian Röthlisberger
August Bernasconi
Peter Bangerter
Céline Portenier
Leonie Villiger
Daria Lehmann
Lukas Meyer
Bruno Messerli
Stefan Brönnimann
In 1970, the Institute of Geography of the University of Bern initiated the phenological observation network BernClim. Seasonality information from plants, fog and snow was originally available for applications in urban and regional planning and agricultural and touristic suitability and is now a valuable data set for climate change impact studies. Covering the growing season, volunteer observers record the dates of key development stages of hazel (Corylus avellana), dandelion (Taraxacum officinale), apple tree (Pyrus malus) and beech (Fagus sylvatica). All observations consist of detailed site information, including location, altitude, exposition (aspect) and inclination, that makes BernClim unique in its richness in detail on decadal timescales. Quality control (QC) by experts and statistical analyses of the data have been performed to flag impossible dates, dates outside the biologically plausible range, repeated dates in the same year, stretches of consecutive identical dates and statistically inconsistent dates (outliers in time or in space). Here, we report BernClim data of 7414 plant phenological observations from 1970 to 2018 from 1304 sites at 110 stations, the QC procedure and selected applications (Rutishauser et al., 2019: https://doi.org/10.1594/PANGAEA.900102). The QC points to very good internal consistency (only 0.2 % were flagged as internally inconsistent) and likely high quality of the data. BernClim data indicate a trend towards an extended growing season. They also track the regime shift in the late 1980s well to pronounced earlier dates like numerous other phenological records across the Northern Hemisphere.


The seasonality of plants has been observed for centuries for tracking and documenting plant agricultural practices (Schnelle, 1955; Demarée and Rutishauser, 2011; Rutishauser, 2009; Pfister and White, 2018; Jeanneret et al., 2018). Systematic documentations started with the famous Kyoto cherry series as early as 801 CE (Aono and Kazui, 2008). Phenological phases indicate growth cycle stages of annual and perennial plant life. The stages are closely linked to environmental drivers such as light, temperature and precipitation and are, thus, used as climate change impact indicators (Menzel et al., 2006; IPCC, 2013) or serve as proxy data in climate reconstructions (Rutishauser et al., 2008; Anderson et al., 2013; Ge et al., 2014). For instance, the inventory of climate monitoring series of the Swiss GCOS Office (MeteoSwiss, 2018) lists phenological records. Peñuelas et al. (2008) stressed the importance of phenological observations for climate feedback processes that can only be studied when ground observational data are available in a reasonable quality (Rutishauser, 2009).
In Switzerland, the longest continuous phenological series reach back to 1808 (horse-chestnut bud burst – Geneva) and 1894 (cherry flowering – Liestal; Defila and Clot, 2001; Defila et al., 2016). In Europe, single observations are documented from the High Middle Ages onwards (Pfister and White, 2018). Systematic collections started in the 18th century, e.g. several decades from 1760 onwards by the Ökonomische Gesellschaft Bern (Pfister, 1999) and from 1869 to 1882 by the forestry department of the canton of Bern (Vassella, 1997). In 1951, the Swiss Phenology Network (SPN) was initiated (Primault et al., 1957; Defila and Clot, 2001; Studer et al., 2005; MeteoSwiss, 2018). Today, SPN comprises 160 stations, distributed across various regions and elevations of Switzerland. Each year, observers record the dates of leaf unfolding (needle appearance), flowering, fruit ripening, leaf colouring and leaf-fall for selected wild plants and crops. These observations cover 26 plant species and 69 phenophases (MeteoSwiss, 2018; Auchmann et al., 2018).
In 1969 and complementing the SPN, the BernClim phenological network was established by the late Bruno Messerli of the Institute of Geography, University of Bern (Messerli et al., 1978; Jeanneret and Rutishauser, 2012). The aim was to provide a scientific basis for complex climate studies and spatial planning, specifically for determining agricultural and touristic suitability and assessing natural hazards. At higher spatial resolution and precision, the BernClim network systematically documented specific coordinates of observation sites, exposition (aspect) and inclination. Observation sites were aggregated to stations.
Quality control and assurance of phenological series have become increasingly important for newly generated data as well as archive observations. In Switzerland, efforts have been undertaken in a recent Swiss GCOS project (Auchmann et al., 2018). Data sets have been compiled for Europe within the Pan European Phenology Project PEP725 (http://www.pep725.eu/, last access:6 November 2019; Menzel et al., 2006) and for the USA (e.g. Rosemartin et al., 2015). In addition, comparative analyses from networks and citizen science projects suggest that different data sources are complementary, depending on the research question. The most recent analyses showed that observations from citizen science projects PhaenoNet and OpenNature complement the data from the professional network SPN quality-wise (Lehmann et al., 2018). Differences can be explained by the extent and uneven distribution of the spatial coverage. Near-real-time visualisations and comparisons can now be combined with archived observations back to 1951.
In this paper we describe the plant phenological observations and quality control efforts of the BernClim data set for phenological and climatological analyses publicly available from PANGAEA (Rutishauser et al., 2019) and from the PEP725 database, which will soon span half a century of data. In Sect. 2, we provide background on the observation network and give an overview of the data. Section 3 describes the results of the quality control. In Sect. 4 we then present selected results and draw conclusions in Sect. 5.
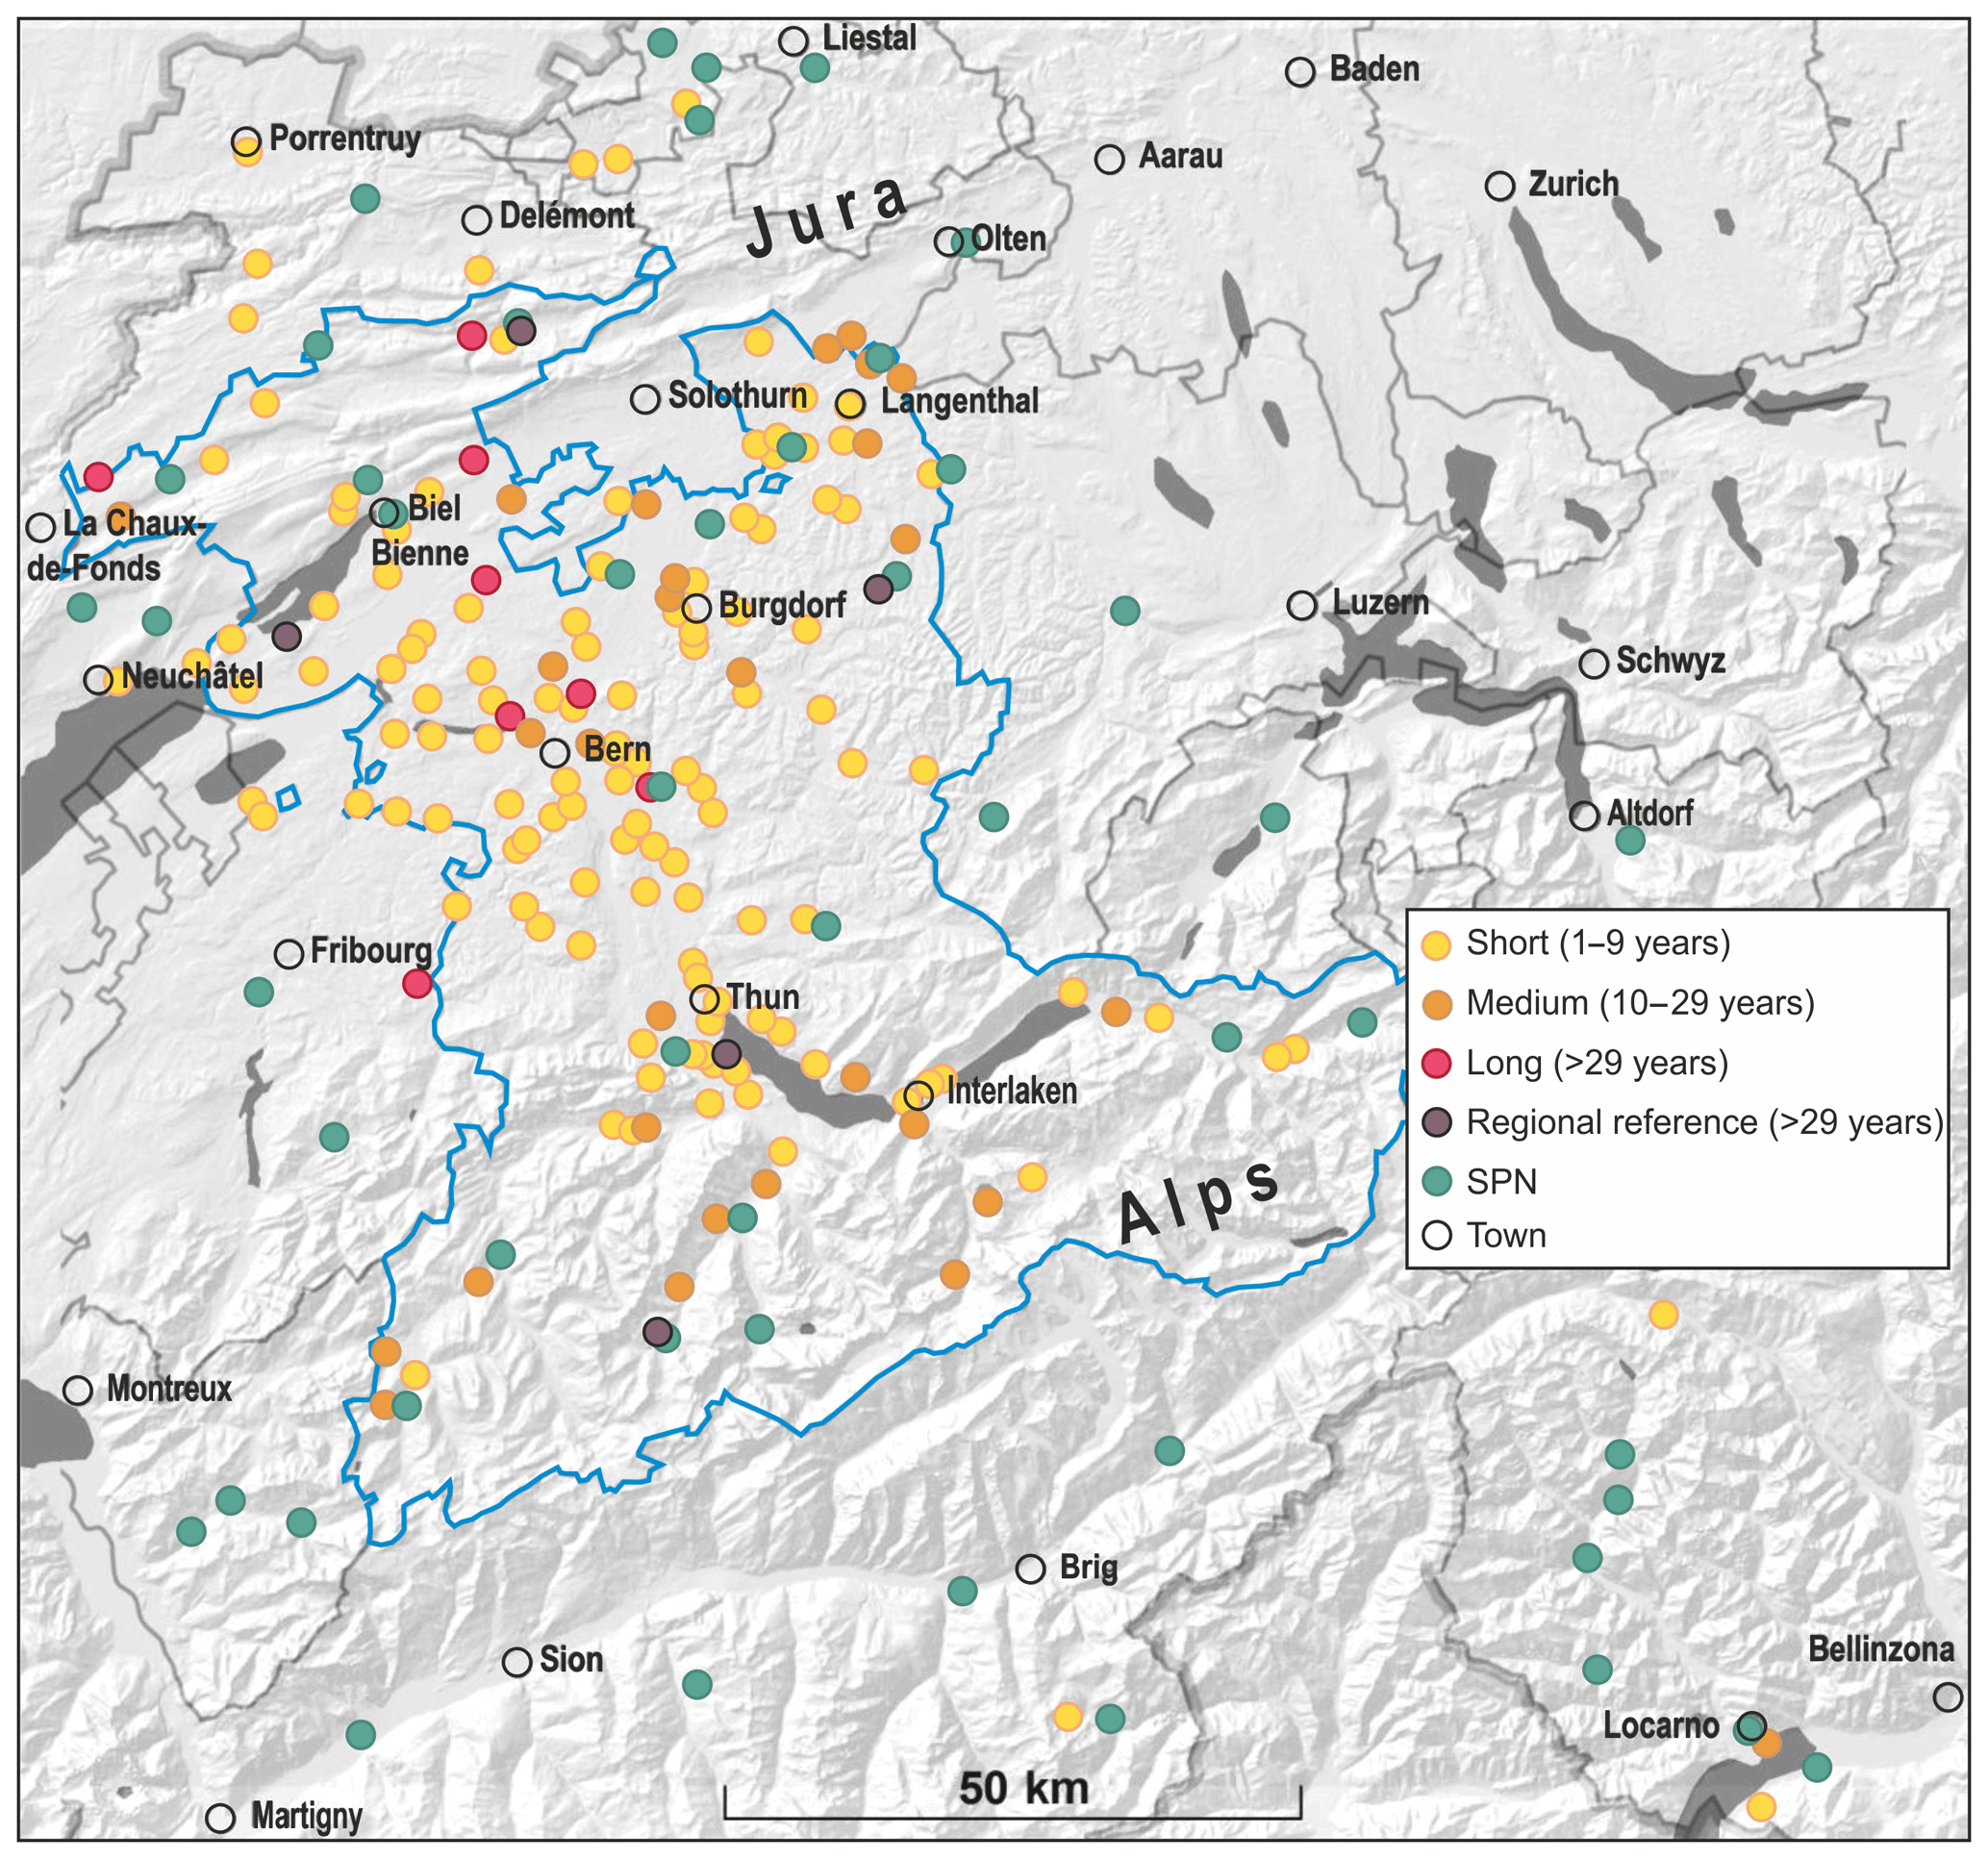
Figure 1Map of the BernClim stations as well as stations of the Swiss Phenological Network (SPN; adapted from Jeanneret and Rutishauser, 2012).
The BernClim observation network focuses on the territory of the canton of Bern (Switzerland; Fig. 1). The canton of Bern stretches across three major Swiss landscapes, from the Jura Mountains across the Swiss Plateau to the Alps, and spans an altitudinal range from 400 to 4000 m a.s.l. The climate in the study region is determined by westerly, northwesterly and southwesterly winds (i.e. from the Atlantic Ocean) and the passage of weather systems. In summer, the Azores High is the dominant pressure system, alternating between westerly and northerly flow situations. Regional wind systems such as the föhn and the Bise may play an important role. Most areas receive an adequate amount of precipitation throughout the year.
BernClim was initiated as a 5-year research project funded by the canton of Bern in 1969 and grew into an ongoing observation programme coordinated by the University of Bern (Messerli et al., 1978; Jeanneret and Rutishauser, 2012). Observations began in 1970. The main observation phase of the project lasted from 1970 to 1974, with the final report compiled by Messerli et al. (1978). A detailed overview, including how observers were located and trained and details on observation guidelines and site selection, is given in Jeanneret and Rutishauser (2012).
Following the success of the first phase, the project was continued with funding from diverse sources. Many observers continued, and the network has been operated ever since by the Institute of Geography of the University of Bern for the last 3 decades as a non-funded activity. Apart from serving as information for spatial planning, the BernClim data have been used in education. While the number of observers has steadily decreased, five have remained to the present day. These long-term series are today also a valuable source of information for science, particularly as there were only few observer changes throughout the network.
To cover all four seasons, observation periods were divided into growing and resting periods. Plant phenology from early spring to late autumn documents summers. During winter, fog presence and duration and snow cover were observed daily from late autumn to early spring (Table 1).
Table 1Complete BernClim observation programme. General flowering (also defined as full flowering) refers to the development stage when 50 % of the blossoms are “open”.
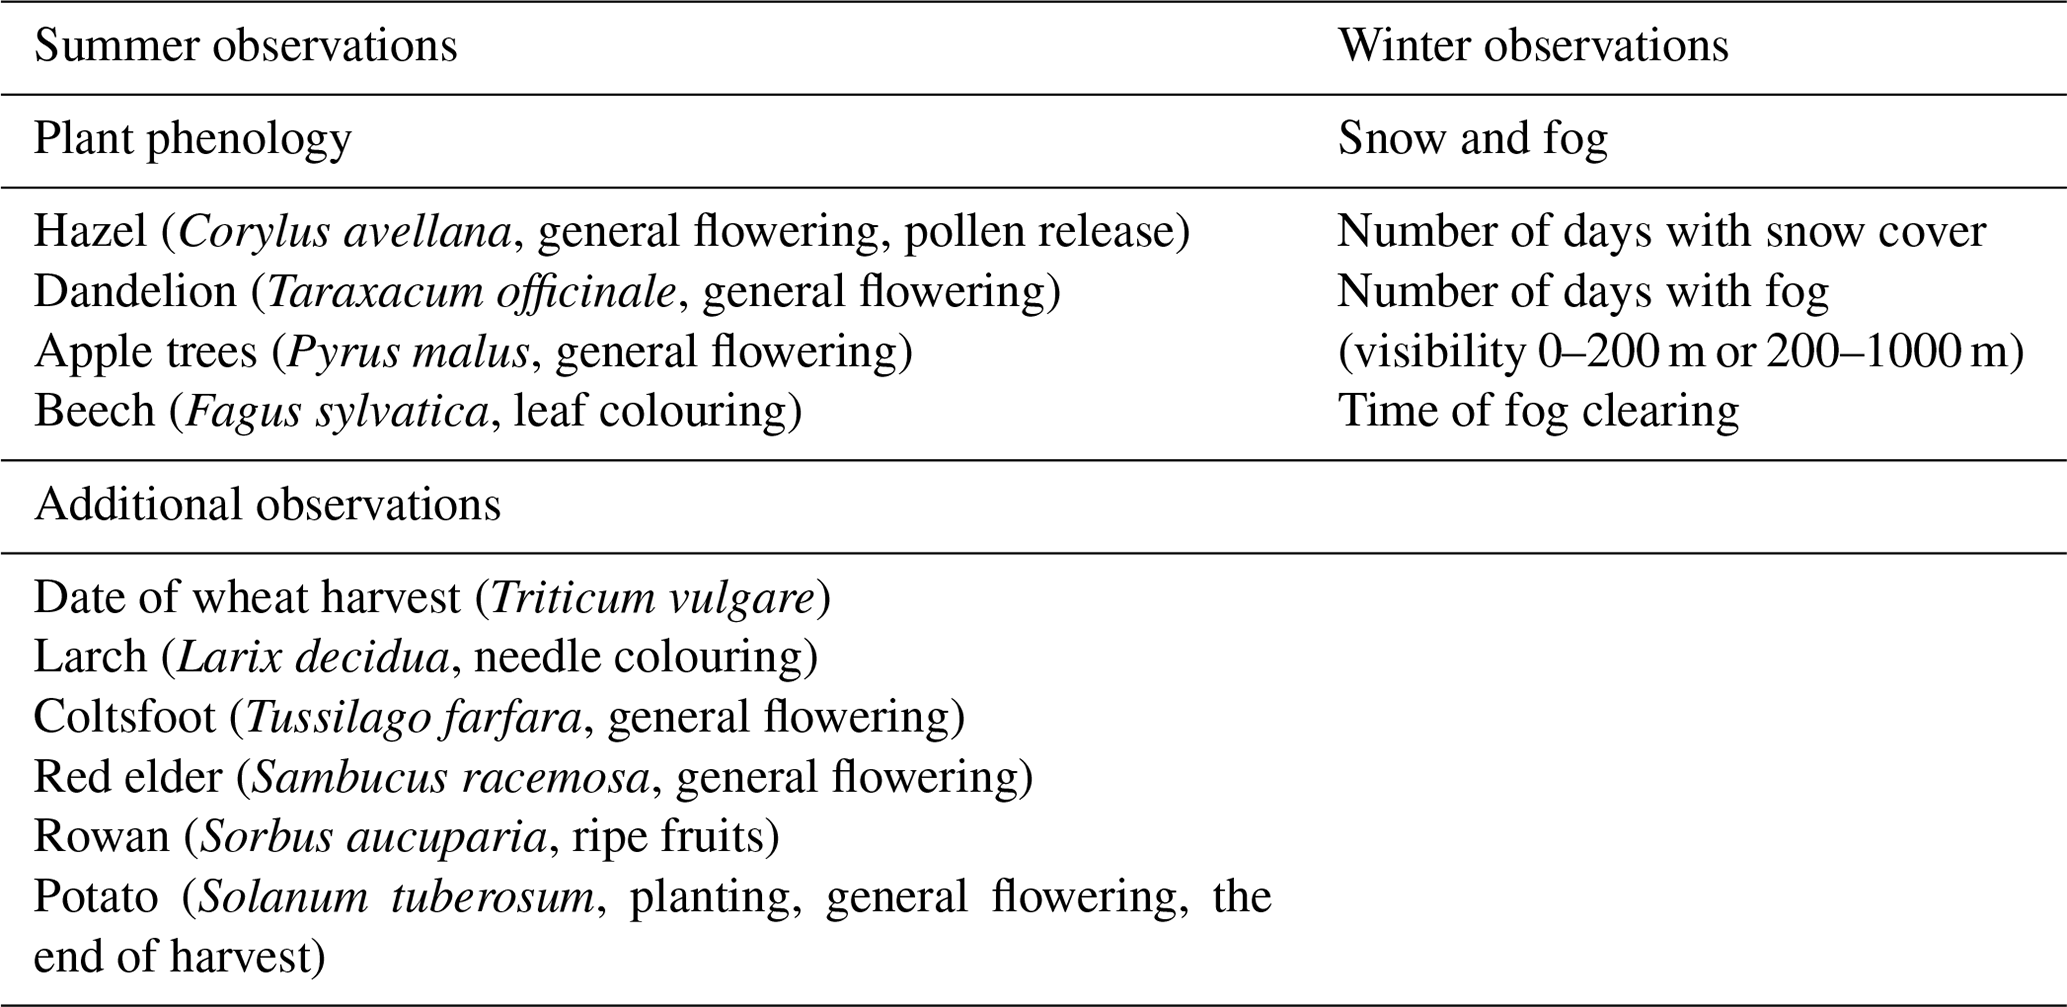
Note: winter observations daily at 07:00–08:00 LT.
The definition of the plant phenological observations follows the official instructions of MeteoSwiss (Jeanneret, 1971; Primault et al., 1957; Brügger and Vassella, 2018). Overall, more than 200 volunteers were recruited for observing in 1971 through the teacher training programme of the Institute of Geography. A large number of observers have training in public-school teaching or are family doctors, and they have a strong, intrinsic motivation for observing natural phenomena and processes. Data were submitted from 180 stations in 1971, with station and site numbers decreasing since (Fig. 2). The spatial representativity of stations strongly reflects population density. All volunteers were asked to select a number of locally representative sites (in the following “observation sites”) mostly in cultivated systems. A comprehensive overview of the BernClim network was published in Jeanneret and Rutishauser (2012).
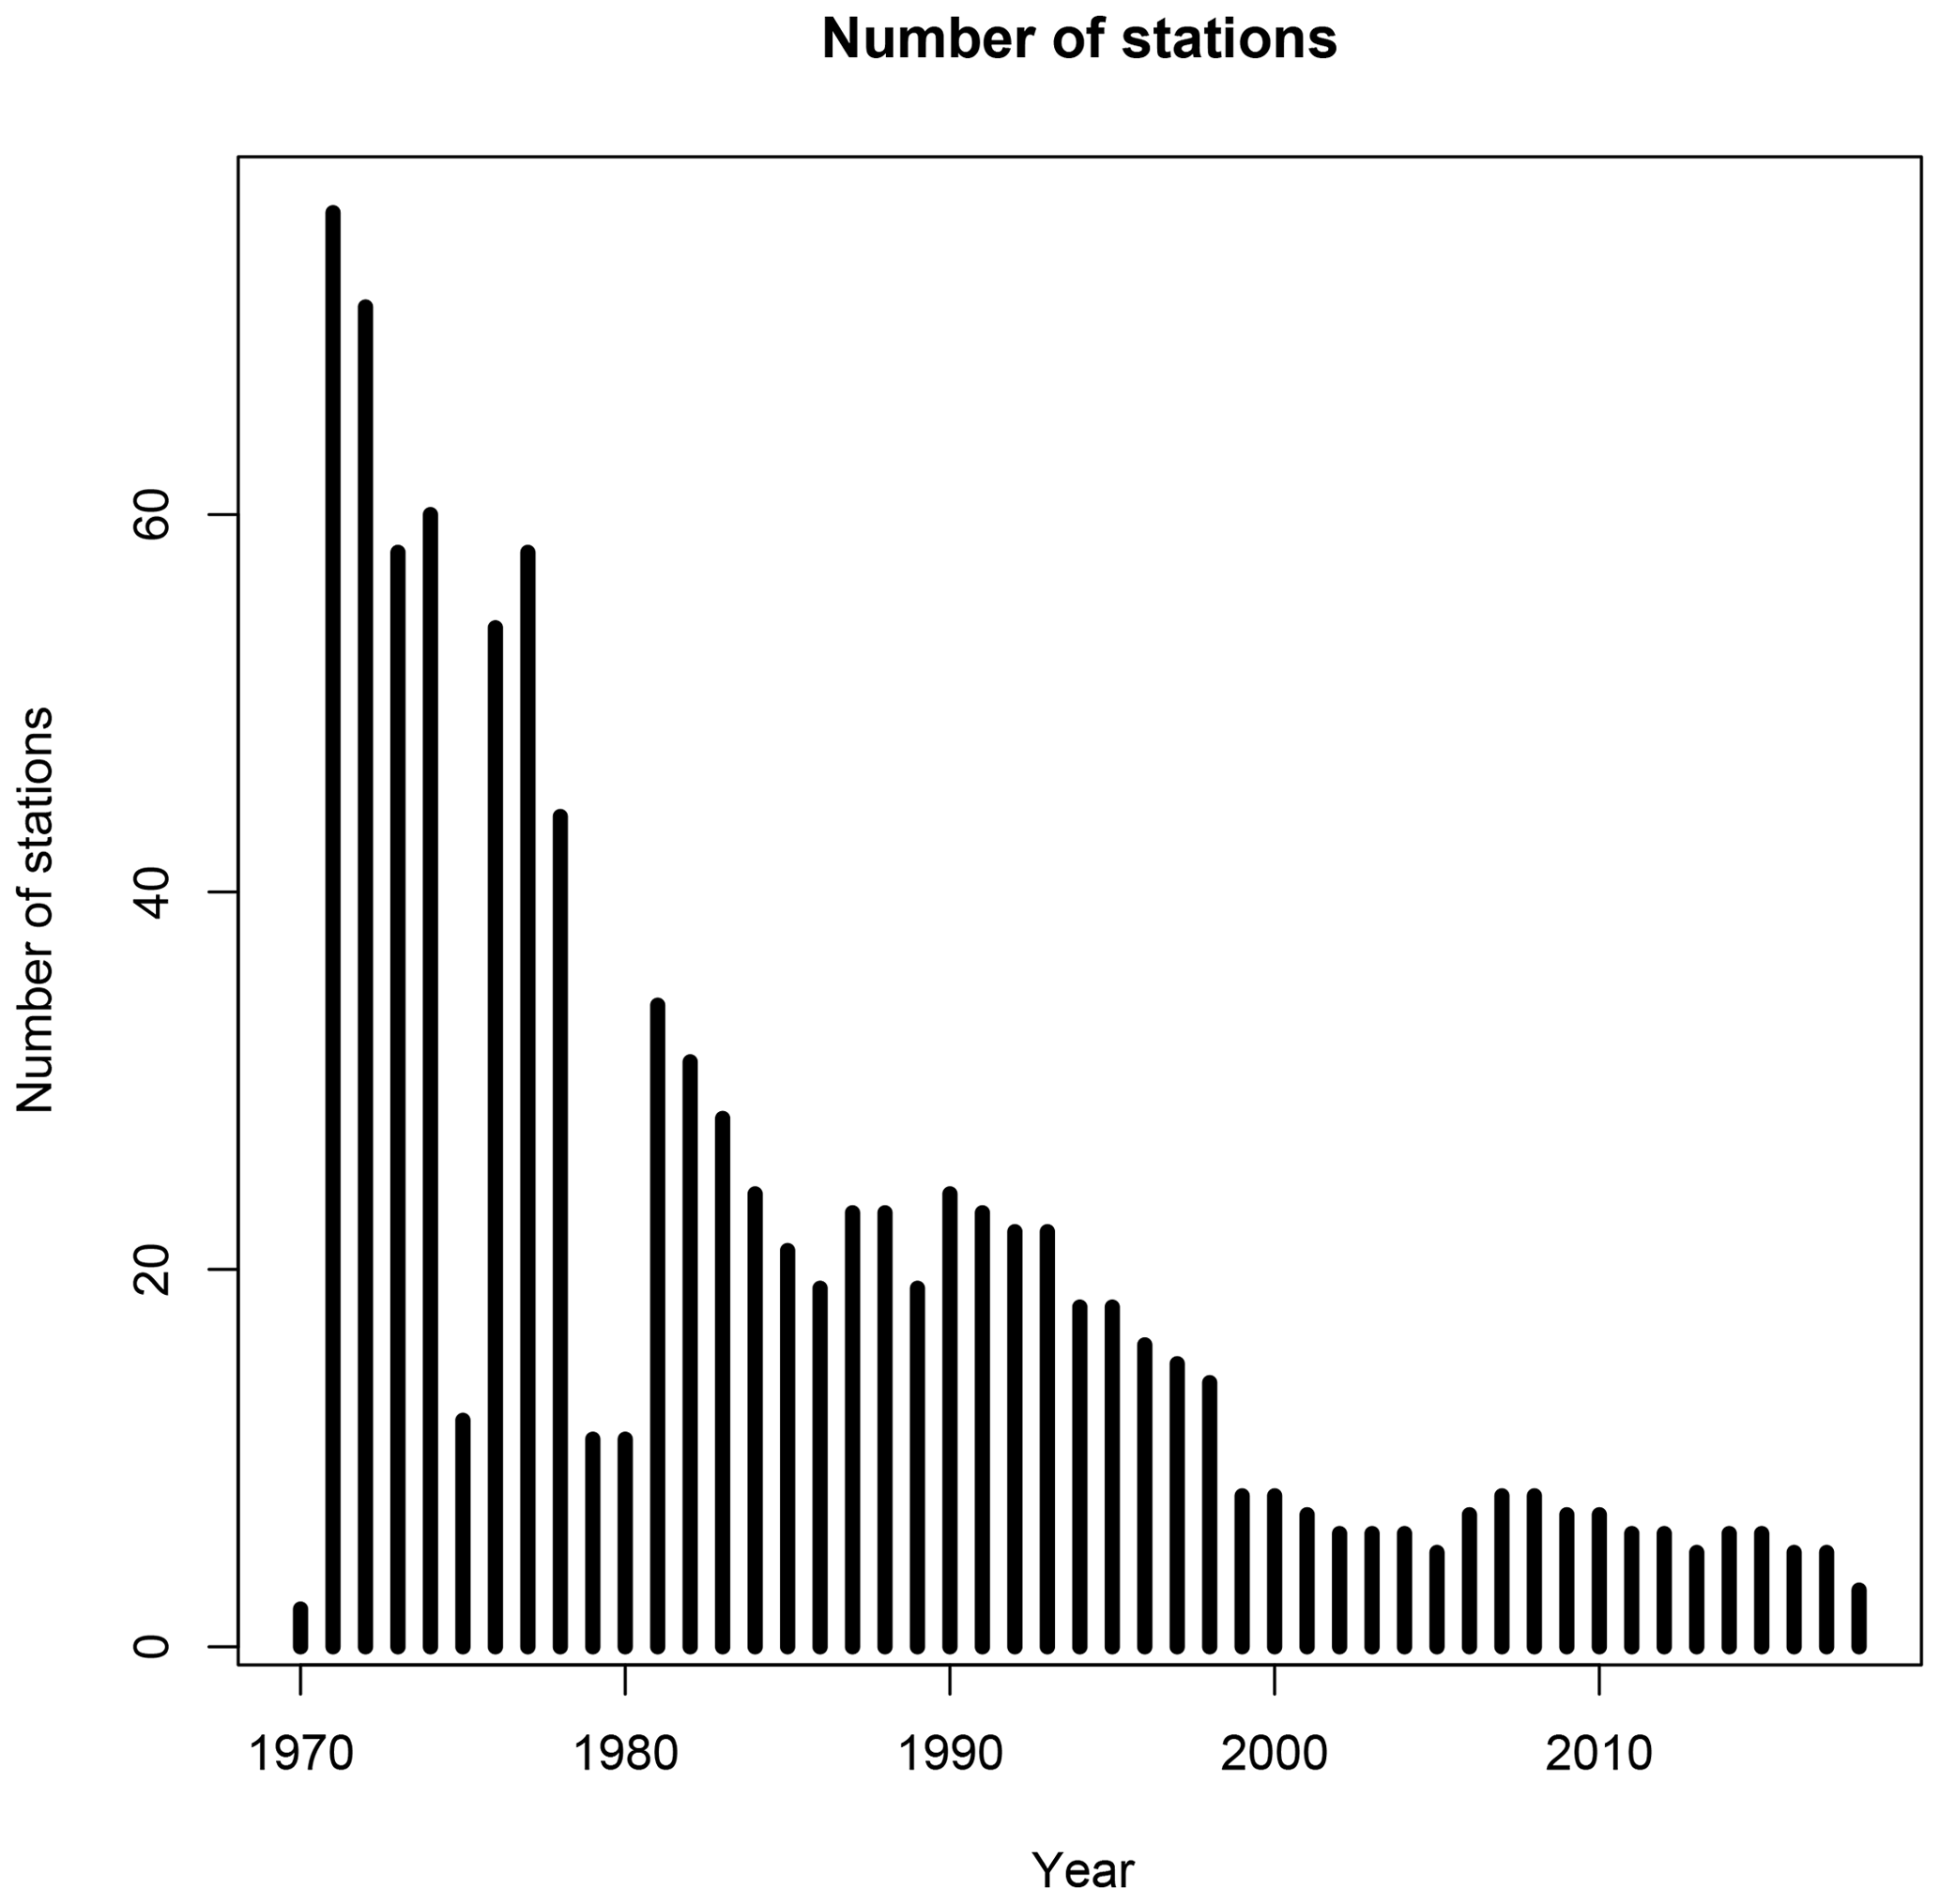
Figure 2Development of the number of stations in BernClim since 1970 (updated from Jeanneret and Rutishauser, 2012).
Phenological phases are defined by a morphological development phase of a plant that has to be reached as well as a quantitative threshold. The observation then is the date (day of year – DoY) when this threshold is crossed. For instance, for the case of apple trees, general flowering is reached when 50 % of the blossoms are “open”. The definition of open is morphologically described in the observers' instructions. Each plant and phenological phase was noted on a specific form (Fig. 3).
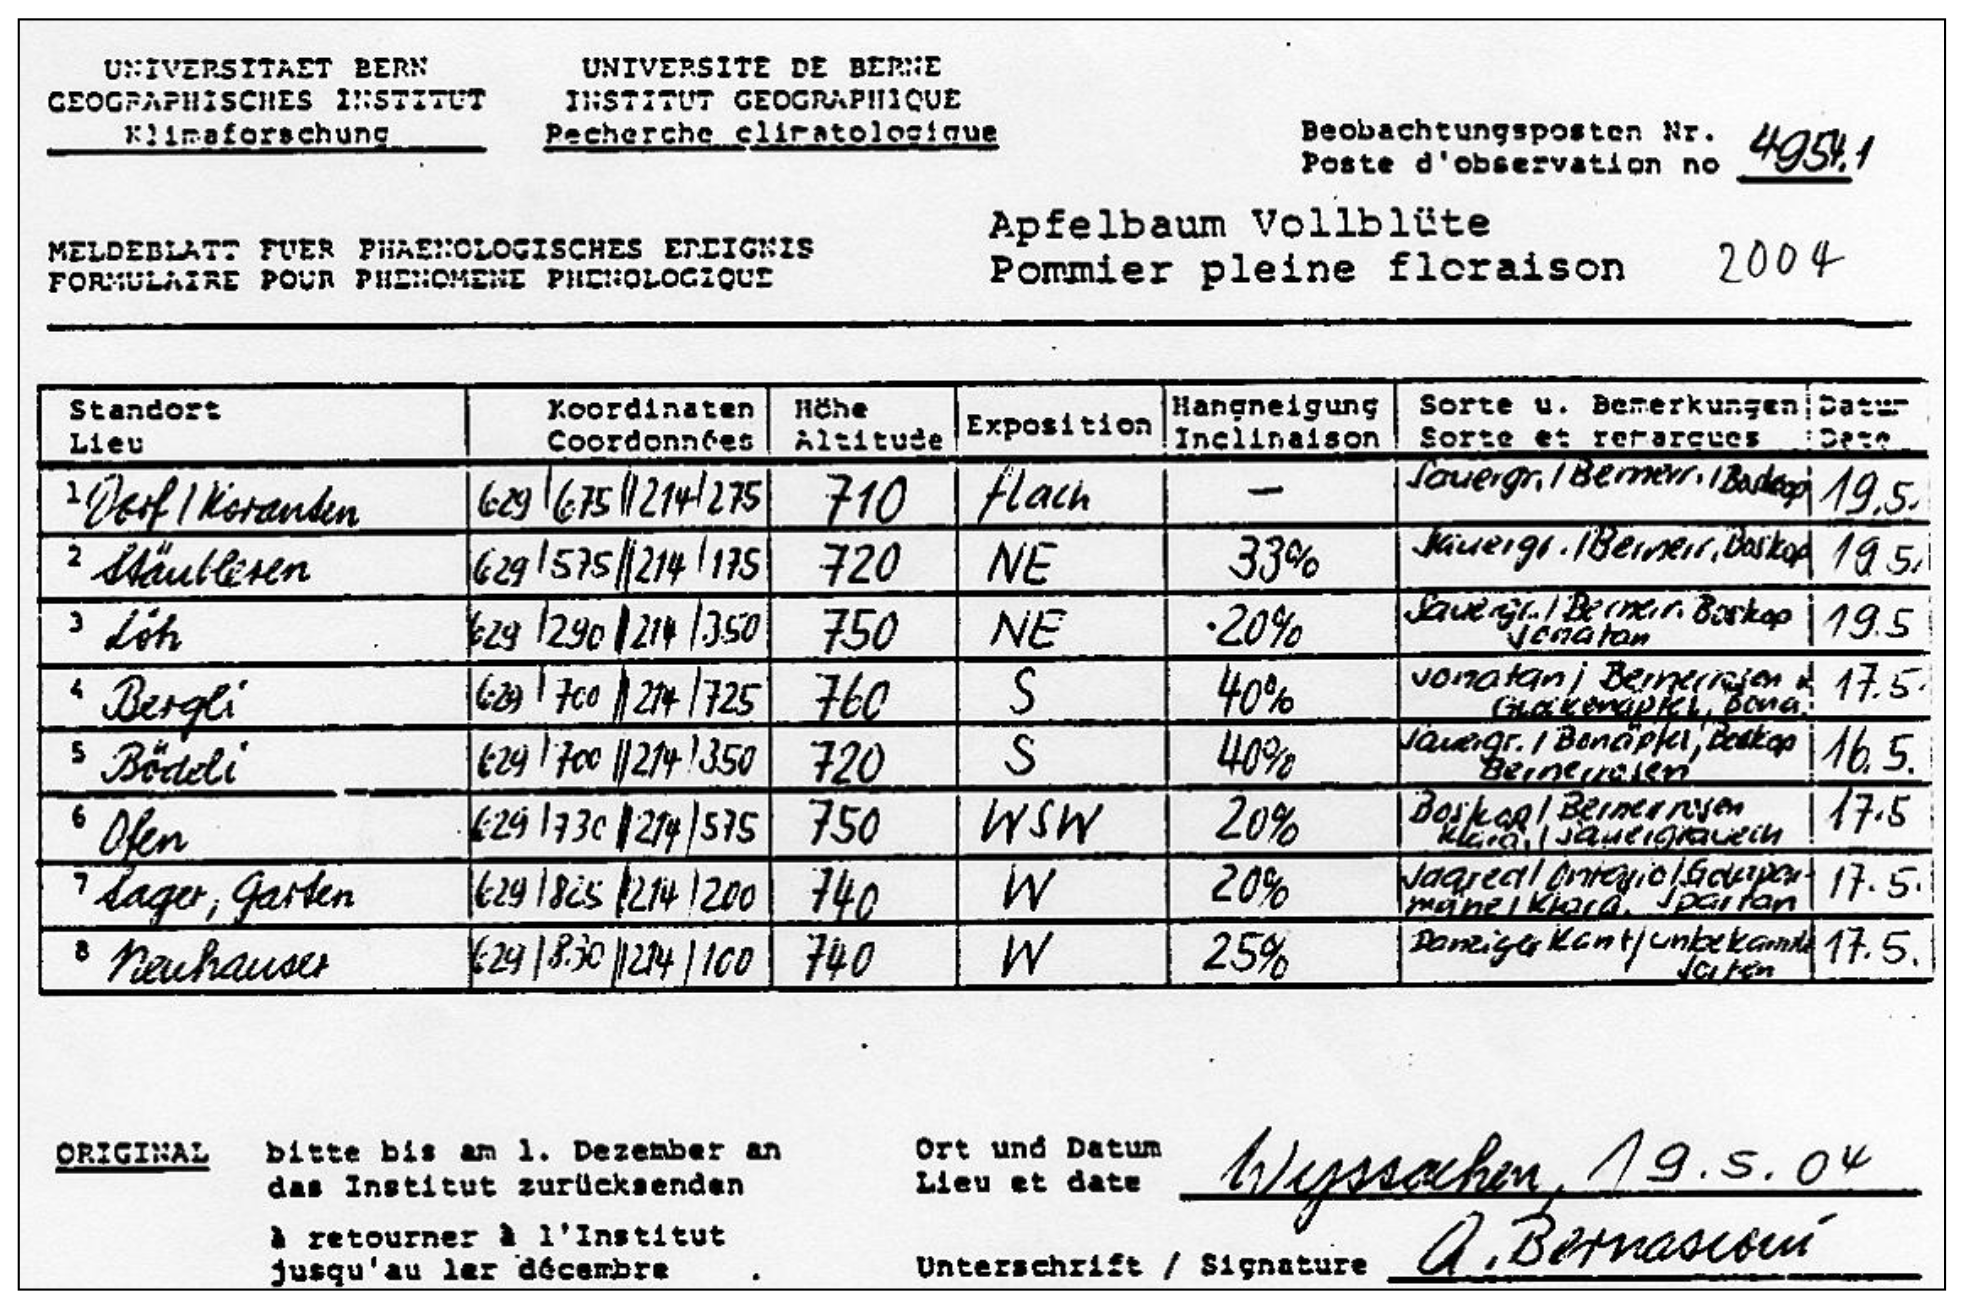
Figure 3Example of an observation sheet for plant phenological phases (Jeanneret and Rutishauser, 2012).
2.1 Data
In this paper we describe 7414 quality-controlled plant phenological observations from 1970 to 2018 (Rutishauser et al., 2019). Data were collected at sites between altitudes from 410 to 1700 m a.s.l. Reported plant species and phenological phases include the flowering of hazel (Corylus avellana), dandelion (Taraxacum officinale) and apple trees (Pyrus malus) and the leaf colouring of beech (Fagus sylvatica). Each observation record contains the site information, including a popular site name (toponym), coordinates, altitude, exposition and inclination. Several sites are combined with stations that are labelled with codes.
The different phases of the network yield quite different numbers of observations. During the intensive initial phase of the network, around 123 500 data were collected. A large number of observations were single observations and were not quality checked for this study. The number of stations and observation sites gradually decreased from initial values of 76 and 448, respectively. Presently there are five stations and observers. Figure 2 shows the number of stations as time series. Although the number of stations decreased rapidly, even the current, very sparse network still has each of the three major landscapes represented.
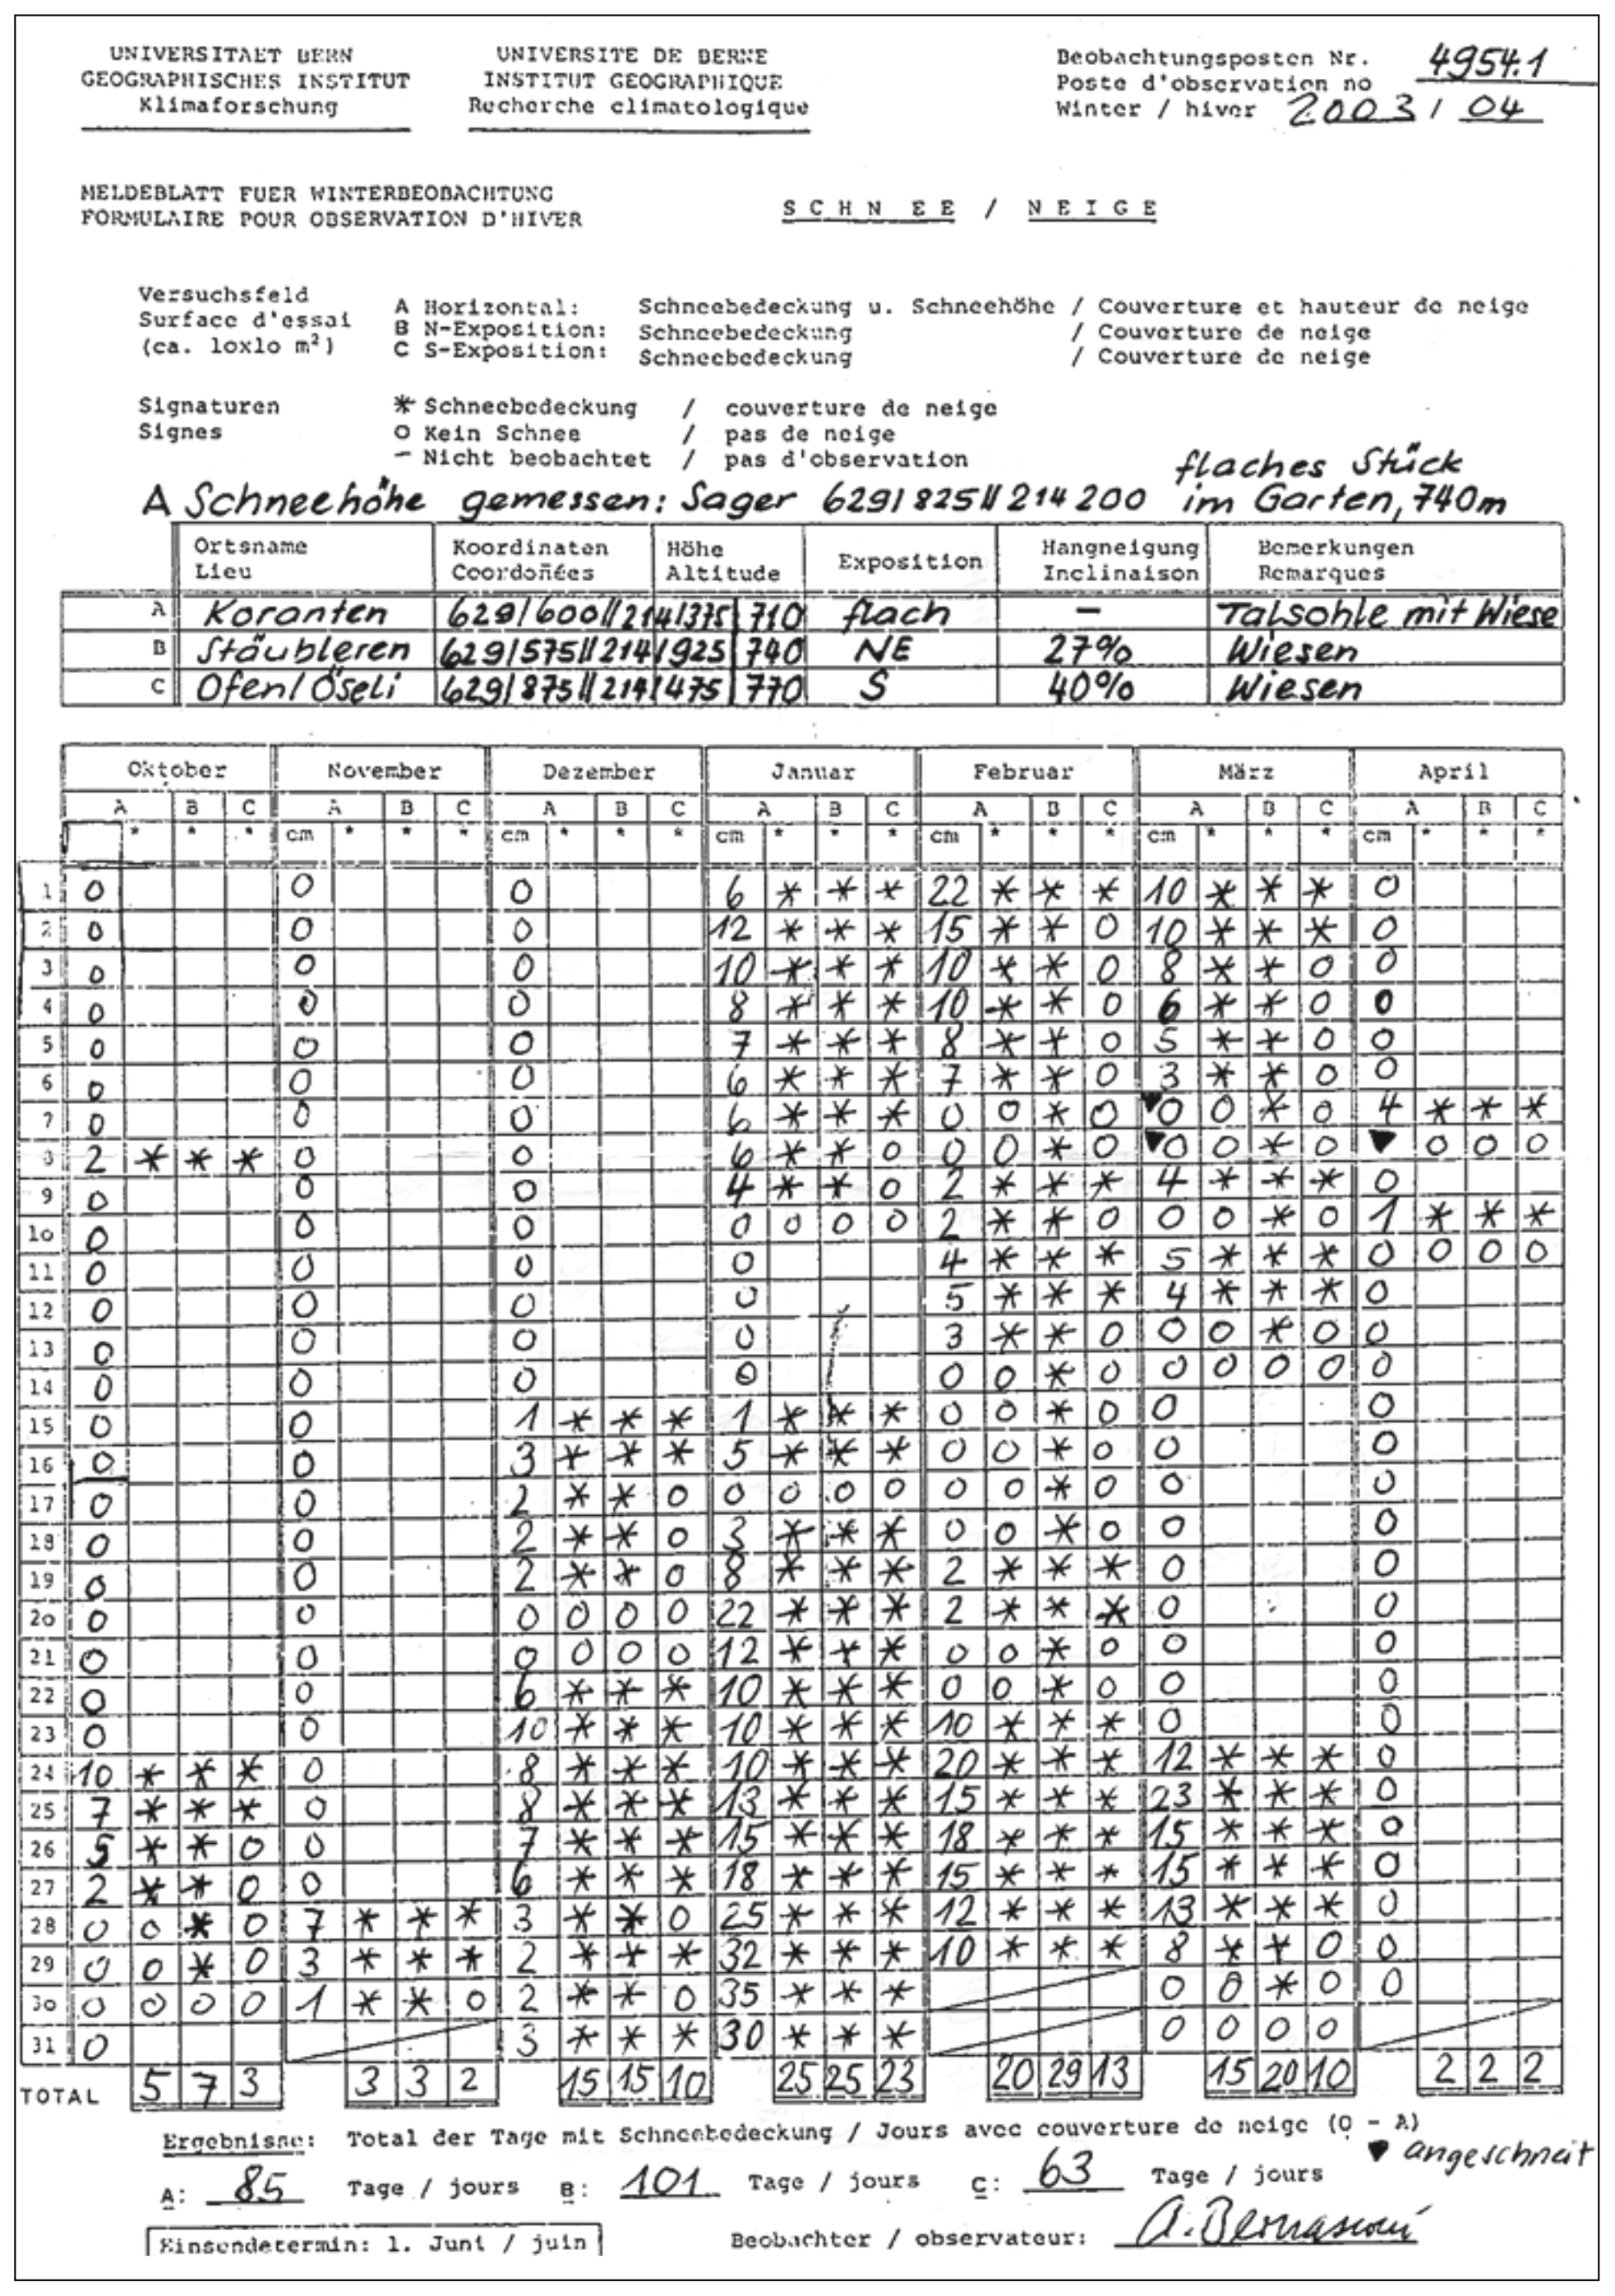
Figure 4Example of an observation sheet for snow (Jeanneret and Rutishauser, 2012).
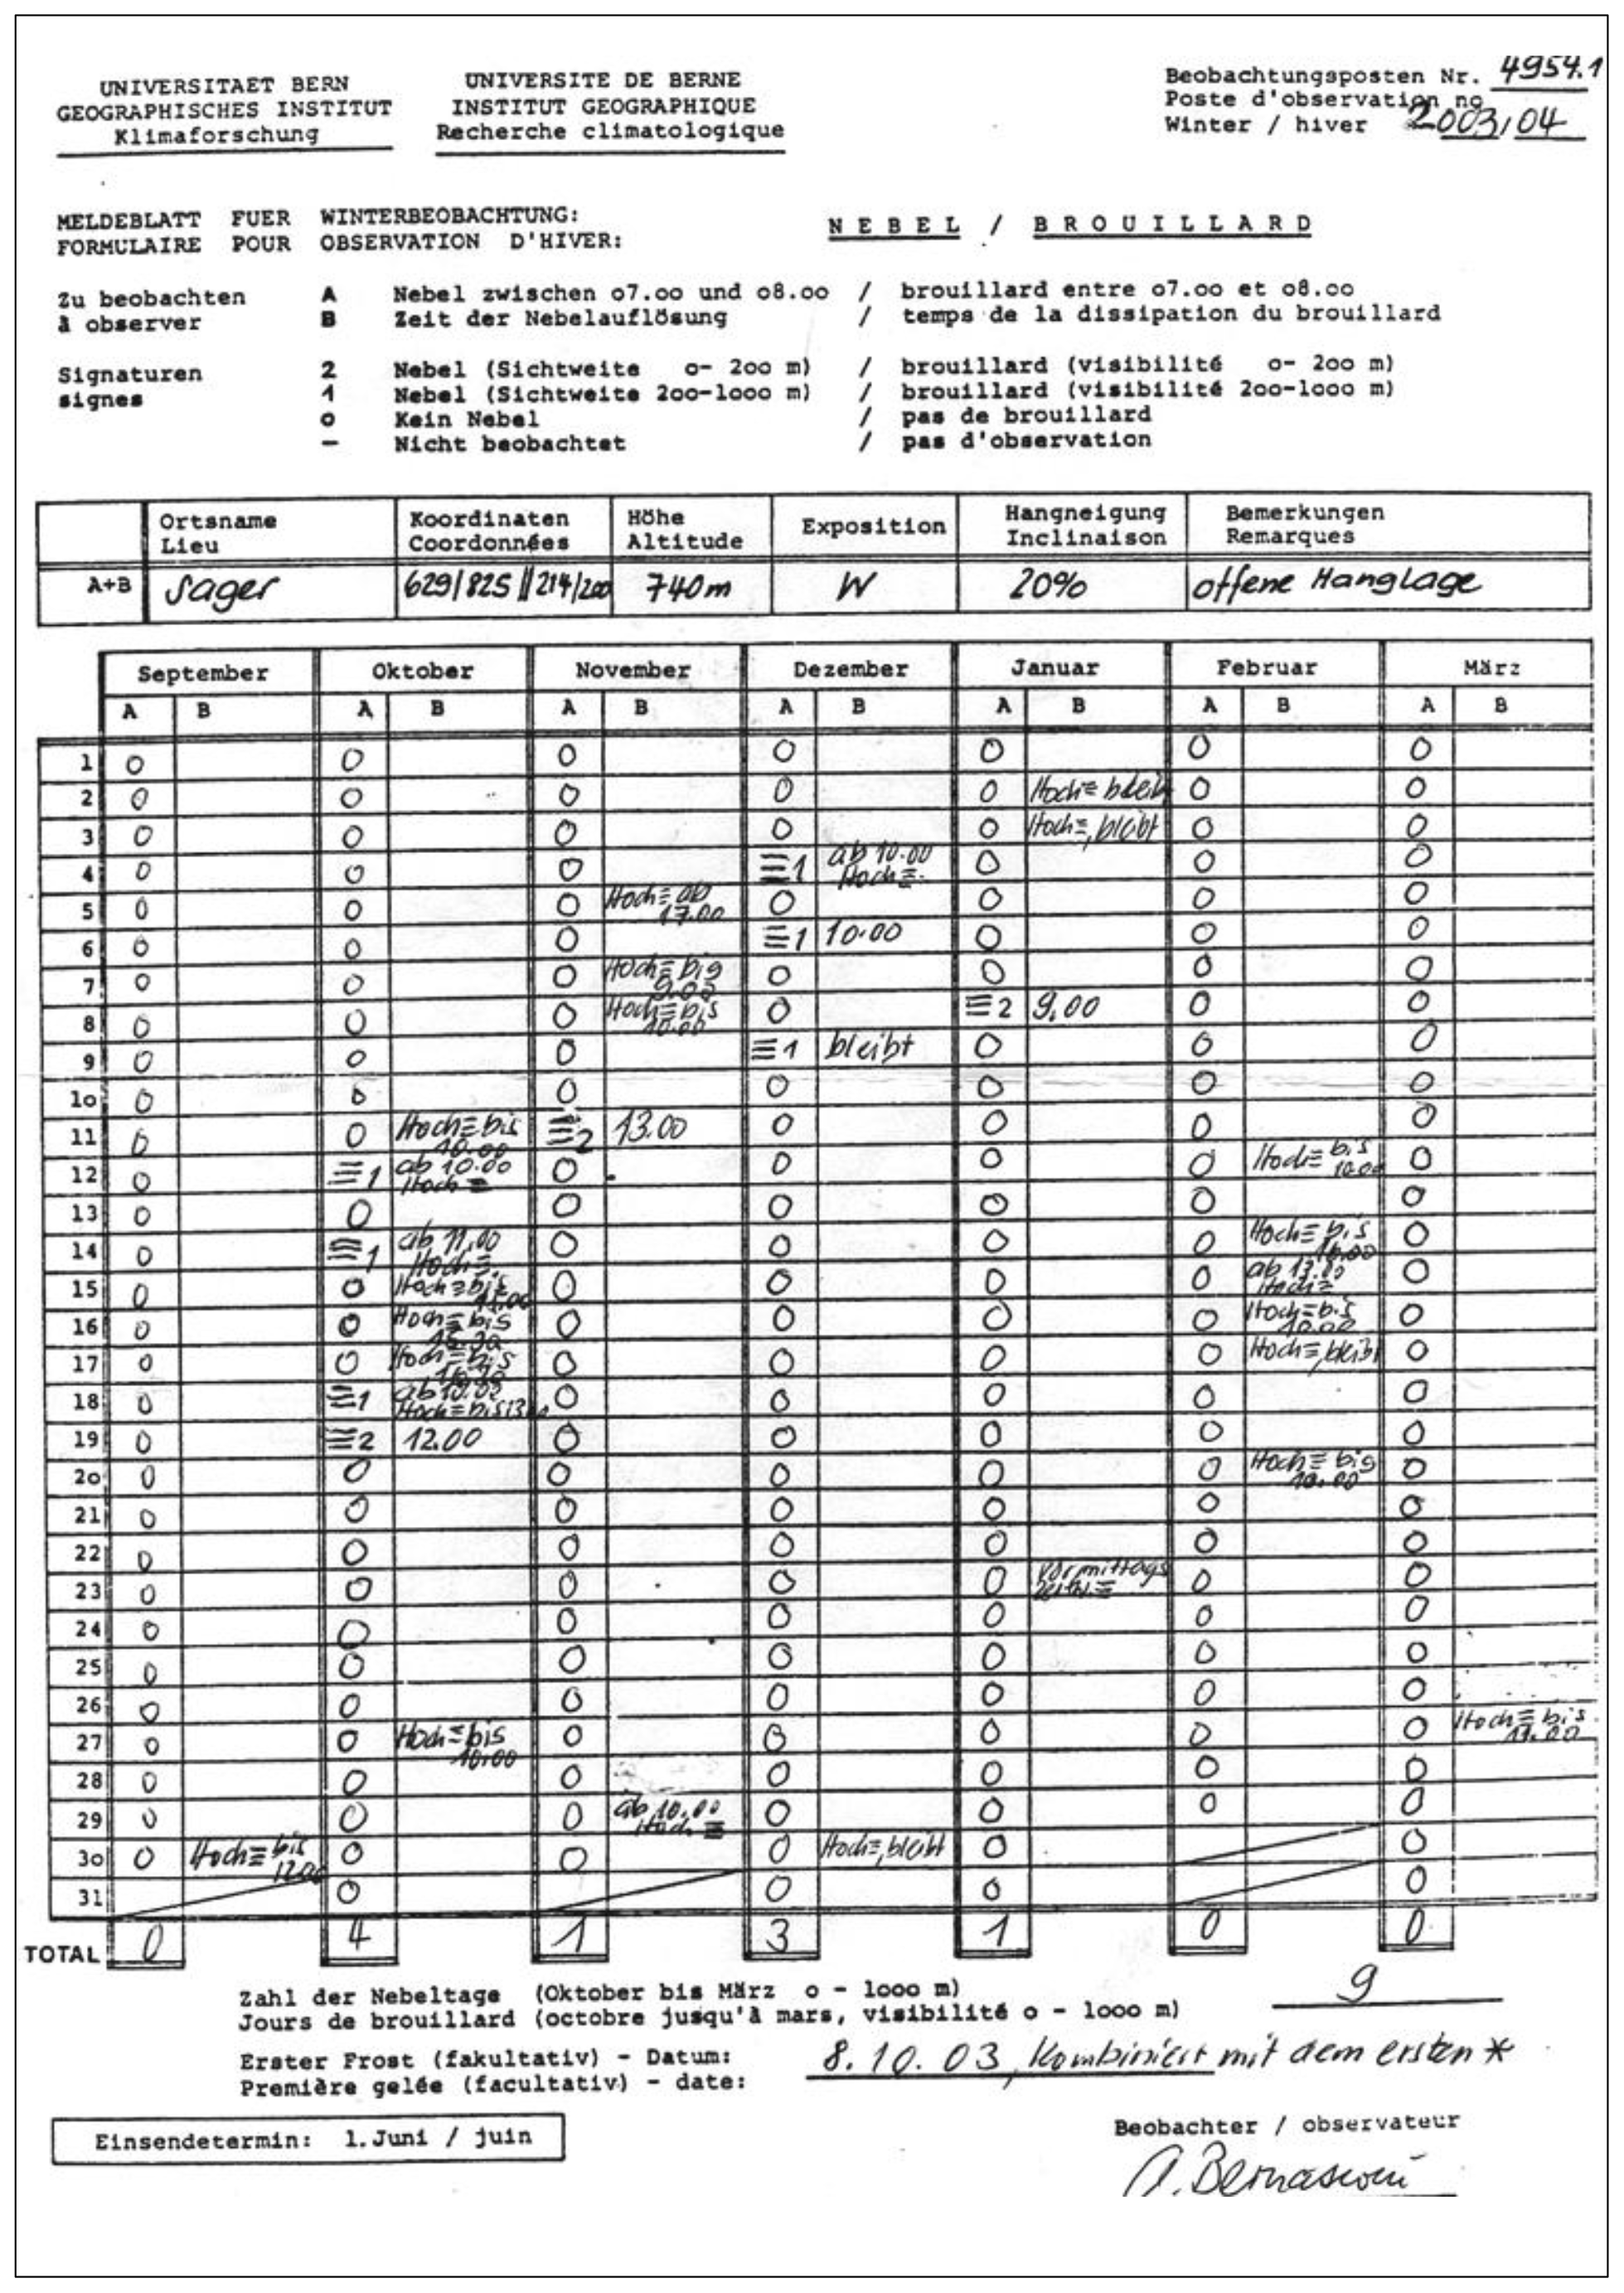
Figure 5Example of an observation sheet for fog (Jeanneret and Rutishauser, 2012).
The observers received standard forms to fill out and send back by regular mail. Figure 3 shows an example of a data sheet for plant phenophases. Figures 4 and 5 show the form used for snow and fog, respectively. All original observation sheets of plant, snow and fog observations are archived at the University of Bern. During ongoing data rescue a large fraction have been photographed. To date, only plant observations have been digitised and controlled for publication.
The quality control (QC) process consisted of several steps. First, the raw data were read into a GIS for coordinate checking. Only wrong coordinates, altitudes or location names were corrected (see Kottmann, 2008, for details). Except for very obvious errors, which were deleted, the observed dates were not changed.
The second step consisted of an operational baseline QC, which was done by an expert in biology, plant physiology and phenology (Robert Brügger). This step included filling data gaps from the original paper records and station history descriptions. During this procedure, observer changes were systematically recorded in station documentations, including interviews with observers (unpublished data).
Table 2Plant-specific, biological limits in days of year (DoY) with respect to five altitude ranges (MeteoSwiss, personal communication, 2019).

The third step comprised an automated flagging routine similar to Auchmann et al. (2018). This automatic quality control of the BernClim data consisted of six checks. For this purpose we formed “series”, which refers to all events of the same phenological phase at the same site (i.e. the same coordinates). This means that there can be a large number of series per station and code. The first four tests use absolute dates; test 5 is based on standardised series, while for test 6, for a given year, the standardised dates from all series were re-standardised. The following flags were set.
-
Test 1 included impossible dates (day of year above 366, below −366 or at 0 is considered impossible).
-
Test 2 included dates outside of the range indicated by MeteoSwiss (personal communication, 2019; Table 2).
-
Test 3 included non-first dates (if several dates are found in the same year, all except the first were flagged).
-
Test 4 included four consecutive identical dates after removing non-first dates of the same year.
-
Test 5 included dates outside of standard deviations (SD) of ±3 for each series after removing non-first dates of the same year and only for series with a minimum length of 10 (41 % of all values tested).
-
Test 6 included dates outside of standard deviations of ±3 for all series for a given year after removing non-first dates of the same year and only for series with a minimum length of 10 and years with a minimum of 10 observations (40 % of all values tested). For this test, the standardised dates were re-standardised across all stations for each year.
The quality control found no impossible dates and no consecutive identical dates; 5 dates (0.07 %) were outside of a SD of 3 per series, and 10 dates (0.13 %) were outside of a SD of 3 for all series in a given year. These are very low rates, which points to good internal consistency and likely good quality of the data.
There are many “non-firsts” (2.47 %) for which the original documents sometimes provide explanations. Since these are deviations from the observation instructions, we flagged them nevertheless. Interestingly, we found a relatively high rate of dates outside the range given by MeteoSwiss, namely 3.56 %. Of these, most (60 %) concerned the leaf colouring of beech, and 22.7 % concerned the flowering of apple. The range given by MeteoSwiss refers to a range with a SD of 3 per phase and altitude region. This means that for a normal distribution, 0.3 % outliers are expected; however, we find 10 times this amount. At the same time, only six are picked up by the other tests, which indicates that most of these outliers are consistent with the other observations both in space and time.
The QC methods test for outliers and exceptionally wide distributions but not for the opposite (too narrow) distributions. Here, it is noteworthy that the data set has only one hazel flowering event before the start of the year, whereas we might expect this to occur more frequently.
Long series (≥20 years) were checked for temporal inhomogeneities (caused, e.g. by a change of observed plant) following the method described in Auchmann et al. (2018). In short, three different statistical tests are applied to each phenological series, and the agreement between the tests determines the significance of an inhomogeneity (significant when at least two tests agree on an inhomogeneity). At least three correlated reference series are required to run the tests: this requirement limits the number of tested series to 51 (out of 56 long series). Only one series was found to be significantly inhomogeneous (Fig. 6).
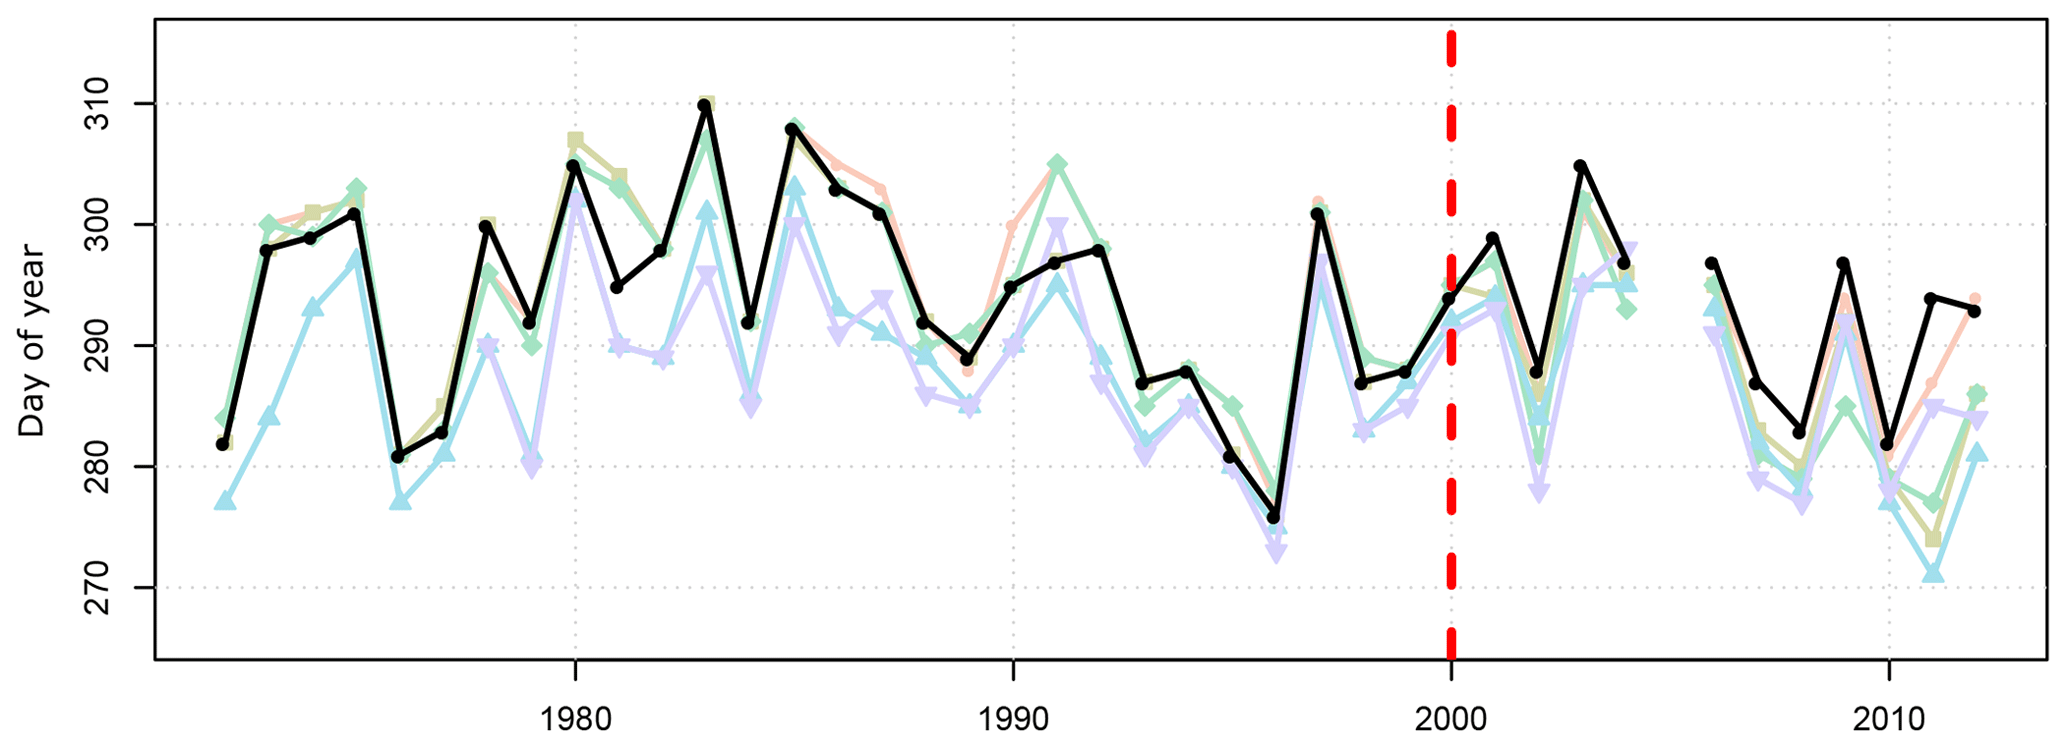
Figure 6Inhomogeneous series for the leaf colouring of the beech in Wyssachen – Oeseliwaeldli (bold black line). The coloured lines represent five other series of the leaf colouring of beech (reference series) in other parts of the community of Wyssachen. The leaf colouring in the inhomogeneous series occurs on average about 3 d later than expected after the year 2000 (red vertical line).

Figure 7General flowering of hazel in BernClim (diamonds) and SPN (circles) data in 1971 (a) and 2017 (b). The right figure also shows data from two citizen science projects, PhaenoNet (triangles) and OpenNature (squares; updated from Lehmann et al., 2018).
In summary, BernClim data are expert data and subject to uncertainties. These depend on the observability of the phenomena and the speed of the development. Spring phases are typically relatively clearly defined (±1 d), whereas the autumn phases have larger uncertainties (typically ±3.5 d; see Brügger, 1998).
Figure 7 shows the day of year of hazel flowering in the BernClim network in 1971 (172 observations) and in 2017 (16 observations). The figure is supplemented with data from the SPN as well as from two citizen science projects, OpenNature and PhaenoNet, for 2017 (http://www.opennature.ch/, last access: 6 November 2019, https://www.phaenonet.ch/, last access: 6 November 2019). For the BernClim data, observations from the same station are joined graphically. Contiguous diamonds thus show the variation within one station across different observation sites, which may be larger than that on a regional scale. Note that flowering occurred ca. 40 d earlier in the year 2017 compared to 1971.
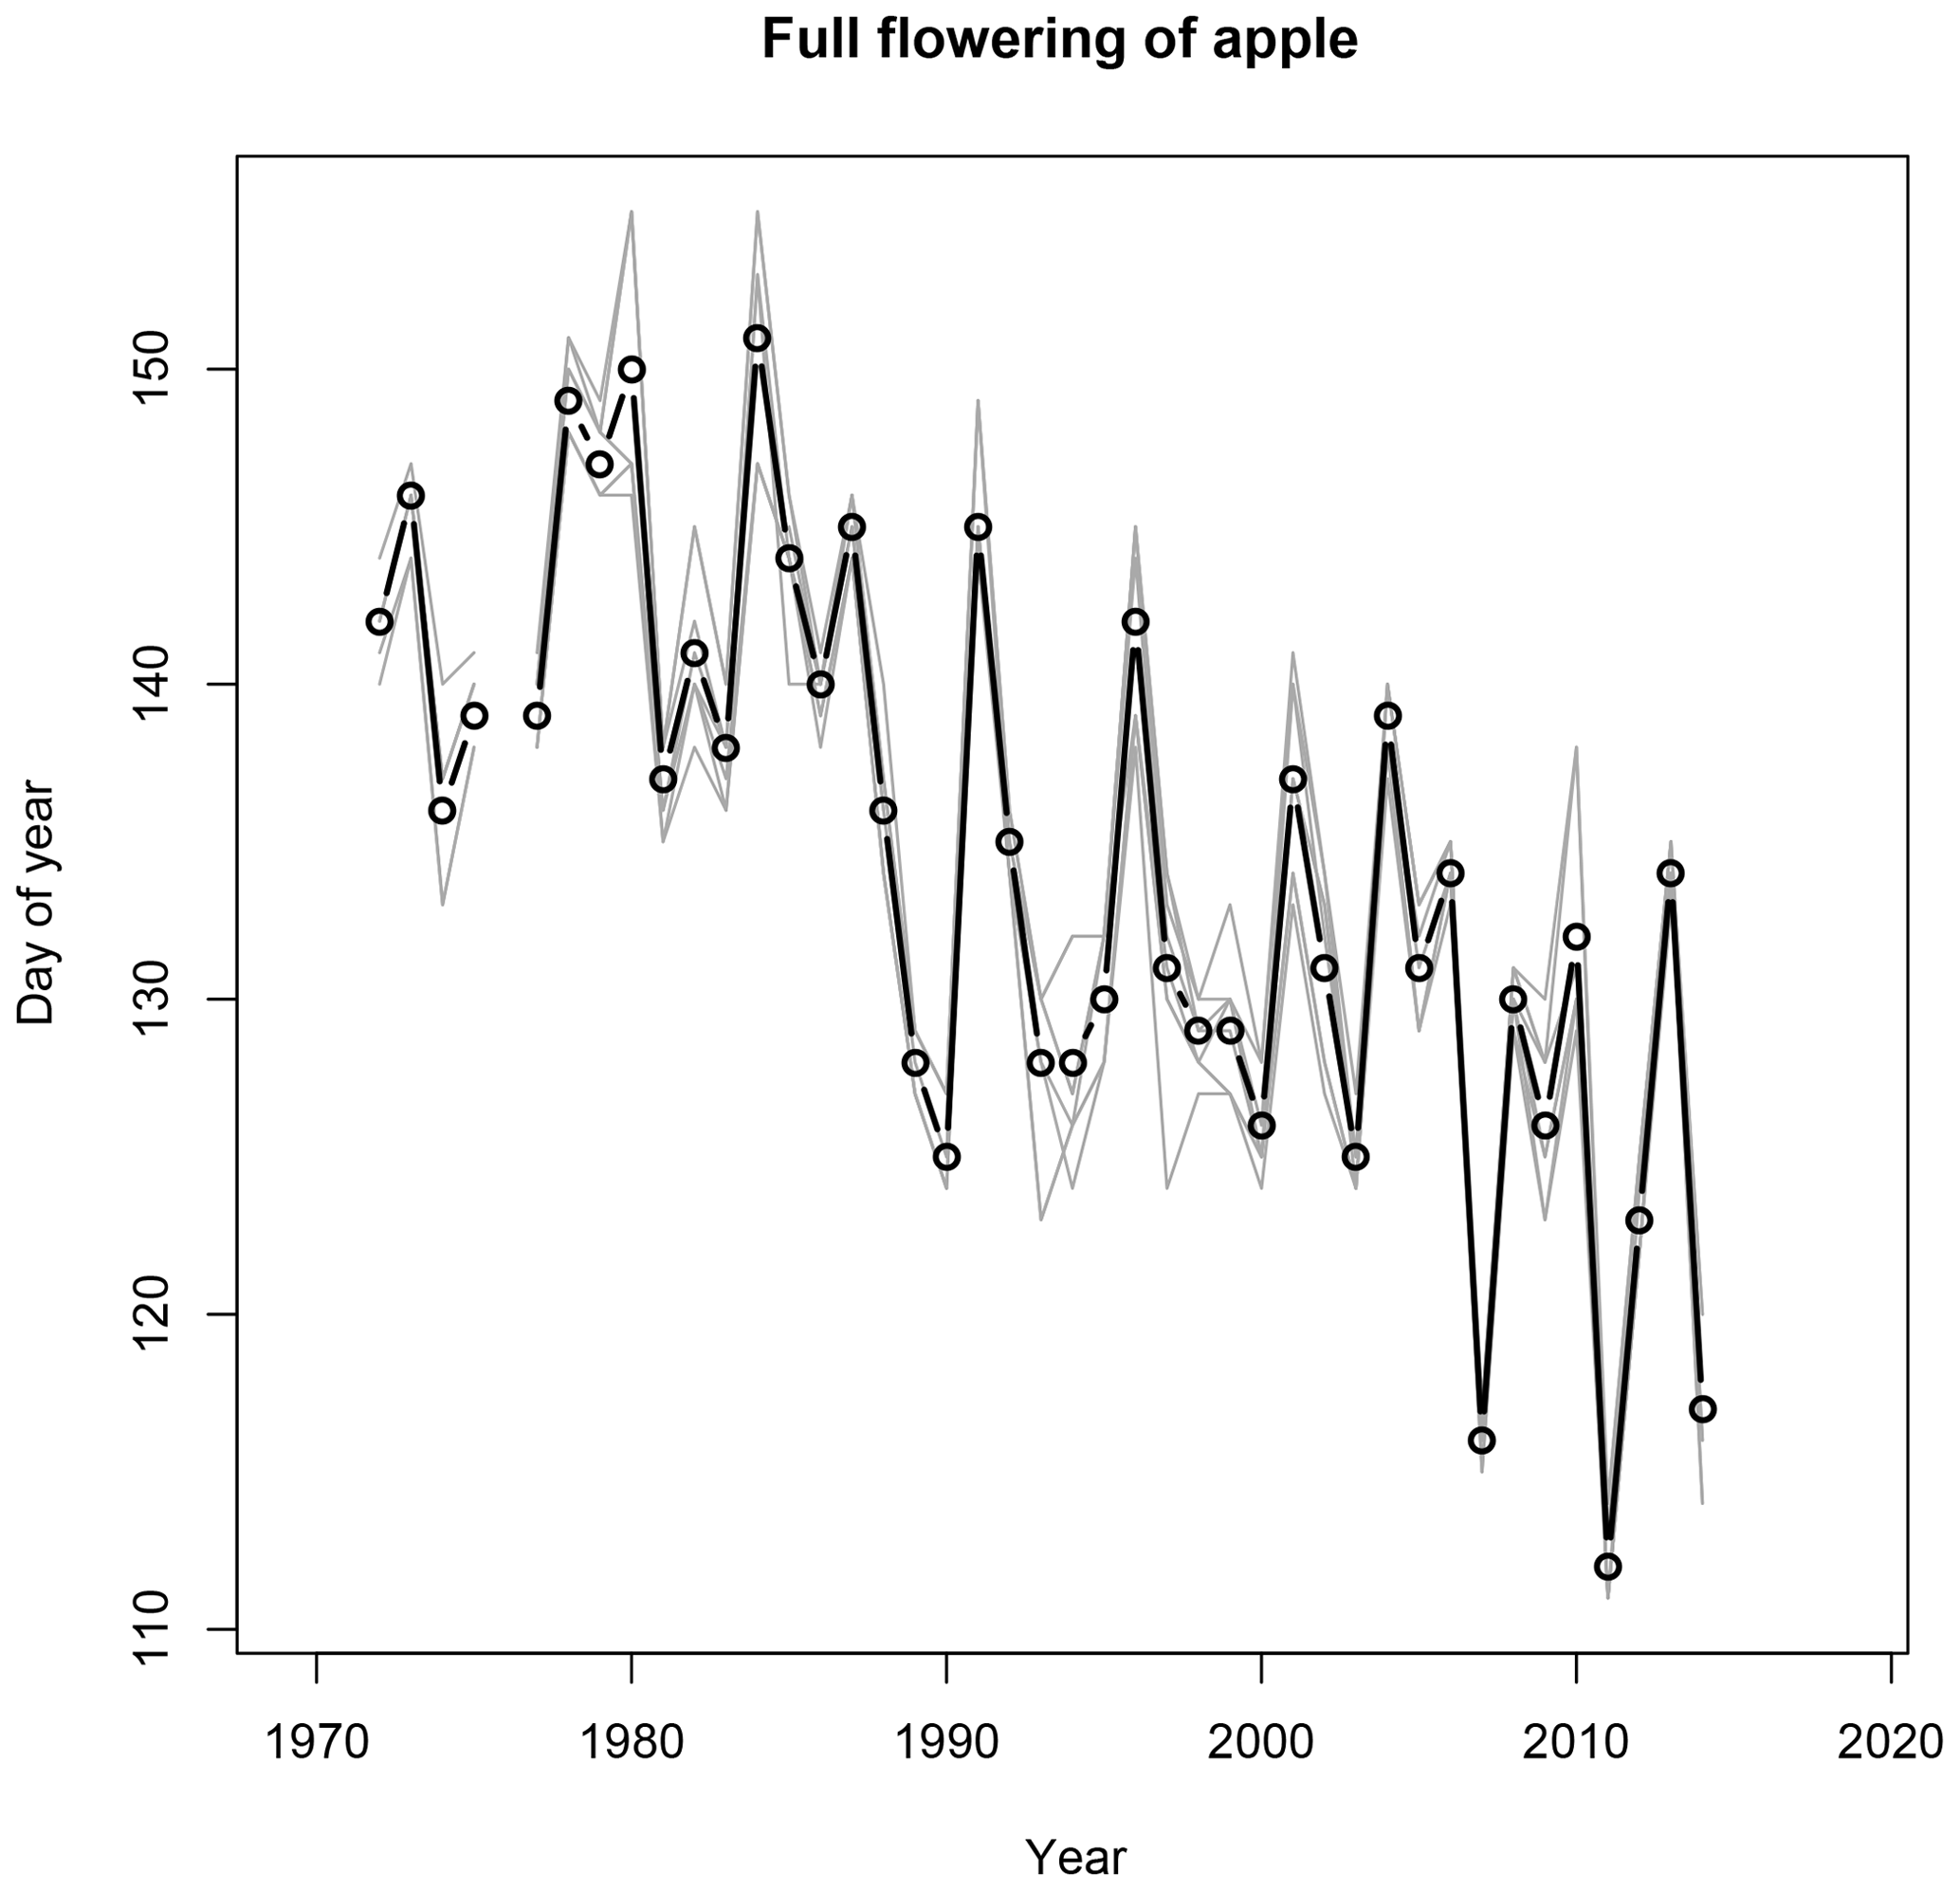
Figure 8BernClim apple flowering dates from nine sites (grey lines) of Wyssachen station (710 to 760 m a.s.l.) Black lines and circles denote station mean dates.
Several series cover more than 40 years. As an example for a long time series, Fig. 8 shows the start of the blossom of the apple tree from nine sites at Wyssachen. The series clearly shows a trend towards earlier flowering dates over the observation period. The series also shows a shift in the late 1980s. This shift is well documented in many other series (see also Reid et al., 2013). It is also found in European or even northern hemispheric spring snow cover (Brönnimann, 2015). A change in late winter temperature around the late 1980s, albeit smaller than in observations, is also found in forced atmospheric model simulations, implying that part of this change was due to an overlap of forcing factors such as greenhouse gases, sea-surface temperatures (El Niño 1986–1987; La Niña 1988–1989), volcanic eruptions and other effects (Brönnimann et al., 2006). The BernClim data can thus help to better analyse this stepwise climatic and ecological change.
The data presented and described in this paper are available in the data repository PANGAEA: https://doi.org/10.1594/PANGAEA.900103 (Rutishauser et al., 2019).
A plant phenological data set spanning almost 50 years is published as a data set in PANGAEA. Subsequently the data will be added to the PEP725 data and will also be available from the geoportal of the canton of Bern. The series were quality controlled. It should be noted that BernClim data are expert data and subject to uncertainties. Quality control procedures were performed to flag uncertain observations.
Although the number of stations decreased rapidly after the initial phase of the network, five long-term series remained which allow a 50-year view with almost no observer changes. Despite the sparseness, they still cover spatial variability in climatically relevant plant development stages of four species in three typical climate zones of Switzerland. Inhomogeneity tests suggest that stepwise changes are rarely driven by observational artefacts such as changes in observers, definitions or station changes, revealing strong consistency within long time series that underlines the quality of the data. In the future, the data series could be continued and merged with citizen science data and platforms such as PhaenoNet and OpenNature (Lehmann et al., 2018). As methodologies evolved, the integration of high-resolution data sets in space is more easily combined with long-term data as the BernClim observations.
This paper only describes the phenological data. The rich (daily) winter data remain to be explored further. BernClim data may help in constraining further relevant indices such as the leaf area index or NDVI on a small scale. As indicated by Rutishauser et al. (2007) and Stöckli et al. (2008), the data have the potential to locally extend satellite data back to 1970, and they have the potential to allow biological processes to be studied on the local level with continuous evidence over 5 decades.
TR, FJ and SB conceived the idea of the study. CR, AB, PB and numerous observers collected the data. TR, YB, CP, LV, DL, LM and SB processed and analysed the data. TR and SB prepared the paper, with contributions from all co-authors.
The authors declare that they have no conflict of interest.
We would like to thank all observers of BernClim, who devoted a lot of time and effort to collecting data for our network. The paper is dedicated to Bruno Messerli, who passed away in February 2019.
This research has been supported by the Swiss GCOS Office (project PhenoClass) and the Swiss National Science Foundation (project 139945).
This paper was edited by David Carlson and reviewed by two anonymous referees.
Anderson, D. M., Mauk, E. M., Wahl, E. R., Morrill, C., Wagner, A. J., Easterling, D., and Rutishauser, T.: Global warming in an independent record of the past 130 years. Geophys. Res. Lett., 40, 189–193, https://doi.org/10.1029/2012GL054271, 2013.
Aono, Y. and Kazui, K.: Phenological data series of cherry tree flowering in Kyoto, Japan, and its application to reconstruction of springtime temperatures since the 9th century, Int. J. Climatol., 28, 905–914, https://doi.org/10.1002/joc.1594, 2008.
Auchmann, R., Brugnara, Y., Rutishauser T., Brönnimann, S., Gehrig, R., Pietragalla, B., Begert, M., Sigg, C., Knechtl, V., Calpini, B., and Konzelmann, T.: Quality Analysis and Classification of Data Series from the Swiss Phenology Network, Technical Report MeteoSwiss, 271, 77 pp., 2018.
Brönnimann, S.: Climatic changes since 1700, Springer, Advances in Global Change Research, Vol. 55, xv + 360 pp. 2015.
Brönnimann, S., Schraner, M., Müller, B., Fischer, A., Brunner, D., Rozanov, E., and Egorova, T.: The 1986–1989 ENSO cycle in a chemical climate model, Atmos. Chem. Phys., 6, 4669–4685, https://doi.org/10.5194/acp-6-4669-2006, 2006.
Brügger, R.: Die phänologische Entwicklung von Buche und Fichte, Beobachtung, Variabilität, Darstellung und deren Nachvollzug in einem Modell, Geographica Bernensia, Arbeitsgemeinschaft Geographica Bernensia, Bern, G 49, 186 pp., 1998.
Brügger, R. and Vasella, A.: Pflanzen im Wandel der Jahreszeiten, Anleitung für phänologische Beobachtungen/Les plantes au cours des saisons. Guide pour observation phénologiques, Geographica Bernensia, 288 pp., https://doi.org/10.4480/GB2018.N02, 2018.
Defila, C. and Clot, B.: Phytophenological trends in Switzerland, Int. J. Biometeorol., 45, 203–207, 2001.
Defila, C., Clot, B., Jeanneret, F., and Stöckli, R.: Phenology in Switzerland since 1808, in: From weather observations to atmospheric and climate Sciences in Switzerland, edited by: Willemses, S. and Fuger, M., vfd, Zurich, 291–306, 2016.
Demarée, G. R. and Rutishauser, T.: “Periodical Observations” to “Anthochronology” and “Phenology” – The scientific debate between Adolphe Quetelet and Charles Morren on the origin of the word “Phenology”, Special Issue Phenology 2010, Int. J. Biometorol., 55, 753–761, https://doi.org/10.1007/s00484-011-0442-5, 2011.
Ge, Q., Wang, H., Zheng, J., Rutishauser, T., and Dai, J.: A 170 year spring phenology index of plants in eastern China, J. Geophys. Res., 119, 301–311, https://doi.org/10.1002/2013JG002565, 2014.
IPCC: Climate Change 2013: The Physical Science Basis, in: Contribution of Working Group I to the Fifth Assessment Report of the Intergovernmental Panel on Climate Change, edited by: Stocker, T. F., Qin, D., Plattner, G.-K., Tignor, M., Allen, S. K., Boschung, J., Nauels, A., Xia, Y., Bex, V., and Midgley, P. M., Cambridge University Press, Cambridge, UK, New York, NY, USA, 1535 pp., 2013.
Jeanneret, F. (Ed.): Anleitung für phänologische Beobachtungen, 2nd. Edn., Geographisches Institut der Universität Bern, Bern, 28 pp., 1971.
Jeanneret, F. and Rutishauser, T.: BernClim. Saisonalität-Monitoring – Jura, Mittelland, Alpen/Surveillance de la saisonalité – Jura, Moyen Pays, Alpes, Geographica Bernensia, 87, 112 pp., https://doi.org/10.4480/GB2018.G87, 2012.
Jeanneret, F., Rutishauser, T., and Brügger, R.: Phänologie und Saisonalität, Geschichte, Monitoring, Raumansprache, Geographica Bernensia, 26, 179 pp., https://doi.org/10.4480/GB2018.U26, 2018.
Kottmann, S.: Topoklimatische Modellierung phänologischer Frühlingsphasen in einem Geographischen Informationssystem (GIS), Für die allgemeine Blüte der Hasel, des Löwenzahns und des Apfelbaums im Querschnitt durch Jura, Mittelland und Alpen, Geographisches Institut Universität Bern, 2008.
Lehmann, D., Wyss E., Rutishauser, T., and Brönnimann, S.: Citizen Science: Pflanzenphänologische Daten erfüllen wissenschaftliche Kriterien, Geographica Bernensia, 93, 4 pp., https://doi.org/10.4480/GB2017.G93, 2018.
Menzel, A., Sparks, T. H., Estrella, N., Koch, E., Aasa, A., Rein, A., Alm‐Kübler, K., Bissolli, P., Braslavska, O., Briede, A., Chmielewski, F.M., Crepinsek, Z., Curnel, Y., Dahl, Å., Defila, C., Donnelly, A., Filella, Y., Jatczak, K., Måge, F., Mestre, A., Nordli, Ø., Peñuelas, J., Pirinen, P., Remisová, V., Scheifinger, H., Striz, M., Susnik, A., Van Vliet, A. J. H., Wielgolaski, F.-E., Zach,S., and Zust, A.: European phenological response to climate change matches the warming pattern, Global Change Biol., 12, 1969–1976, https://doi.org/10.1111/j.1365-2486.2006.01193.x, 2006.
Messerli, B., Wanner, H., Volz, R., and Witmer, U.: Beiträge zum Klima des Kantons Bern, Jahrbuch der geographischen Gesellschaft von Bern, 52, 151 pp., 1978.
MeteoSwiss: National Climate Observing System (GCOS Switzerland), Update 2018, 116 p., available at: https://www.meteoswiss.admin.ch/content/dam/meteoswiss/en/Forschung-und-Zusammenarbeit/Internationale-Zusammenarbeit/GCOS/doc/NationalClimateObservingSystem_GCOSSwitzerland-Small.pdf (last access: 6 November 2019), 2018.
Peñuelas, J., Rutishauser, T., and Filella, I.: Phenology Feedback on Climate Change, Science, 324, 887–888, https://doi.org/10.1126/science.1173004, 2008.
Pfister, C.: Wetternachhersagem 500 Jahre Klimavariationen und Naturkatastrophen, Haupt, Bern, 1999.
Pfister, C. and White, S.: Evidence from the Archives of Societies: Personal Documentary Sources, in: The Palgrave Handbook of Climate History, edited by: White, S., Pfister, C., and Mauelshagen, F., Palgrave Macmillan, UK, 49–65, 2018.
Primault, B., Schwirzer, S., Kuhn, W., and Ambrosetti, F.: Atlas phénologique – Phänologischer Atlas – Atlante fenologico, Institut suisse de météorologie, Zurich, 65 pp., 1957.
Reid, P. C., Hari, R. E., Beaugrand, G., Livingstone, D. M., Marty, C., Straile, D., Barichivich, J., Goberville, E., Adrian, R., Aono, Y., Brown, R., Foster, J., Groisman, P., Hélaouët, P., Hsu, H.-H., Kirby, R., Knight, J., Kraberg, A., Li, J., Lo, T.-T., Myneni, R. B., North, R. P., Pounds, J. A., Sparks, T. H., Stübi, R., Tian, Y., Wiltshire, K. H., Xiao, D., and Zhu, Z.: Global impacts of the 1980s regime shift, Glob. Chang. Biol., 22, 682–703, https://doi.org/10.1111/gcb.13106.51, 2016.
Rosemartin, A. H., Denny, E. G.,Weltzin, J. F., Marsh, L., Wilson, B. E., Mehdipoor, H., Zurita-Milla, Z., and Schwartz, M. D.: Lilac and honeysuckle phenology data 1956–2014, Nature Scientific Data, 2, 150038, https://doi.org/10.1038/sdata.2015.38, 2015.
Rutishauser, T.: Historical Phenology in Central Europe, Seasonality and climate during the past 500 years, Geographica Bernensia, 82, 136 pp., 2009.
Rutishauser, T., Luterbacher, J., Jeanneret, F., Pfister, C., and Wanner, H.: A phenology-based reconstruction of inter-annual changes in past spring seasons, J. Geophys. Res., 112, G04016, https://doi.org/10.1029/2006JG000382, 2007.
Rutishauser, T., Luterbacher, J., Defila, C., Frank, D., and Wanner, H.: Swiss Spring Plant Phenology 2007: Extremes, a multi-century perspective and changes in temperature sensitivity, Geophys. Res. Lett., 35, L05703, https://doi.org/10.1029/2007GL032545, 2008.
Rutishauser, T., Jeanneret, F., Brügger, R., Auchmann, R,, Brugnara, Y., Röthlisberger, C., Dizerens, C., Villiger, L., Lehmann, D., Meyer, L., Messerli, B., and Brönnimann, S: The BernClim plant phenological data set from the Canton of Bern (Switzerland) 1970–2018, PANGAEA, https://doi.org/10.1594/PANGAEA.900102, 2019.
Schnelle, F.: Pflanzenphänologie, Probleme der Bioklimatologie Leipzig, 289 pp., 1955.
Stöckli, R., Rutishauser, T., Dragoni, D., O'Keefe, J., Thornton, P. E., Jolly, M., Lu, L., and Denning, A. S.: Remote sensing data assimilation for a prognostic phenology model, J. Geophys. Res.-Biogeo., 113, G04021, https://doi.org/10.1029/2008JG000781, 2008.
Studer, S., Appenzeller, C., and Defila, C.: Inter-annual variability and decadal trends in Alpine spring phenology: A multivariate analysis approach, Clim. Change, 73, 395–414, https://doi.org/10.1007/s10584-005-6886-z, 2005.
Vassella, A.: Phänologische Beobachtungen des Bernischen Forstdienstes von 1869 bis 1882, Witterungseinflüsse und Vergleich mit heutigen Beobachtungen, Buwal Umweltmaterialien 73, 9–75, 1997.