the Creative Commons Attribution 4.0 License.
the Creative Commons Attribution 4.0 License.
 | 12 Mar 2019
Geology datasets in North America, Greenland and surrounding areas for use with ice sheet models
Gregor Knorr
Gerrit Lohmann
The ice–substrate interface is an important boundary condition for ice sheet modelling. The substrate affects the ice sheet by allowing sliding through sediment deformation and accommodating the storage and drainage of subglacial water. We present three datasets on a 1 : 5 000 000 scale with different geological parameters for the region that was covered by the ice sheets in North America, including Greenland and Iceland. The first dataset includes the distribution of surficial sediments, which is separated into continuous, discontinuous and predominantly rock categories. The second dataset includes sediment grain size properties, which is divided into three classes: clay, silt and sand, based on the dominant grain size of the fine fraction of the glacial sediments. The third dataset is the generalized bedrock geology. We demonstrate the utility of these datasets for governing ice sheet dynamics by using an ice sheet model with a simulation that extends through the last glacial cycle. In order to demonstrate the importance of the basal boundary conditions for ice sheet modelling, we changed the shear friction angle to account for a weaker substrate and found changes up to 40 % in ice thickness compared to a reference run. Although incorporation of the ice–bed boundary remains model dependent, our dataset provides an observational baseline for improving a critical weakness in current ice sheet modelling (https://doi.org/10.1594/PANGAEA.895889, Gowan et al., 2018b).


Temperate ice sheets, such as the Laurentide and Eurasian ice sheets behaved differently depending on whether or not there was thick, continuous unconsolidated sediments underneath the ice (Clark and Walder, 1994). These sediments provided a potential pathway for subglacial water storage and drainage. Areas in which crystalline bedrock is predominant at the surface tend to have eskers, indicating that subglacial water drained via large tunnel systems (Clark and Walder, 1994; Storrar et al., 2014). The subglacial drainage where the surface is covered by continuous, unconsolidated sediment tends to be via linked channel systems (Carlson et al., 2007). The main cause of these different drainage regimes is likely related to the roughness of the bed (i.e. in areas with sediment cover, the surface is smoothed by the glacier, while in areas with bedrock outcrops will be more irregular). Sediment deformation in areas with continuous cover is also hypothesized to play a prominent role in the motion of glaciers (Boulton et al., 2001; Evans et al., 2006), possibly also including decoupling with the underlaying, non-deforming surfaces (Kjær et al., 2006). When sediments become water saturated, they become mechanically weaker than the overlying ice. If this happens, it causes a decoupling from the underlying bed and allows the ice to flow faster than with ice deformation alone. Whether or not this mechanism could have been spatially and temporally pervasive is still open to debate (Piotrowski et al., 2004; Iverson and Zoet, 2015).
In North America, there was a distinct difference in ice sheet behaviour between the sparsely covered Canadian Shield and the sediment-covered sedimentary basins at the southern and western fringes, and Hudson Bay and the Foxe Basins in the center and north. The most striking imprint of this in the geomorphological record is the reduced number of ice streams on much of the Canadian Shield, while areas covered with continuous sediments have many (Margold et al., 2015). The presence or absence of available unconsolidated sediment influenced the distribution of ribbed moraine, drumlins and eskers on the Canadian Shield (Aylsworth and Shilts, 1989). Retreat of the Laurentide Ice Sheet after the Last Glacial Maximum (LGM) also slowed when the ice sheet became confined to the Canadian Shield (Dyke, 2004). During the advance of the ice sheet prior to the LGM, the margin remained close to the Canadian Shield boundary until the ice sheet reached a threshold that allowed it to advance onto the surrounding plains (Dyke et al., 2002). The part of the ice sheet that covered the plains had a low profile relative to the Canadian Shield, which has been attributed to this contrast in basal conditions (Fisher et al., 1985; Licciardi et al., 1998; Gowan et al., 2016).
Having realistic basal conditions is essential in numerical ice sheet modelling. Many ice sheet modelling studies of the Laurentide Ice Sheet (Calov et al., 2002; Tarasov and Peltier, 2004; Gregoire et al., 2012; Abe-Ouchi et al., 2013) used the global sediment thickness map (Laske and Masters, 1997), which was designed for seismology applications rather than surficial processes. This dataset reflects the thickness of Phanerozoic sedimentary rock that has not undergone significant metamorphism. This map does not reflect the actual distribution of unconsolidated sediments, as many regions of the Canadian Shield do have continuous sediment cover (Aylsworth and Shilts, 1989), and there are regions of discontinuous unconsolidated sediment cover where there is sedimentary bedrock (Fulton, 1995; Soller and Garrity, 2018). This dataset also misses Precambrian sedimentary basins that are overlain by unconsolidated sediments that were modified by ice sheets (Cofaigh et al., 2013). The direct impacts on ice sheet dynamics may only depend on the uppermost few metres of unconsolidated sediment (Boulton et al., 2001; Iverson and Zoet, 2015), so this map may not be representative of the sediment properties that affected the ice sheet. More recently, Stokes et al. (2012) and Tarasov et al. (2012) used a more complete parameterization with additional data from the surficial materials map by Fulton (1995). They use a parameter from 0 (no sediments) to 1 (pervasive sediments). Previous modelling studies did not directly account for variability in the grain size or other properties of the sediments.
In order to gain flexibility in parameterizing sediment parameters for ice sheet modelling, we present three datasets. These data come from existing surficial geological maps when possible and are inferred from other studies where coverage is not complete. (i) The sediment distribution dataset contains information on the distribution of sediment cover, whether continuous, veneer, or dominantly bedrock. (ii) The sediment grain size dataset contains information on the average grain size of the sediments. This is based on common geological descriptions of sandy, silty and clay-rich diamicton and glacial sediments. (iii) The bedrock geology dataset contains the generalized bedrock type, including distinctions between sedimentary, igneous and metamorphic rock. These data can be used in a variety of ways, such as by changing the mechanical strength and frictional resistance of the sediment (such as the shear friction angle), effects of hydrology (porosity and permeability of the sediments or rock, type of drainage), roughness of the bed and the erodibility of substrate.
2.1 Overview and construction
In order for a dataset to be usable in ice sheet models, it is necessary for it to be continuous. Since existing geological map datasets are discontinuous due to the presence of post-glacial sediments and water bodies (Fig. 1), we had to fill in these gaps. These datasets include supplementary information from geophysical surveys and coring studies to compliment existing maps. We also made an inference on grain size properties in the vast regions without information by using geological maps. We want to emphasize that these datasets are low-resolution generalized representations of geological properties. The intended use is for relatively low-resolution ice sheet simulations (i.e. 5 km or greater) and are not likely to be appropriate for resolving higher-resolution features.
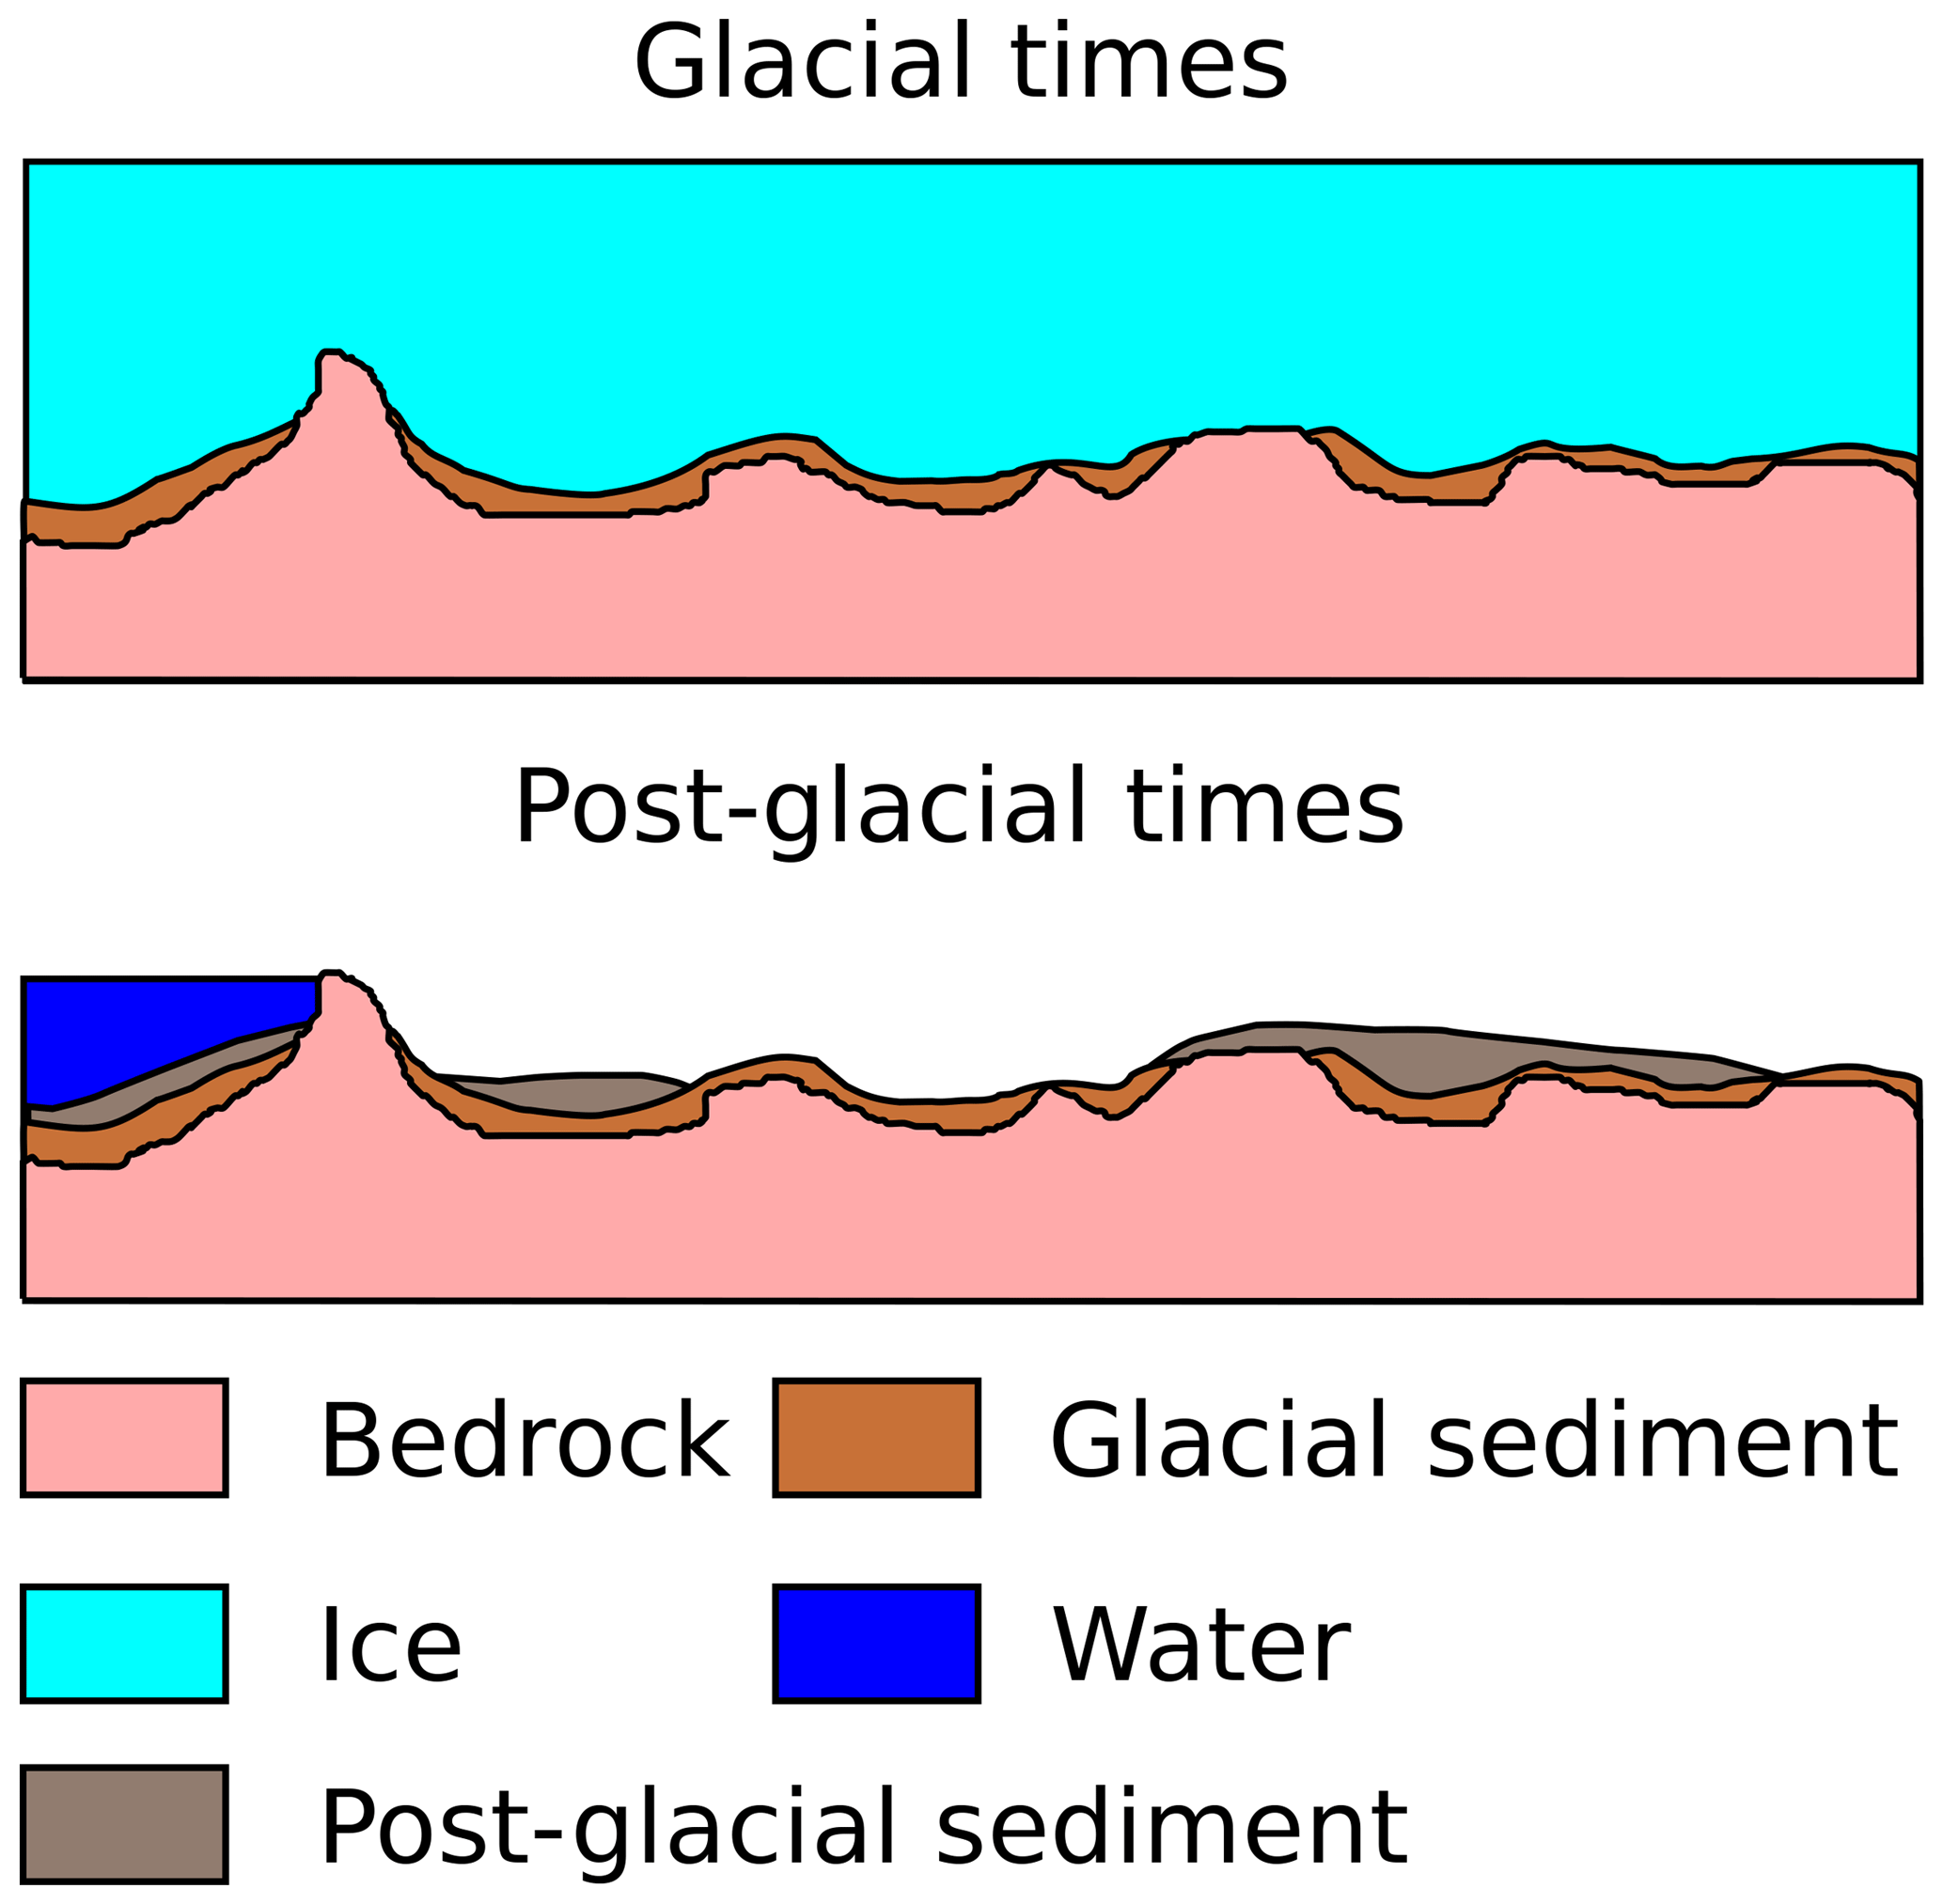
Figure 1Illustration showing the relationship between the bedrock, glacial sediments and postglacial sediments. In glacial times, the ice sheet is in contact with glacial sediments created by the ice sheet itself and bedrock. In post-glacial times, the bedrock and glacial sediments can be obscured by water bodies and post-glacial sediments.
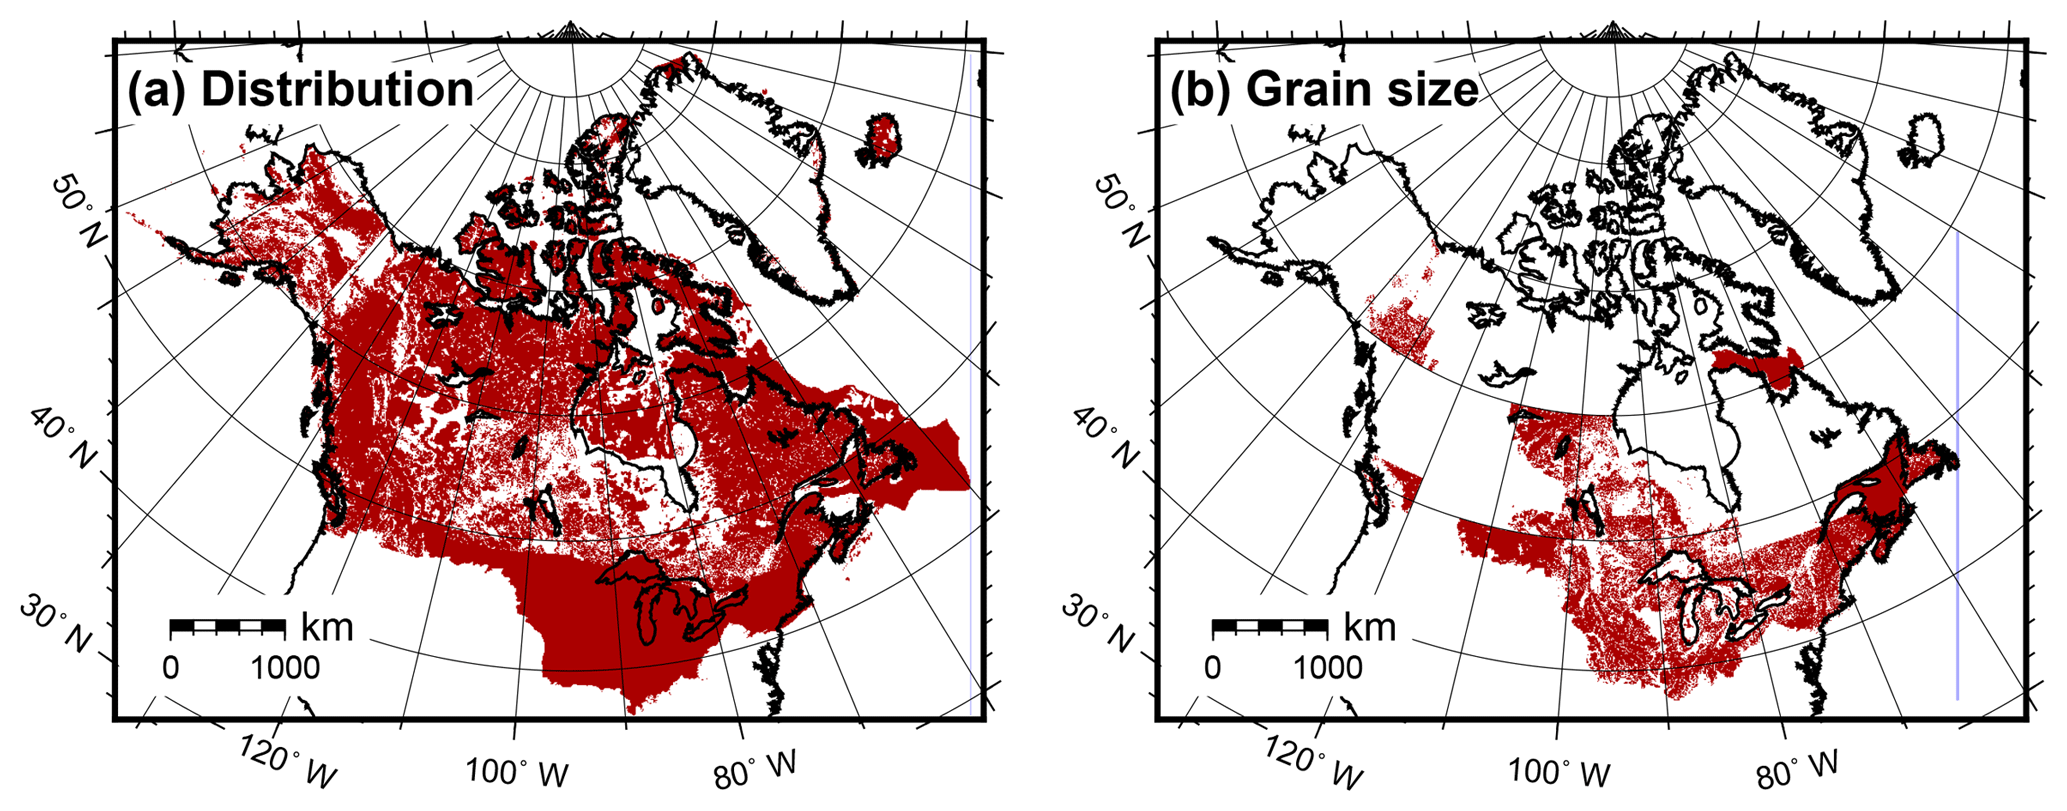
Figure 2Data coverage (brown areas) derived directly from surficial geology maps. (a) Sediment distribution and (b) sediment grain size.
With this dataset, the goal is to represent the subglacial sediment properties for the most recent glaciation, the late Wisconsin glaciation in North America, for use in paleo-ice sheet modelling and reconstruction. The late Wisconsin happened between about 31 000 and 34 000 yr BP (years before present) to about 7000 yr BP (Dyke et al., 2002). For ice sheet modelling, using the modern-day distribution and composition of glacial sediments is likely sufficient to use as a boundary condition for the most recent glacial period, though further back in time, this assumption may not be valid (Clark and Pollard, 1998). There are great uncertainties in many of the boundary conditions used in ice sheet modelling, such as uncertainties in past atmospheric and ocean conditions, but sediment cover likely does not change that greatly in a single glaciation (Piotrowski et al., 2001), so we do not feel this is a major setback for the use of this dataset. Also, in areas with crystalline bedrock, it is possible for surfaces to be unmodified by glacial action (Corbett et al., 2016). We want to emphasize that the categories chosen for this dataset are simplified from some of the original data sources in order to make it easier for ice sheet modellers to manipulate a limited range of parameters, rather than match specific geological observations that may only be applicable very small regions. The lack of sediment grain size information over much of Canada also precludes a large range of geological parameters. When ice sheet modelling, it is necessary to have continuous boundary conditions over the whole domain. In areas without geological information, it is necessary to make inferences on the properties based on alternative sources of information, such as bedrock geology maps.
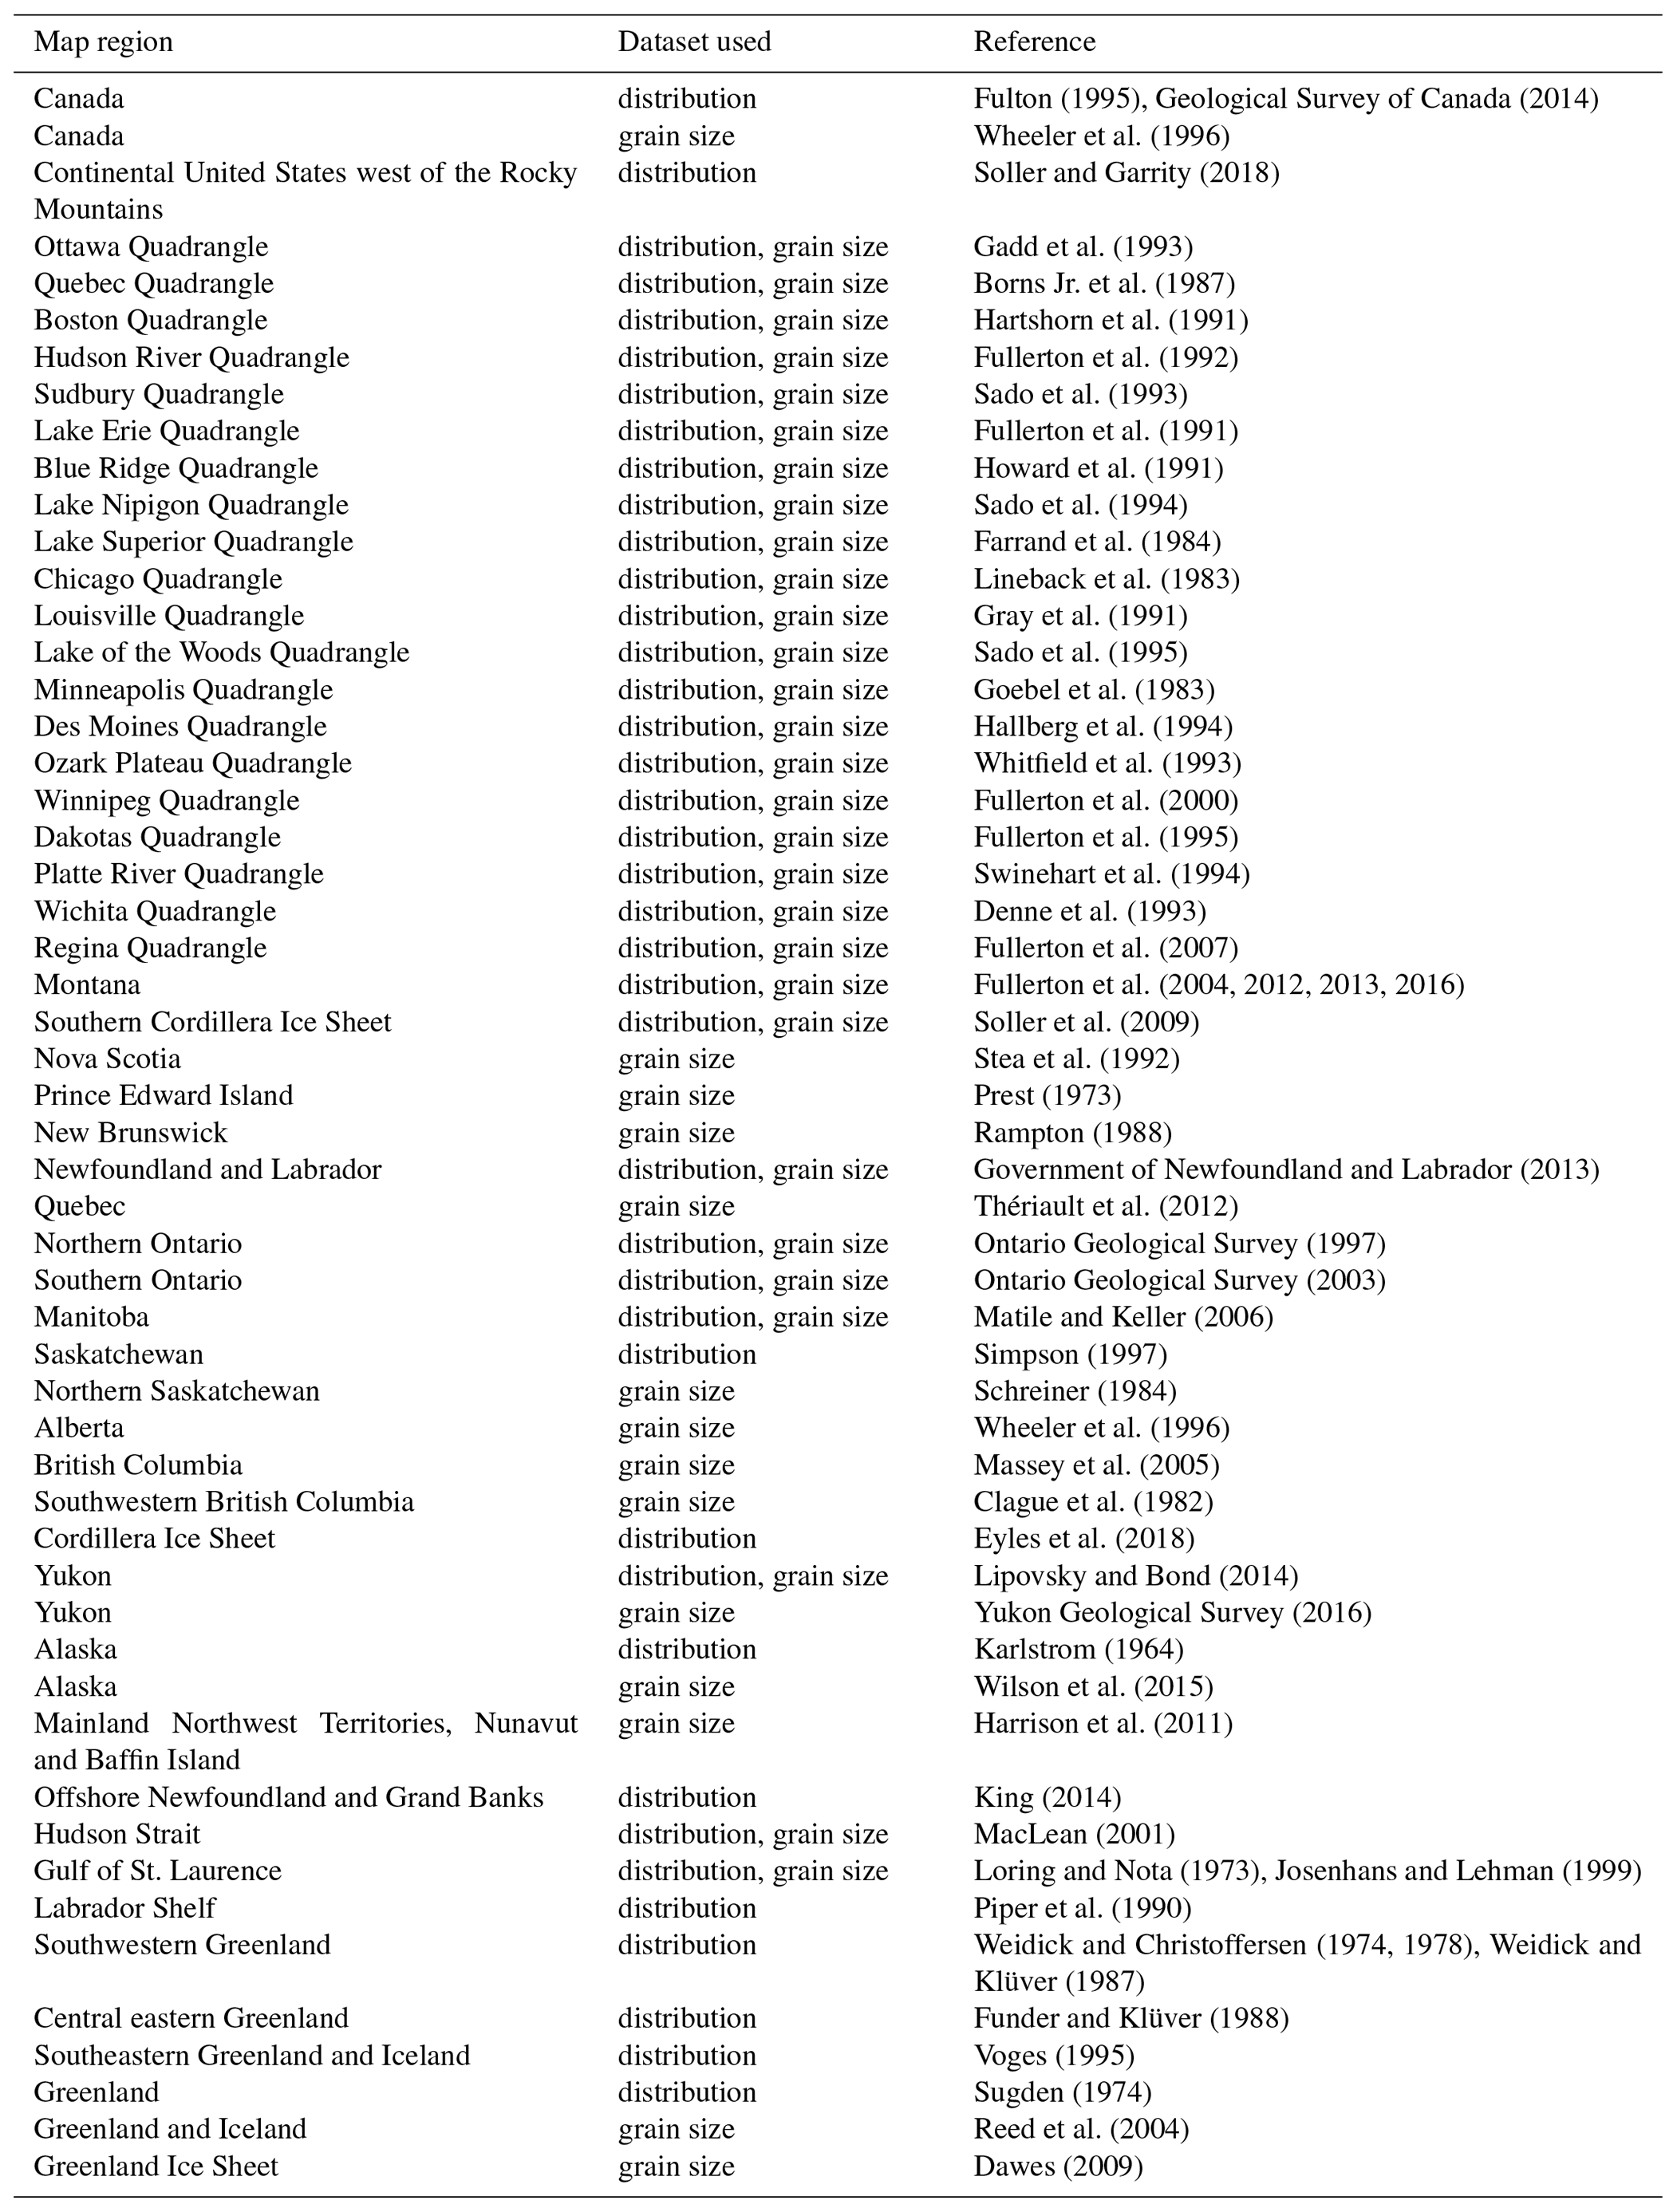
The three datasets are largely based on existing surficial and bedrock geology maps (Table 1). Wherever possible, we used the most up-to-date regional scale (i.e. >1 : 500 000 scale) maps in order to make it possible to construct the entire dataset in a reasonable amount of time. For the sediment distribution data, where there was overlap with the map by Fulton (1995), we favoured the more recent dataset. The first step was to import the existing shapefiles of the maps (or digitizing paper maps if not available) and break up the units into the classification schemes that we are using. This involved removing any water bodies and post-glacial sediment units from the maps and simplifying glacial geological units that had a more complex scheme than we use. The resulting datasets have gaps. Figure 2 shows the data coverage purely from surficial geology maps. To fill in the gaps, we expanded the polygons in a way to favour the dominant unit in the region, or to extend the trend of elongated units. The datasets were edited using ArcGIS and QGIS.
Fulton (1995)Geological Survey of Canada (2014)Wheeler et al. (1996)Soller and Garrity (2018)Gadd et al. (1993)Borns Jr. et al. (1987)Hartshorn et al. (1991)Fullerton et al. (1992)Sado et al. (1993)Fullerton et al. (1991)Howard et al. (1991)Sado et al. (1994)Farrand et al. (1984)Lineback et al. (1983)Gray et al. (1991)Sado et al. (1995)Goebel et al. (1983)Hallberg et al. (1994)Whitfield et al. (1993)Fullerton et al. (2000)Fullerton et al. (1995)Swinehart et al. (1994)Denne et al. (1993)Fullerton et al. (2007)Fullerton et al. (2004, 2012, 2013, 2016)Soller et al. (2009)Stea et al. (1992)Prest (1973)Rampton (1988)Government of Newfoundland and Labrador (2013)Thériault et al. (2012)Ontario Geological Survey (1997)Ontario Geological Survey (2003)Matile and Keller (2006)Simpson (1997)Schreiner (1984)Wheeler et al. (1996)Massey et al. (2005)Clague et al. (1982)Eyles et al. (2018)Lipovsky and Bond (2014)Yukon Geological Survey (2016)Karlstrom (1964)Wilson et al. (2015)Harrison et al. (2011)King (2014)MacLean (2001)Loring and Nota (1973)Josenhans and Lehman (1999)Piper et al. (1990)Weidick and Christoffersen (1974, 1978)Weidick and Klüver (1987)Funder and Klüver (1988)Voges (1995)Sugden (1974)Reed et al. (2004)Dawes (2009)Table 1Maps used for the creation of the distribution and grain size dataset.
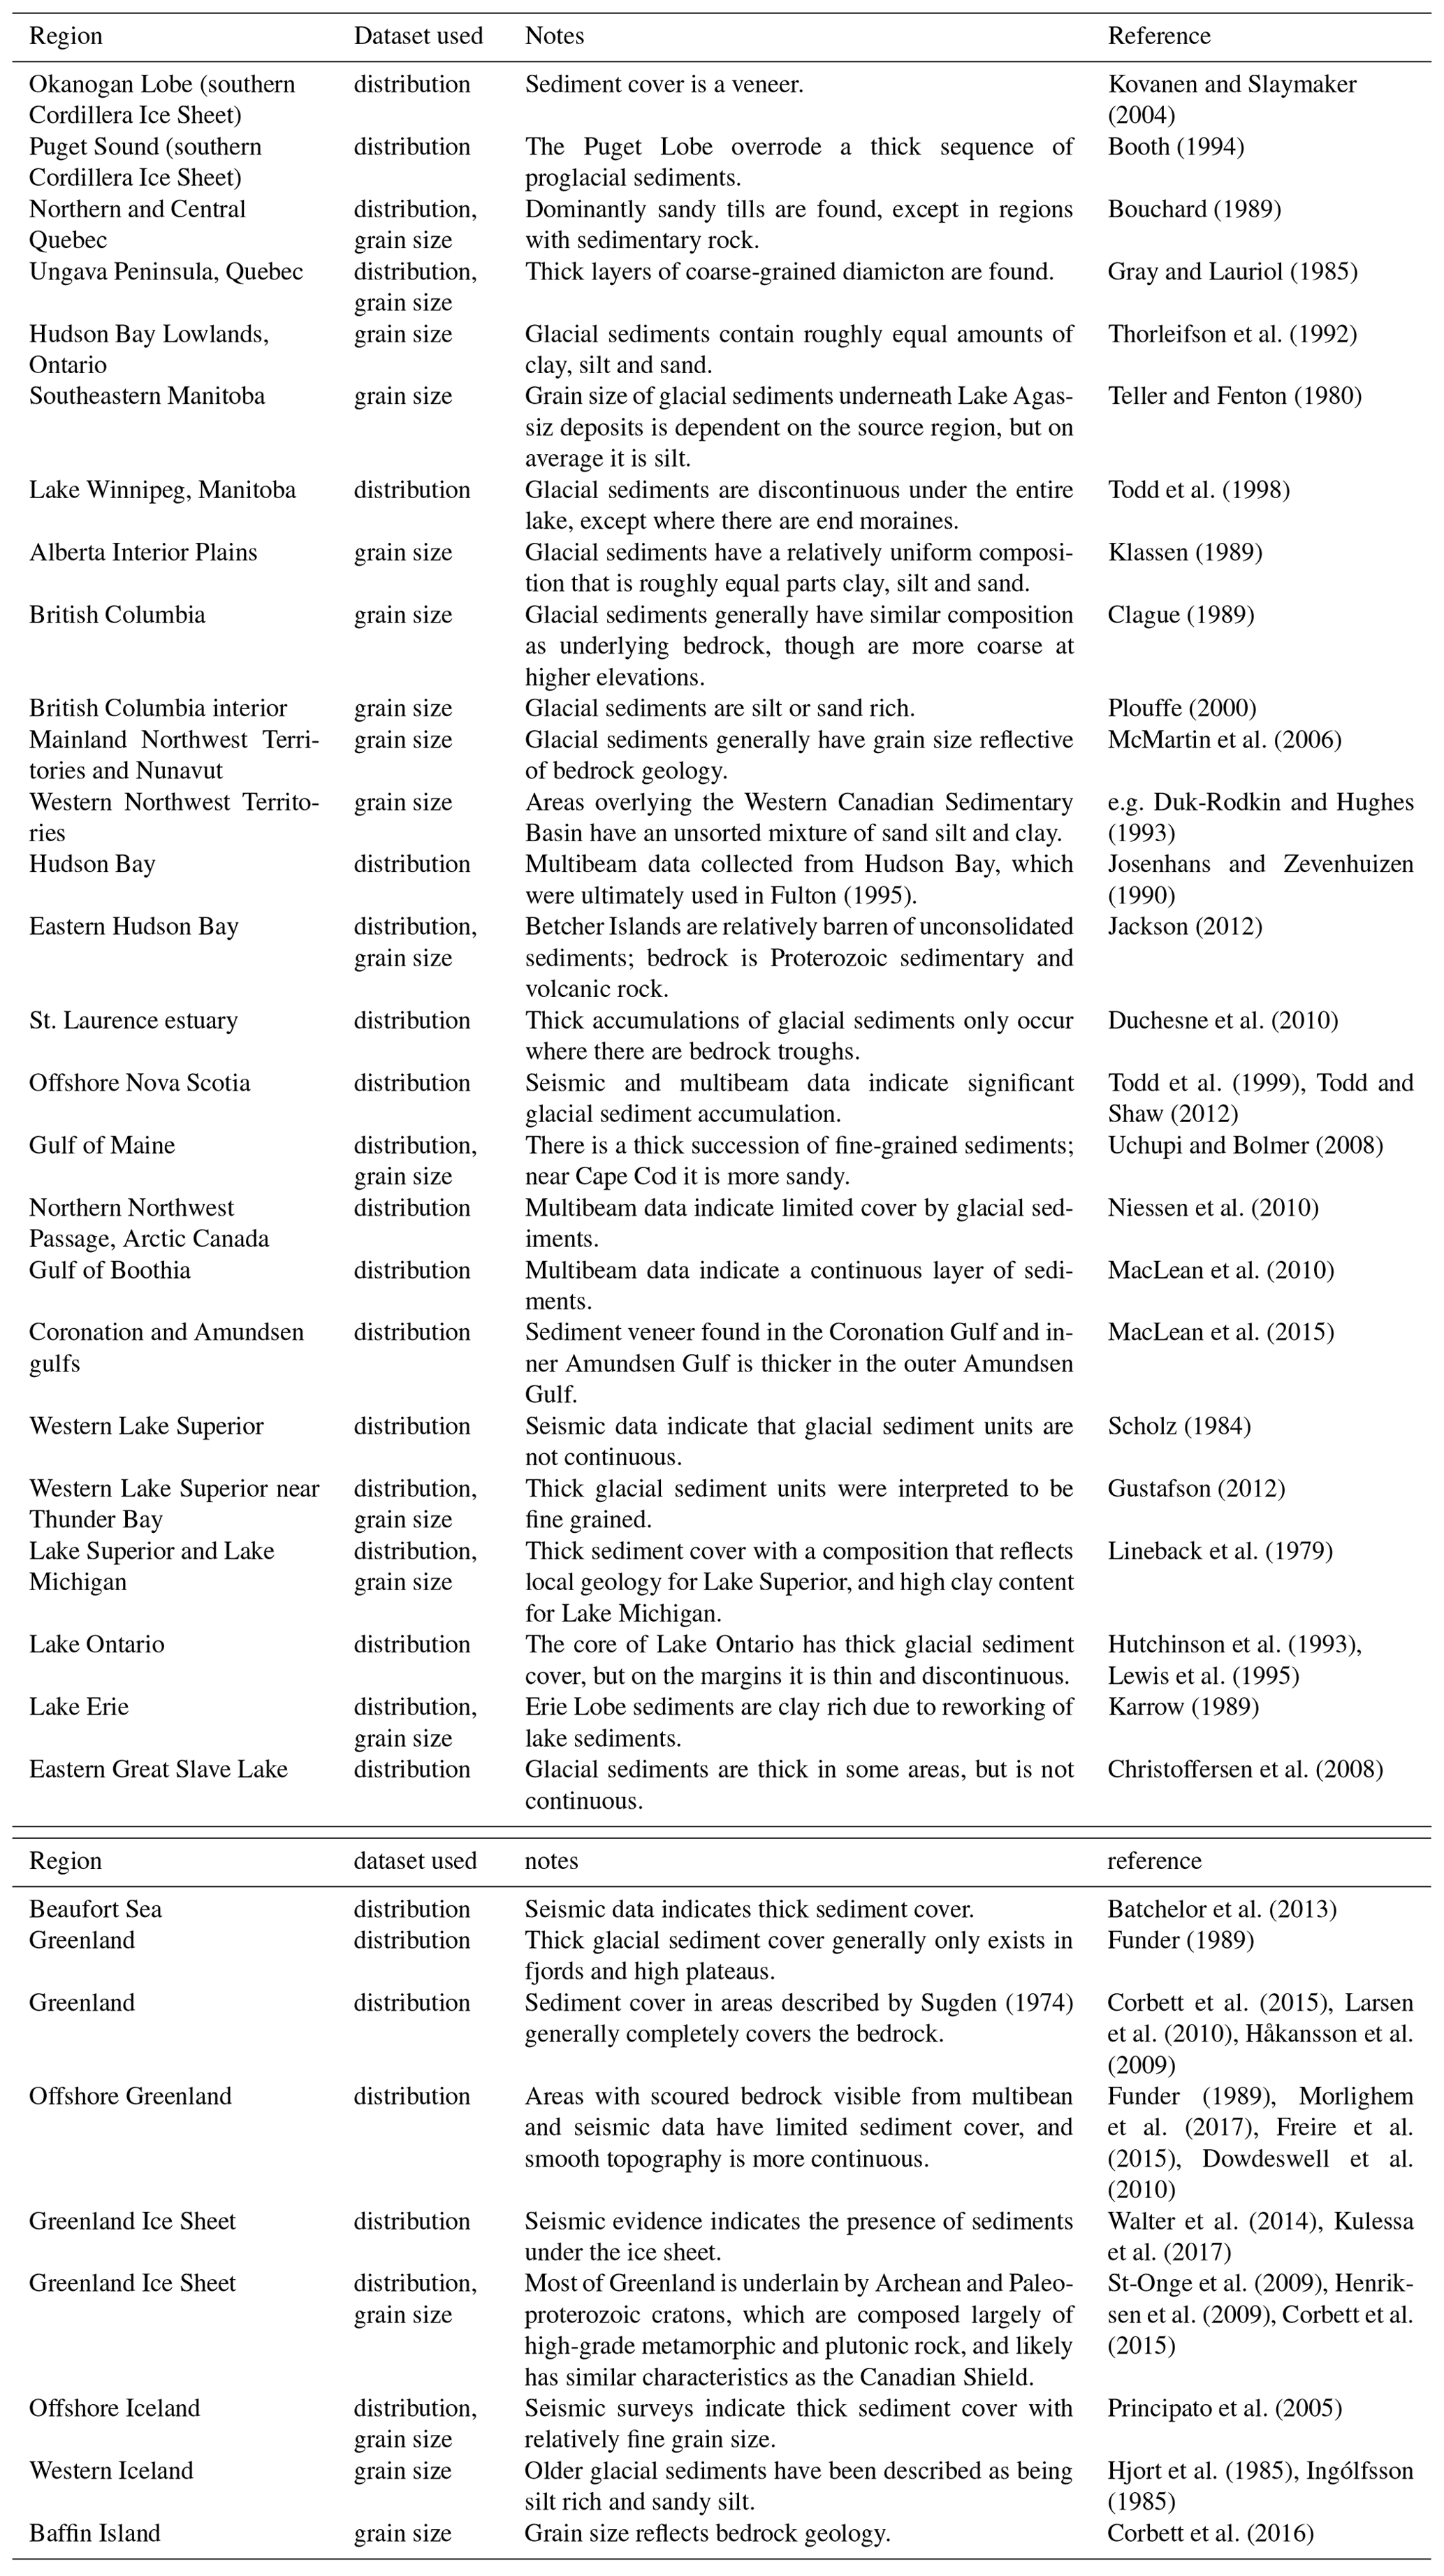
There are many areas where late Wisconsin till is buried by glacio-fluvial and Holocene non-glacial sediments, so the nature or existence of glacial sediments is uncertain. This is also true for previously glaciated areas under lakes and the oceans and places currently covered in glaciers, ice caps and the Greenland Ice Sheet. In these regions, we tried to find published sediment cores, sedimentary sections and geophysical data that can be used to estimate the properties of the sediments (Table ).
We incorporate sediment data from areas outside of the late Wisconsin limit, as in an ice sheet simulation, the exact margin of the ice sheet is unlikely to match the geologically constrained limit and could become more expansive. For areas south of the Laurentide Ice Sheet limit, there is glacial sediment from more extensive, older glaciations. These data were taken from the US quadrangle maps (Table 1). In other areas, such as Alaska and offshore regions, we take the properties from non-glacial sediments and inferences from bedrock geology maps.
Kovanen and SlaymakerBooth (1994)Bouchard (1989)Gray and Lauriol (1985)Thorleifson et al. (1992)Teller and Fenton (1980)Todd et al. (1998)Klassen (1989)Clague (1989)Plouffe (2000)McMartin et al. (2006)Duk-Rodkin and Hughes (1993)Fulton (1995)Josenhans and Zevenhuizen (1990)Jackson (2012)Duchesne et al. (2010)Todd et al. (1999)Todd and Shaw (2012)Uchupi and Bolmer (2008)Niessen et al. (2010)MacLean et al. (2010)MacLean et al. (2015)Scholz (1984)Gustafson (2012)Lineback et al. (1979)Hutchinson et al. (1993)Lewis et al. (1995)Karrow (1989)Christoffersen et al. (2008)Batchelor et al. (2013)Funder (1989)Sugden (1974)Corbett et al. (2015)Larsen et al. (2010)Håkansson et al. (2009)Funder (1989)Morlighem et al. (2017)Freire et al. (2015)Dowdeswell et al. (2010)Walter et al. (2014)Kulessa et al. (2017)St-Onge et al. (2009)Henriksen et al. (2009)Corbett et al. (2015)Principato et al. (2005)Hjort et al. (1985)Ingólfsson (1985)Corbett et al. (2016)Table 2Supplementary resources used for the creation of the distribution and grain size dataset.
In the creation of the dataset, existing shapefile compilations were used if available, which have variable resolution. To simplify the datasets when the originals were at high resolution, we used the bend simplify tool in the ARCGIS Cartography/generalization Toolbox, with a tolerance of 5 km and minimum area of 25 km2. This is visually similar to the generalization that was used in the surficial materials map by Fulton (1995). Any polygon that had a total area that was less than 2.25 km2 was merged with the polygon that had the largest shared border to further simplify the dataset. The final dataset is presented as shapefiles that are compatible with GIS programs, as well as 5 km resolution NetCDF files.
2.2 Sediment distribution dataset
The map of glacial sediment distribution is shown in Fig. 3. Data sources for this dataset are shown in Table 1. By “glacial sediment” we are referring to sediment that is produced as a direct result of glacial action. In a generic sense, it is synonymous with diamicton or till, an unsorted sediment with grain size ranging from clay to boulder. When possible, we try to determine the distribution of glacial sediments in extensive areas covered by post-glacial cover and water bodies (Fig. 1; see Table for sources). Many maps used in this dataset only give qualitative descriptions of the distribution, and the definition often varies between mappers. As a result, it is not possible to give an exact range for sediment thickness or percentage sediment cover. We recommend that modellers explore a range of values. Figure 4 shows the relationship between the three classes with the cover over bedrock. A detailed explanation for the distribution units, which is based on the scheme found on the Surficial Materials of Canada map by Fulton (1995) is as follows.
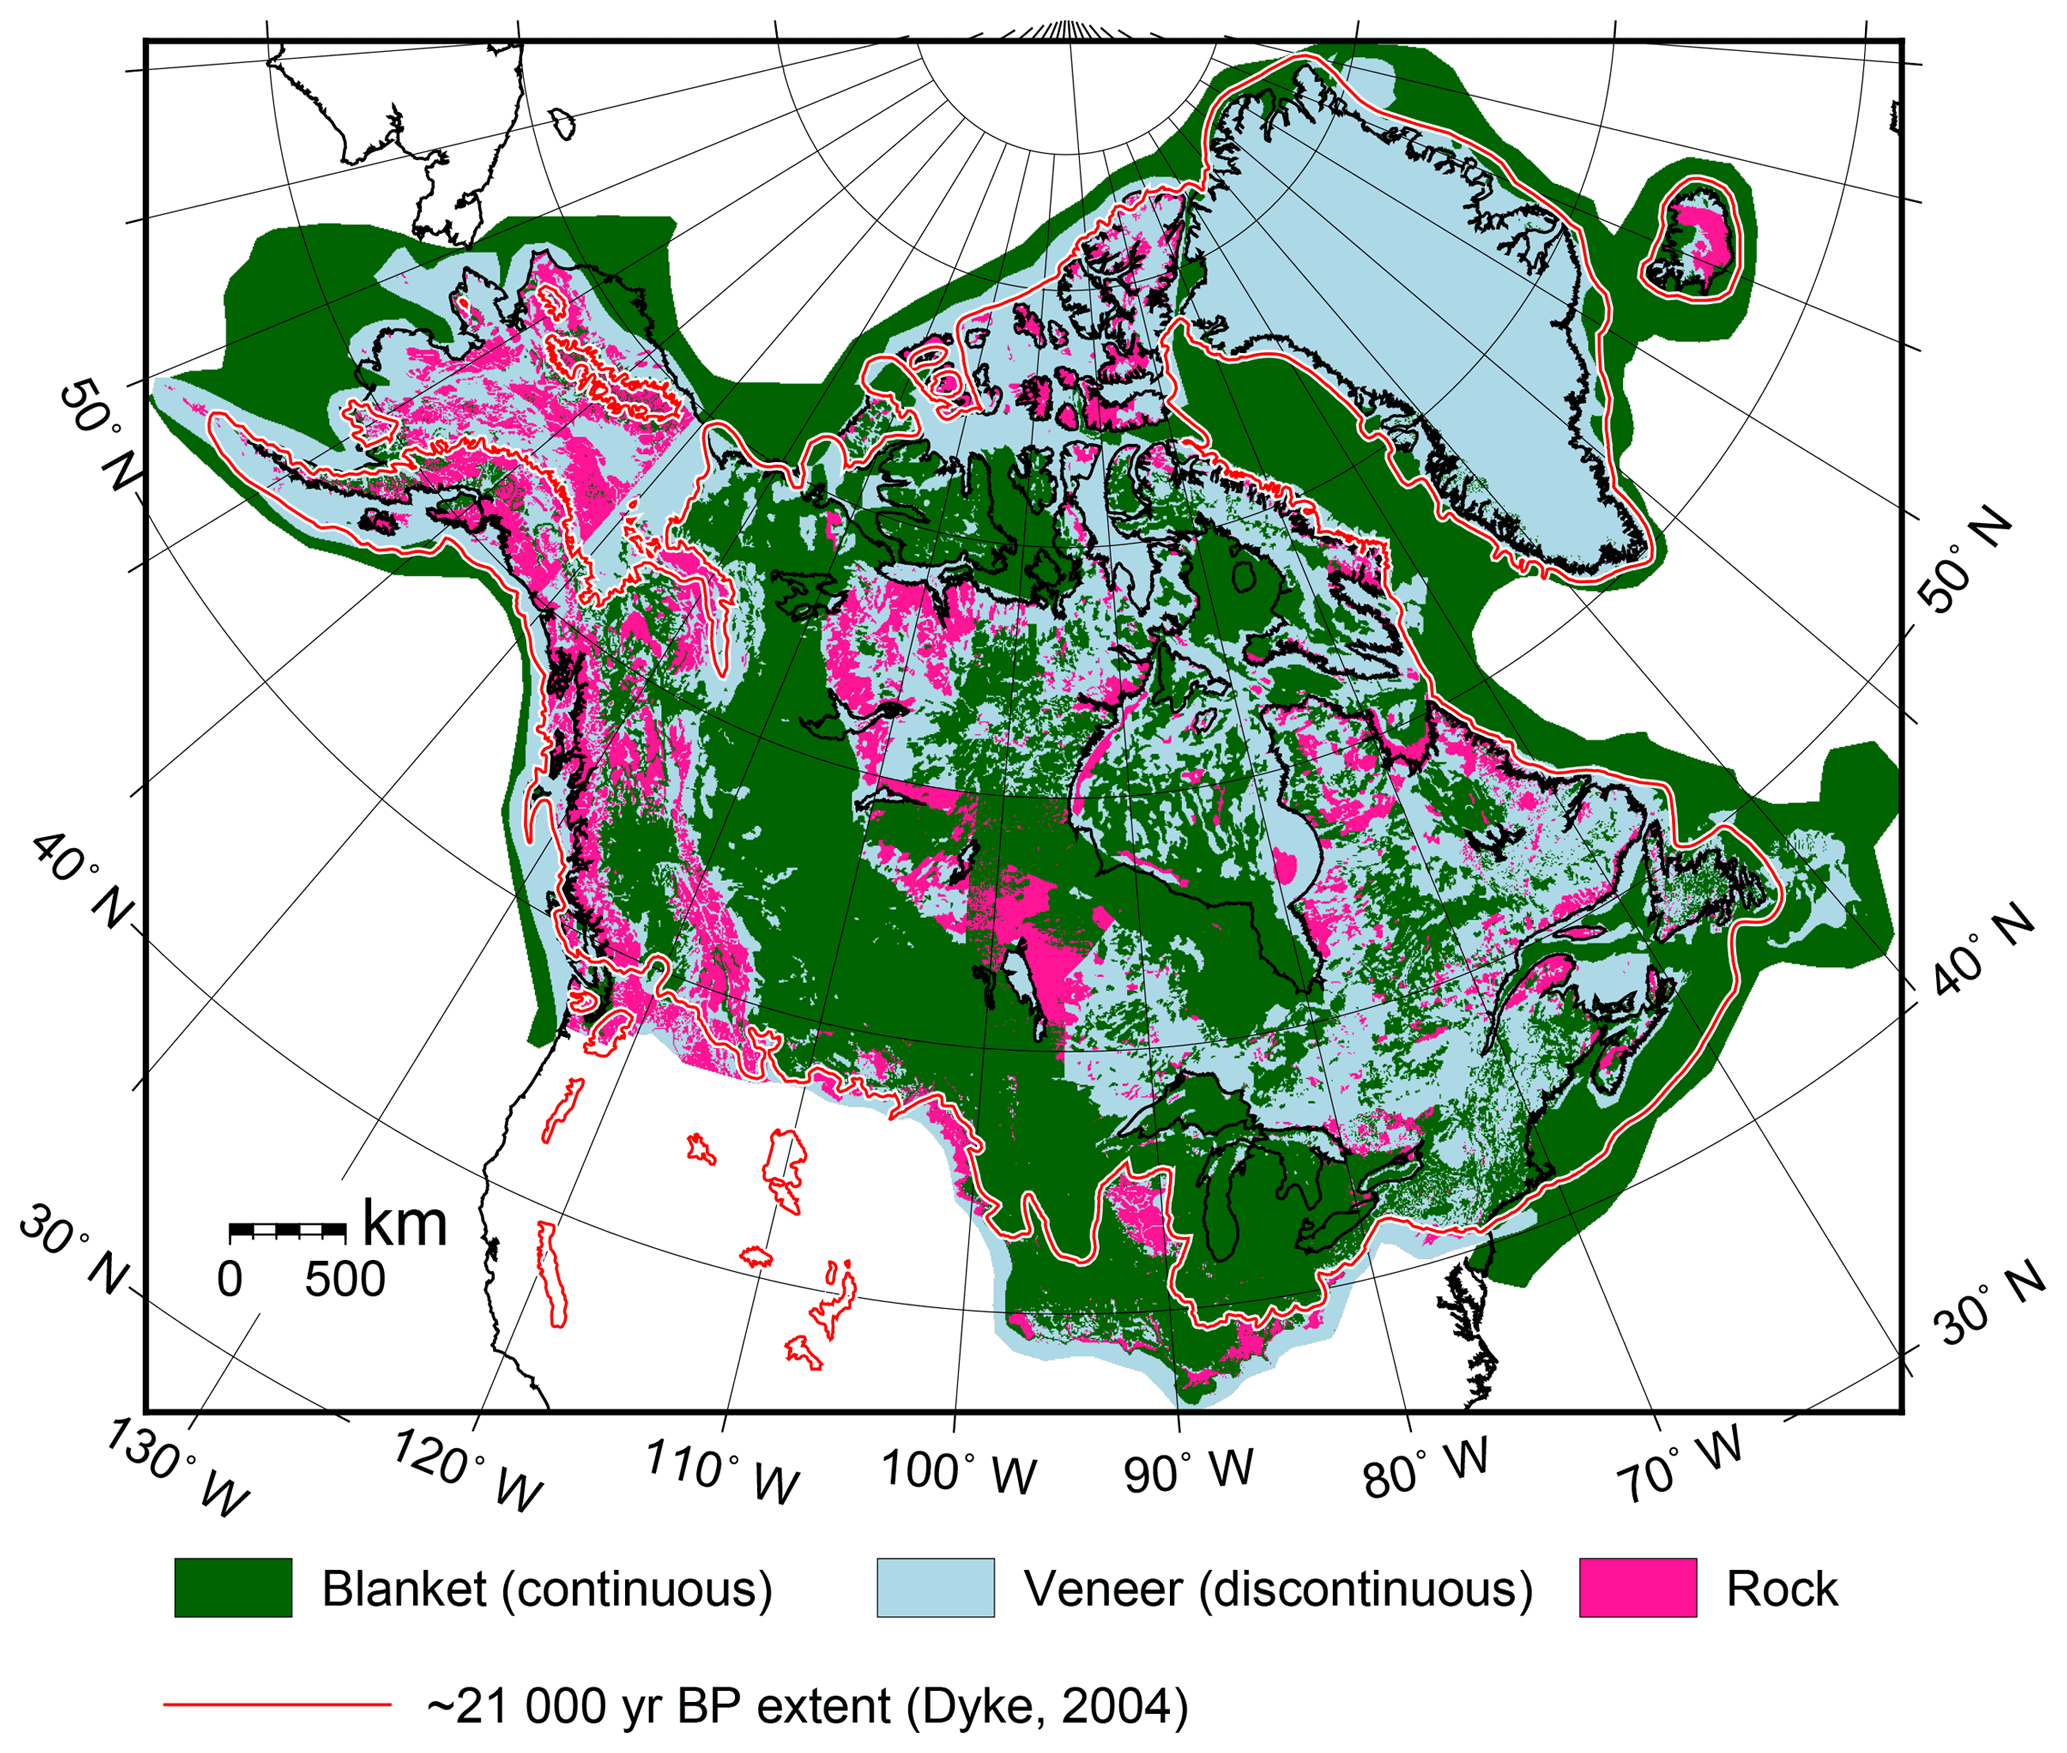
Figure 3Sediment distribution. The red line is the glacial limit during the Last Glacial Maximum, 21 000 yr BP (thousands of years ago). Blanket regions are where unconsolidated sediments form a continuous surface, veneer regions have variable amounts of rock outcrops and discontinuous sediment cover, while rock areas have little or no sediment cover.
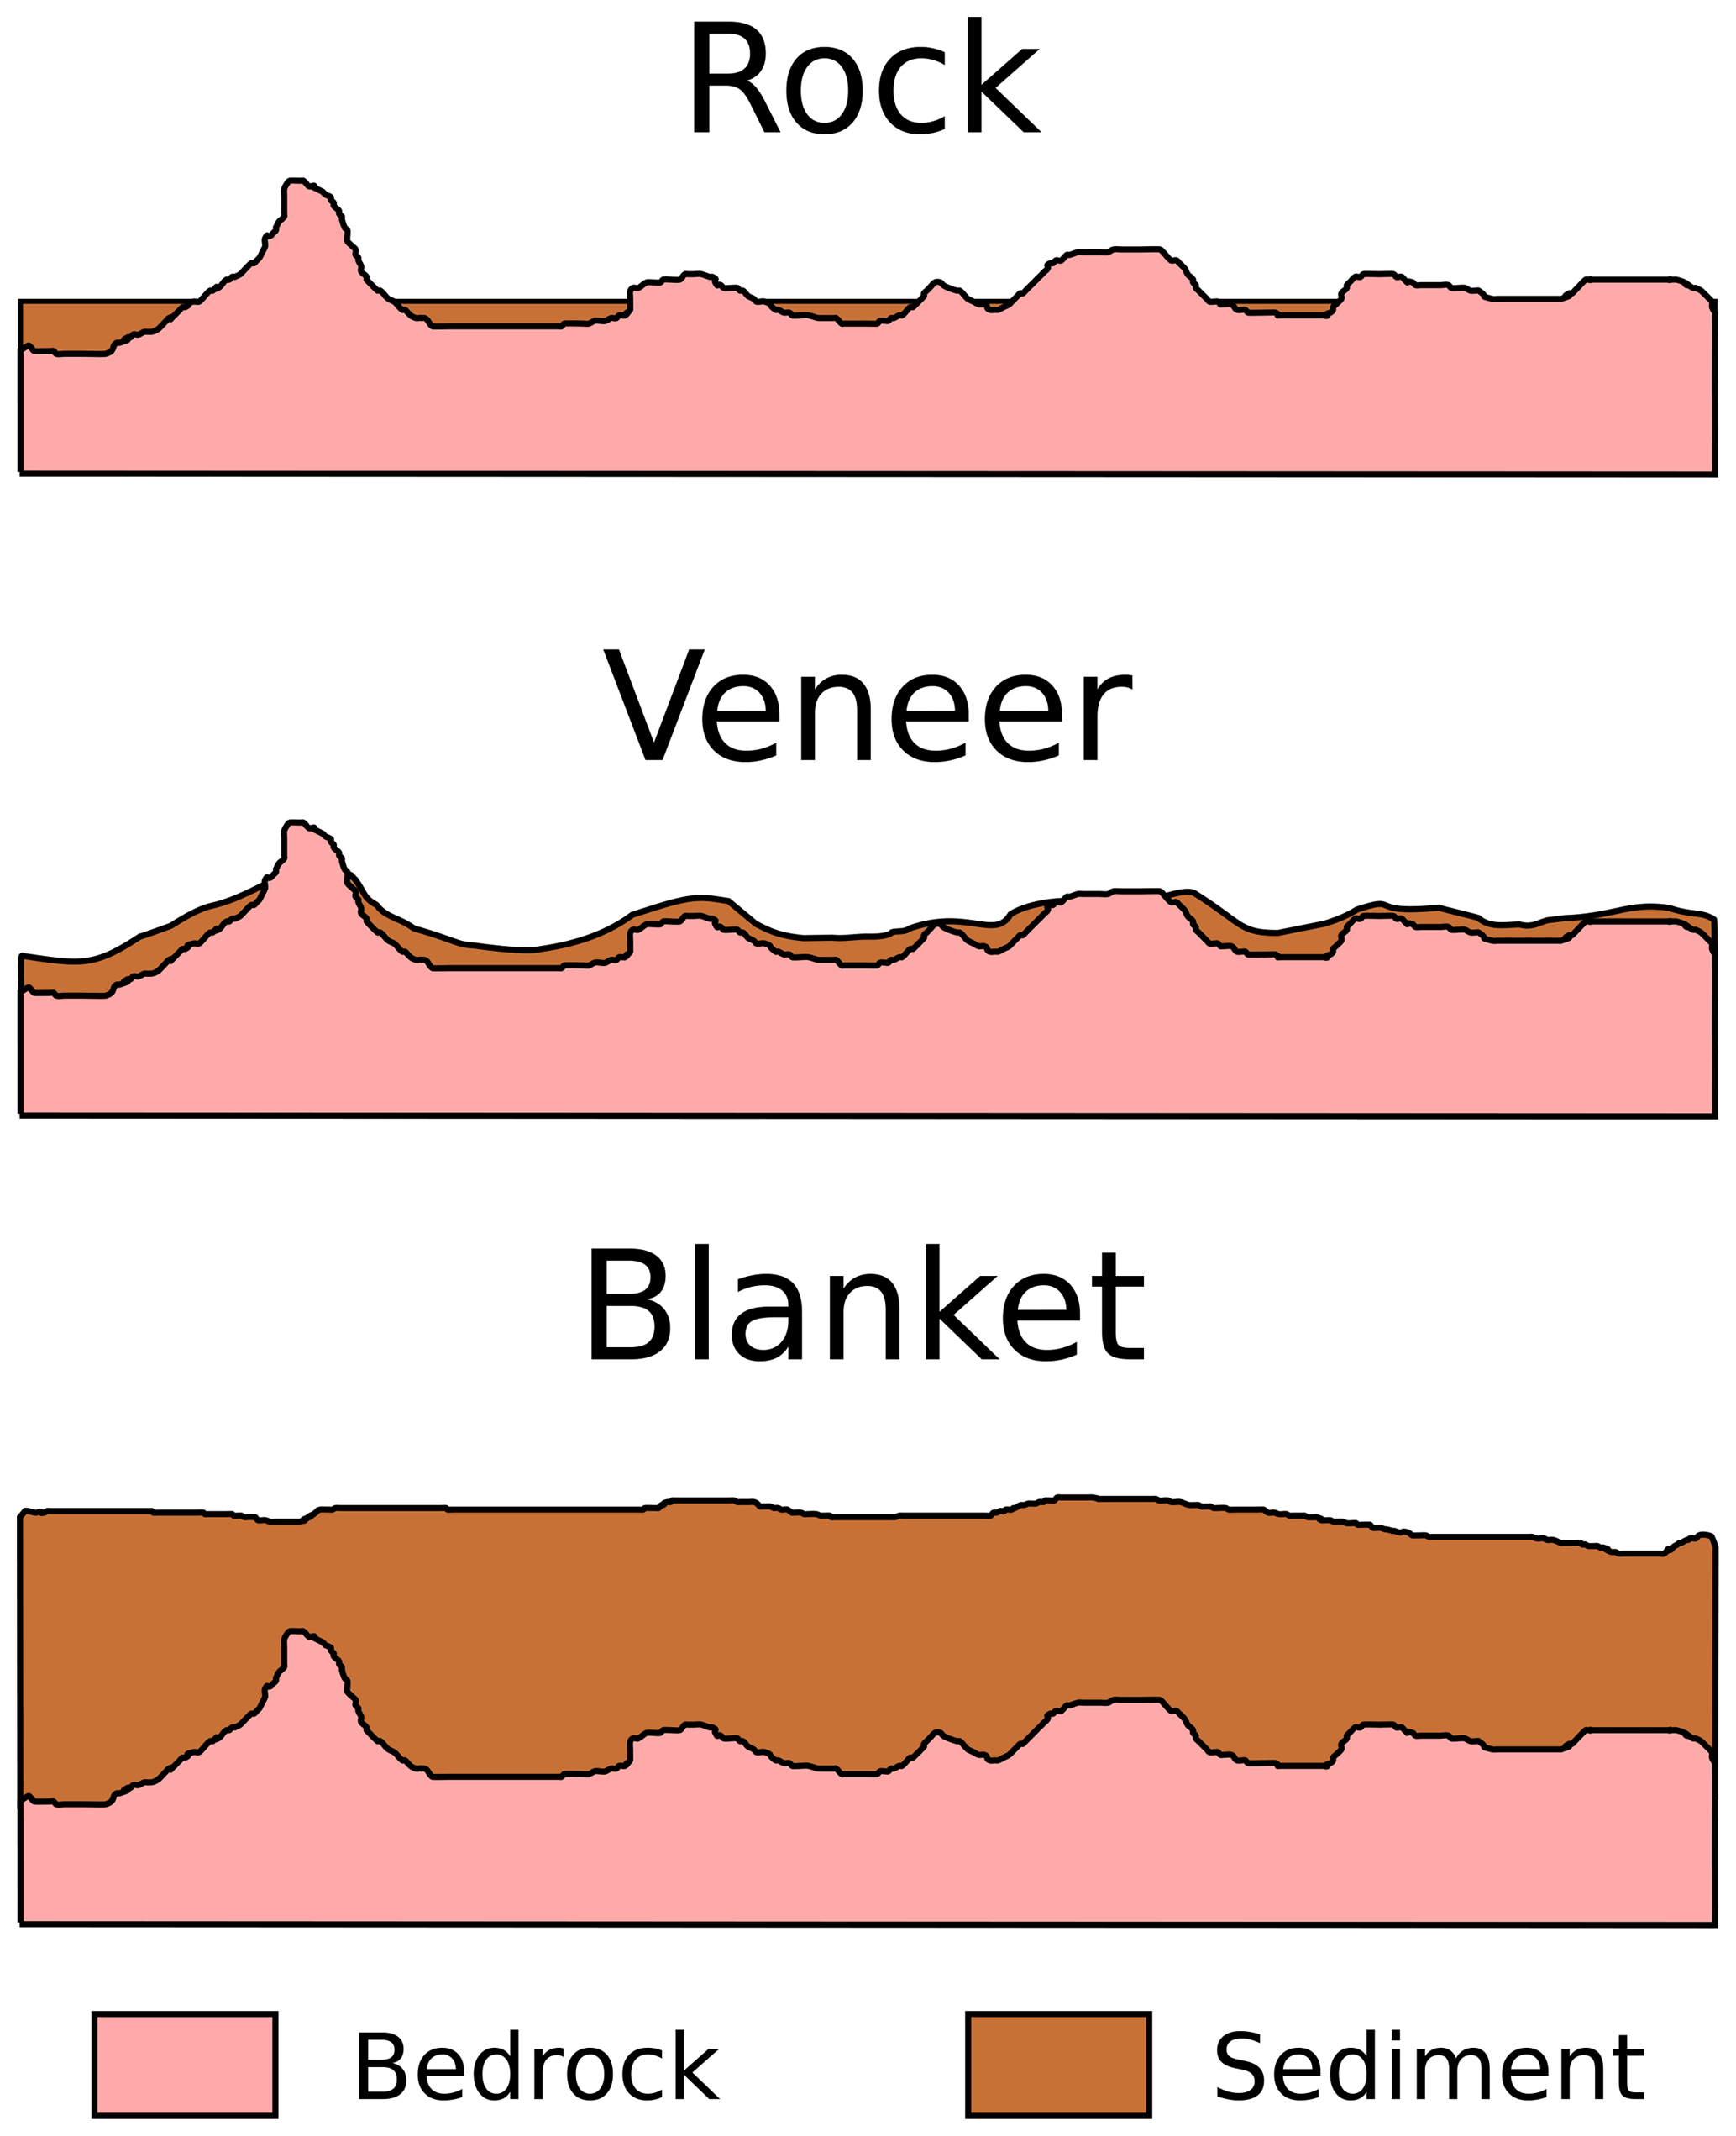
Figure 4Illustration of how the sediment distribution relates to the underlying bedrock and thickness of the sediments. The rock class has only isolated patches of sediment, the veneer class has a thin sediment layer with bedrock outcrops and a visible influence of bedrock topography on the surface, while with the blanket class, the sediments completely obscure the bedrock surface.
Rock. Bedrock outcrops are predominant (>75 % of the surface area is exposed bedrock; Fulton, 1995) and extensive glacial sediment deposits are rare. We include “regolith” areas in the northern Canadian archipelago, which were not pervasively affected by late Wisconsin glaciation (even if the upper layer was not well consolidated) and therefore do not produce glacial sediment deposits.
Veneer. Many maps seem to have a different definition of what “veneer” means. In general, it means that glacial sediment deposit are discontinuous (can be zero thickness), but the area covered in glacial sediment exceeds that of exposed rock. The topography of the underlying bedrock is usually visible in these areas. In most maps, these areas have thin cover, with “thin” being defined as anything between less than 1 m and as much as 10 m. Commonly, the cutoff is set to be 2–3 m, although some maps (e.g. the Surficial Materials map of Canada by Fulton, 1995) do not explicitly state a value. A recommended thickness value setting for veneer areas should be less than 3 m to conform to the most common description of “veneer” provided in maps used in this dataset, though even a thin layer of glacial sediment might affect the dynamics of an ice sheet (Evans et al., 2006).
Blanket. These regions are defined as regionally continuous glacial sediment. As with the “veneer” classification, it is not always clear what thickness or distribution is used as a threshold for defining “blanket”. If values are given, the threshold is usually greater than 3 m. In areas with a blanket of sediment, the underlying bedrock topography is generally not obvious. Glacial sediment units that are described as “hummocky” are included in this definition. These glacial sediments formed during stagnation of the ice sheet and are commonly found on elevated regions in western Canada (Eyles et al., 1999). The thickness can vary from a few metres to more than 25 m, but it is assumed here that these deposits are at least 3 m and can be put into the blanket definition.
A scheme similar to this has been used in the studies by Hildes et al. (2004) and Melanson et al. (2013) for use in the modelling of sediment transport. The difference in our dataset is that we explicitly do not include post-glacial sediments and instead try to fill these gaps with supplemental information.
2.3 Sediment grain size dataset
The map of generalized grain size of glacial sediments is shown in Fig. 5. A glacial sediment, diamicton or till (the later has a definitive glacial origin) is an unsorted material with grain size ranging from clay to boulder. Glacial sediments generally have a bimodal grain size distribution, with peaks in the coarse (pebble to boulder) and fine (clay to sand) fractions (Dreimanis and Vagners, 1971). The relative amount of coarse to fine material is dependent on the distance from the source of the coarse material, so on glacial geology maps and datasets, glacial sediments are described in terms of the fine fraction only. To simplify the classification, we only have three main classification types, based on the dominant grain size of fine fraction. This classification scheme is based on the Surficial Materials in the Conterminous United States map (Soller and Reheis, 2004), and we attempted to unify this scheme with maps and data in Canada. The grain size of the sediments tends to have geographical dependence. As an example, in the map by Soller and Reheis (2004), clay-rich glacial sediment exists in areas around the Great Lakes, where source material was derived from lake sediments and sandy material in mountainous regions, where there are extensive rock outcrops. The relative fraction of the sediment that is coarser than sand cannot be quantified, since most of the data sources only give qualitative descriptions of the coarse fraction.

-
Clay. Glacial sediment has a large clay component (> 50 %).
-
Silt. Intermediate of clay and sand dominant composition. This unit includes any description called “loamy till”, which is a soil with an average grain size between sand and silt.
-
Sand. Sand-rich till with only a minor clay component and more sand than silt. This includes units that were described as “bouldery till”.
Many maps do not give specific classifications of the grain size of glacial sediments. The United States quadrangle maps (Table 1), which cover most areas south of about 54∘ north (except in the Cordillera), fortunately do have this information. The lack of information north of this is likely due to accessibility issues, where there are few extensive geology, soil and engineering surveys that would serve as the basis for such a map. As a result, the sediment type for many of these regions was derived from bedrock geology maps. In general, glacial sediments in North America have a composition that similar to the underlying bedrock (Fulton, 1989), so we assume that the grain size should be related to the bedrock geology. Since the distribution of clay-rich till appears to correlate strongly with the location of lakes, it is not included. Our approach for classifying grain size from geology maps is as follows.
-
Silt. Fine-grained clastic sedimentary rock (shale, carbonates); mafic igneous rock; undivided igneous rock; low-grade metamorphic rock (e.g. greenschist).
-
Sand. Coarse-grained clastic sedimentary rock (sandstone, conglomerate); felsic igneous rock; high-grade metamorphic rock (e.g. gneiss).
2.4 Bedrock geology dataset
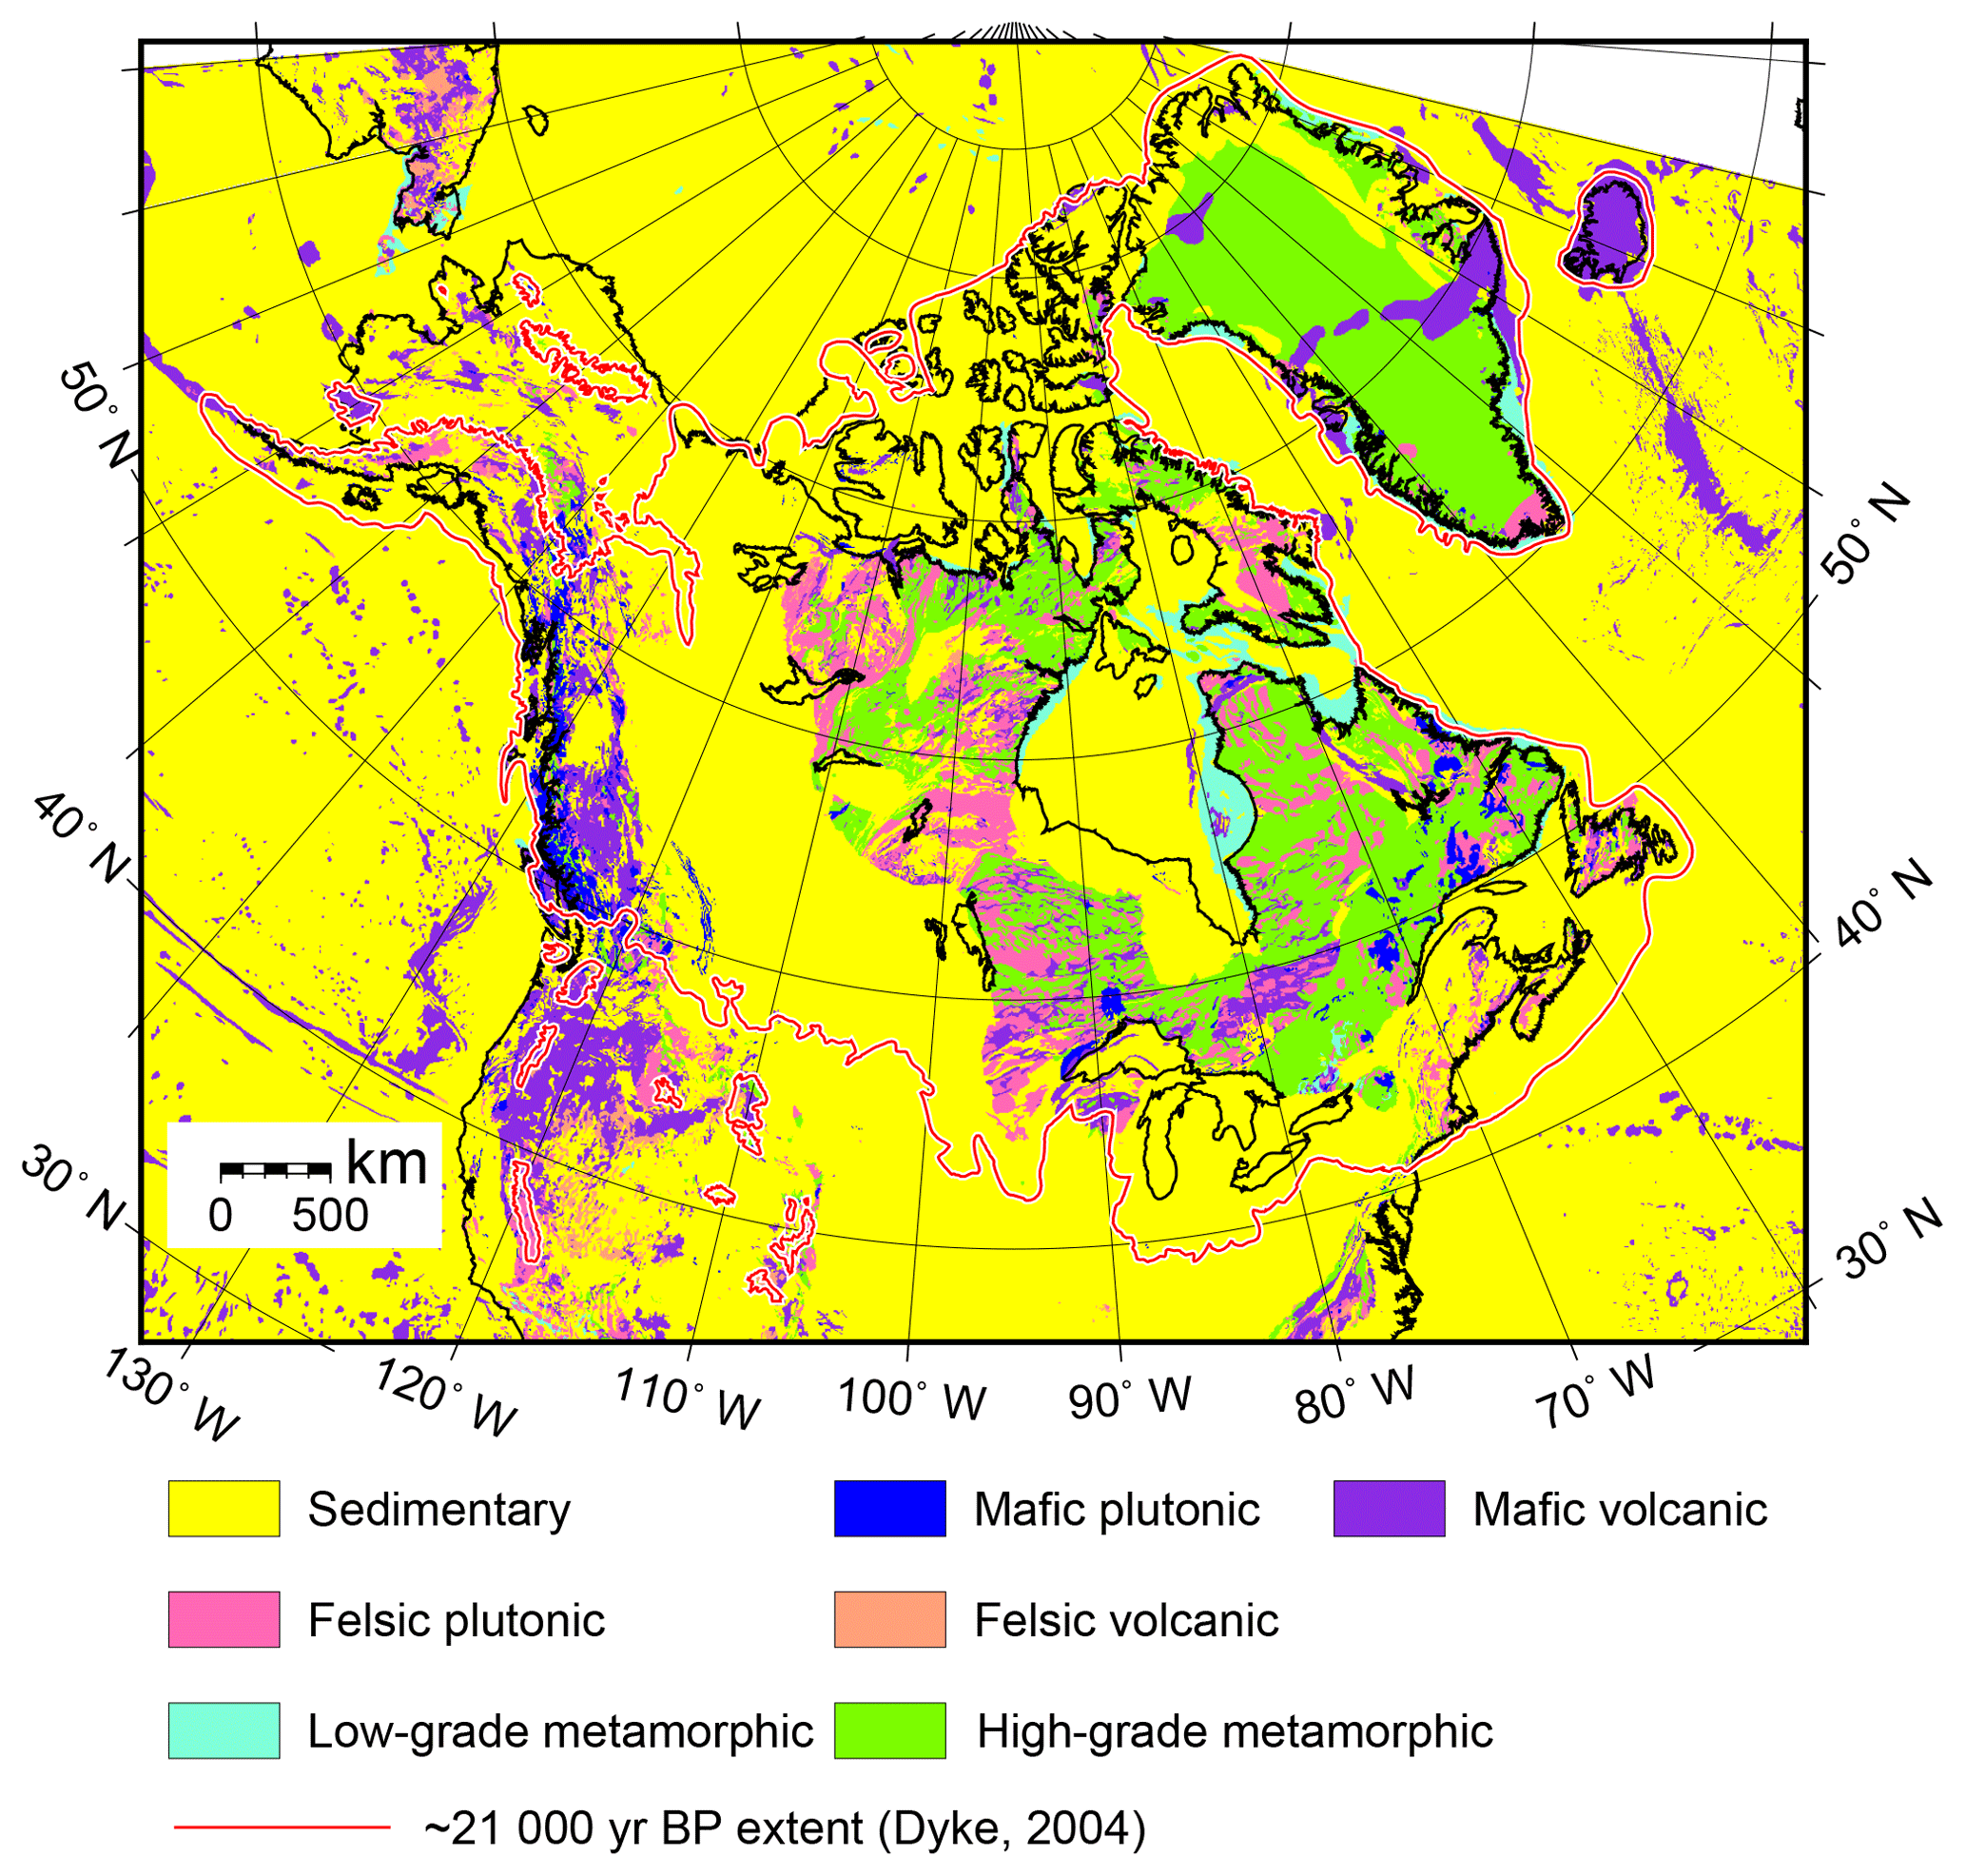
This dataset (Fig. 6) is a simplification of the Geologic Map of North America (Reed et al., 2004; Garrity and Soller, 2009). For the area covered by the Greenland Ice Sheet, we use the map by Dawes (2009). The rocks were divided into the following groups:
-
Sedimentary. All units described as being sedimentary.
-
Felsic plutonic. All rock explicitly described as felsic igneous (e.g. granite), charnockite, units described as being “felsic and intermediate” and units that were undivided mafic and felsic rock.
-
Felsic volcanic. Same as felsic plutonic, but explicitly described as volcanic (e.g. rhyolite).
-
Mafic plutonic. All rock explicitly described as mafic igneous (e.g. gabbro), units described as being “intermediate” and “intermediate and intermediate”, alkaline and units that were undivided mafic and felsic rock.
-
Mafic volcanic. Same as plutonic, but explicitly described as volcanic (e.g. basalt), also includes volcanic deposits that are described as having interlayered sedimentary layers.
-
Low-grade metamorphic. Marble, plus units described as being “undivided crystalline rocks”.
-
High-grade metamorphic. Units that are highly metamorphosed i.e. gneiss.
The map has few units that can be confidently placed in the low-grade metamorphic class, because most of these units are grouped with their non-metamorphosed source rock class. Therefore it should be assumed that many of the areas with igneous and sedimentary rock have undergone some level of metamorphism, particularly on the Canadian Shield. We placed the “undivided unit” in the low-grade category, as most of these areas are in the continental shelf where no geophysical surveys or sampling has taken place. The description given in the original dataset indicates that these rocks likely contain some amount of metamorphism. It can be assumed that these rocks along the Atlantic coast were probably subjected to some amount of metamorphism during the opening of the Atlantic Ocean, or in the case of Hudson Bay, are likely part of the Precambrian Shield.
2.5 Caveats
In this compilation, we tried to incorporate the most recent information on surficial geology that was available. Unfortunately, there are places where, due to discrepancies between adjacent maps, there are visible seams. This is especially evident at the Yukon–Alaska border and the British Columbia–Washington border. Obviously, these areas will be in need of revision when new mapping information becomes available. There are also discrepancies in interpretation and classification between maps. A good example is the dataset we used for Manitoba (Matile and Keller, 2006), which had only two classes for distribution (blanket and rock). The corresponding map by Fulton (1995) divides the regions that are classified as “rock” into veneer and rock. Since our intention is to use the most up-to-date information, we use the dataset by Matile and Keller (2006), but with the caveat that this also causes a seam with the adjacent regions in northern Ontario and Saskatchewan that have a broader classification scheme.
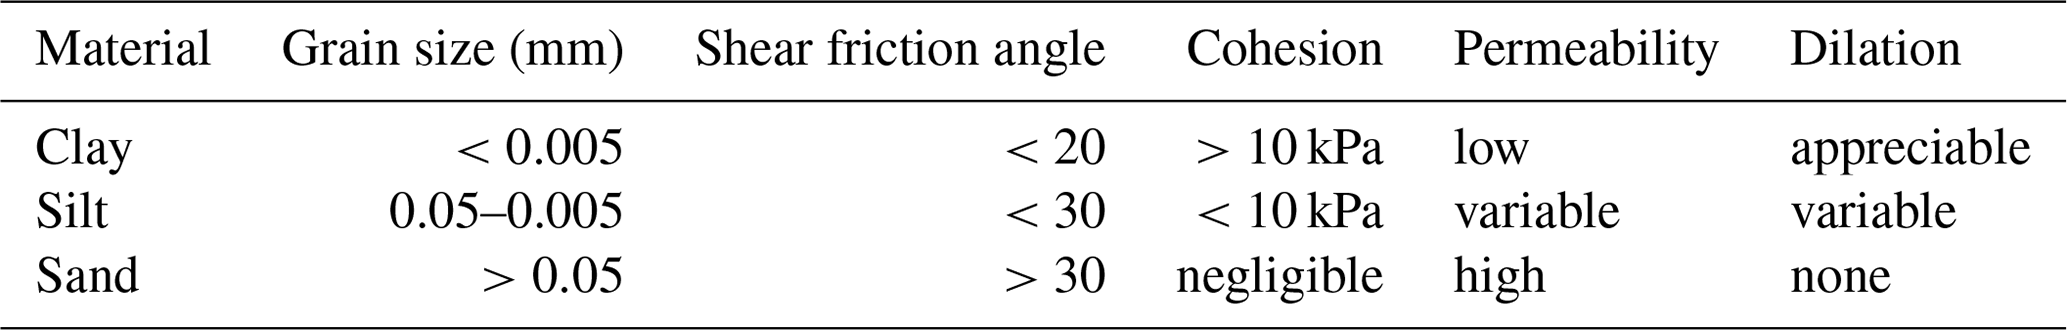
Table 3General properties of sediments relating to composition and texture (see also Eq. 1).
3.1 Geological parameters and impact on ice sheets
Some general properties of sediment grain size types are shown in Table 3. Most of these properties are described in more detail in Cuffey and Paterson (2010). These properties are only given in a qualitative manner because there have been relatively few in situ or laboratory measurements of these properties over a range of compositions (Iverson and Zoet, 2015). Measured permeability values were reported to be between 1013 and 1016 m2 (Cuffey and Paterson, 2010). It is recommended that, when modelling the behaviour of ice sheets, a range of values be explored.
The effect of sediment distribution on ice sheet models is less well known. The patchiness of sediments may result in “sticky spots”, primarily though bedrock knobs that resist the flow of ice (Alley, 1993). The lack of sediment in an otherwise sediment-covered region may increase resistance to flow as well if sediment deformation is a dominant factor in controlling flow (Stokes et al., 2007). The influence of the latter process is likely controlled by the availability of subglacial water. All of the thickness categories made in this dataset are derived from existing geological maps. Because of inconsistencies in classification between maps and vast regions where there are few direct observations, it is not possible to give a detailed quantitative estimates of distribution or thickness. These exact values of the percentage of surface cover and sediment thickness can be set as a variable in ice sheet models.
The geological map can be used for determining the erosive properties of the rocks, the source material of glacial sediment (as we did for the grain size dataset) and drainage of water under the ice into the bedrock aquifer. For the latter case, the transition from Precambrian rock and sedimentary rock has been used to explain the relative absence of eskers south of the Canadian Shield by accommodating the basal meltwater (Grasby and Chen, 2005). Modelling of the effect of bedrock on subglacial water routing has been done by Carlson et al. (2007).
3.2 Example of usage of datasets in an ice sheet model
To show the utility of the dataset, we incorporate the information for use with the ice sheet model PISM 1.0 (Bueler and Brown, 2009; PISM authors, 2017), with the addition of an index forcing scheme described in Niu et al. (2017). In the standard version of PISM, the model for basal sliding has an assumption that there is a continuous layer of sediment underlying the ice sheet. Obviously, in areas where sediment coverage is discontinuous, this is not a valid model. Therefore, the purpose of the following simulations are simply to demonstrate that, if there is a contrast in the basal conditions based on the underlying geological parameters, there will be an impact on the resulting ice sheet simulation. The simulations are not necessarily reflective of the actual basal conditions of the ice sheet.
In PISM, the basal sediments influence ice sheet dynamics by assuming they deform as a plastic Mohr–Coulomb material (Tulaczyk et al., 2000). The relationship that governs the relationship between the material and the yield stress, τc, is as follows:
The sediment parameters include the apparent cohesion, co, and the shear friction angle, ϕ. The cohesion is generally regarded as insignificant (Cuffey and Paterson, 2010) and set to zero in most ice sheet simulations (Bueler and Brown, 2009). The shear friction angle is the angle that a material will fracture by given a normal stress above its yield strength. This is the primary factor used to tune the basal sediment strength in PISM. In situ and laboratory experimental values of ϕ for glacial sediments have a large range, between 18 and 40∘ (Cuffey and Paterson, 2010). The parameter N is the difference between the normal stress from the load of the ice sheet and the water pressure in the sediments. In PISM, this factor is generally high enough that the sediments will not deform unless they are saturated. In our simulations, N=0.01 when saturated. For the tests of these datasets, we only adjust ϕ.
The results shown below are for an ice sheet model that is run for the whole of the last glacial cycle, the past 122 000 years. A time slice at 21 000 yr BP is chosen to display the effect of changing the sediment friction angle, as this was when the North American ice sheets were near their maximum extent (Dyke, 2004). Niu et al. (2017) provide a full description of the parameters related to other boundary conditions. The shear friction angle used in their study was a constant 30∘, so to show the effects of changes in basal geological parameters, this value is lowered. The results given below are just to show the effects of changing the basal properties. We make no recommendation of what the values should be. Ultimately, the model used in PISM is dependent on producing enough water to saturate the sediment layer (Bueler and Brown, 2009). If the water production is too low (i.e. the basal temperature of the ice is below pressure melting point), changing the shear friction angle will have no effect on the simulation. Therefore, in the cases shown in this section, the largest changes occur in places where there is enough significant ice flow to encourage frictional heating or that are connected to ocean basins (Fig. 7). Efforts to combine the effects of these datasets with ice sheet hydrology and ice dynamics are ongoing, and show that this model substantially underestimates that amount of water that should be available at the base (Gowan et al., 2018a).
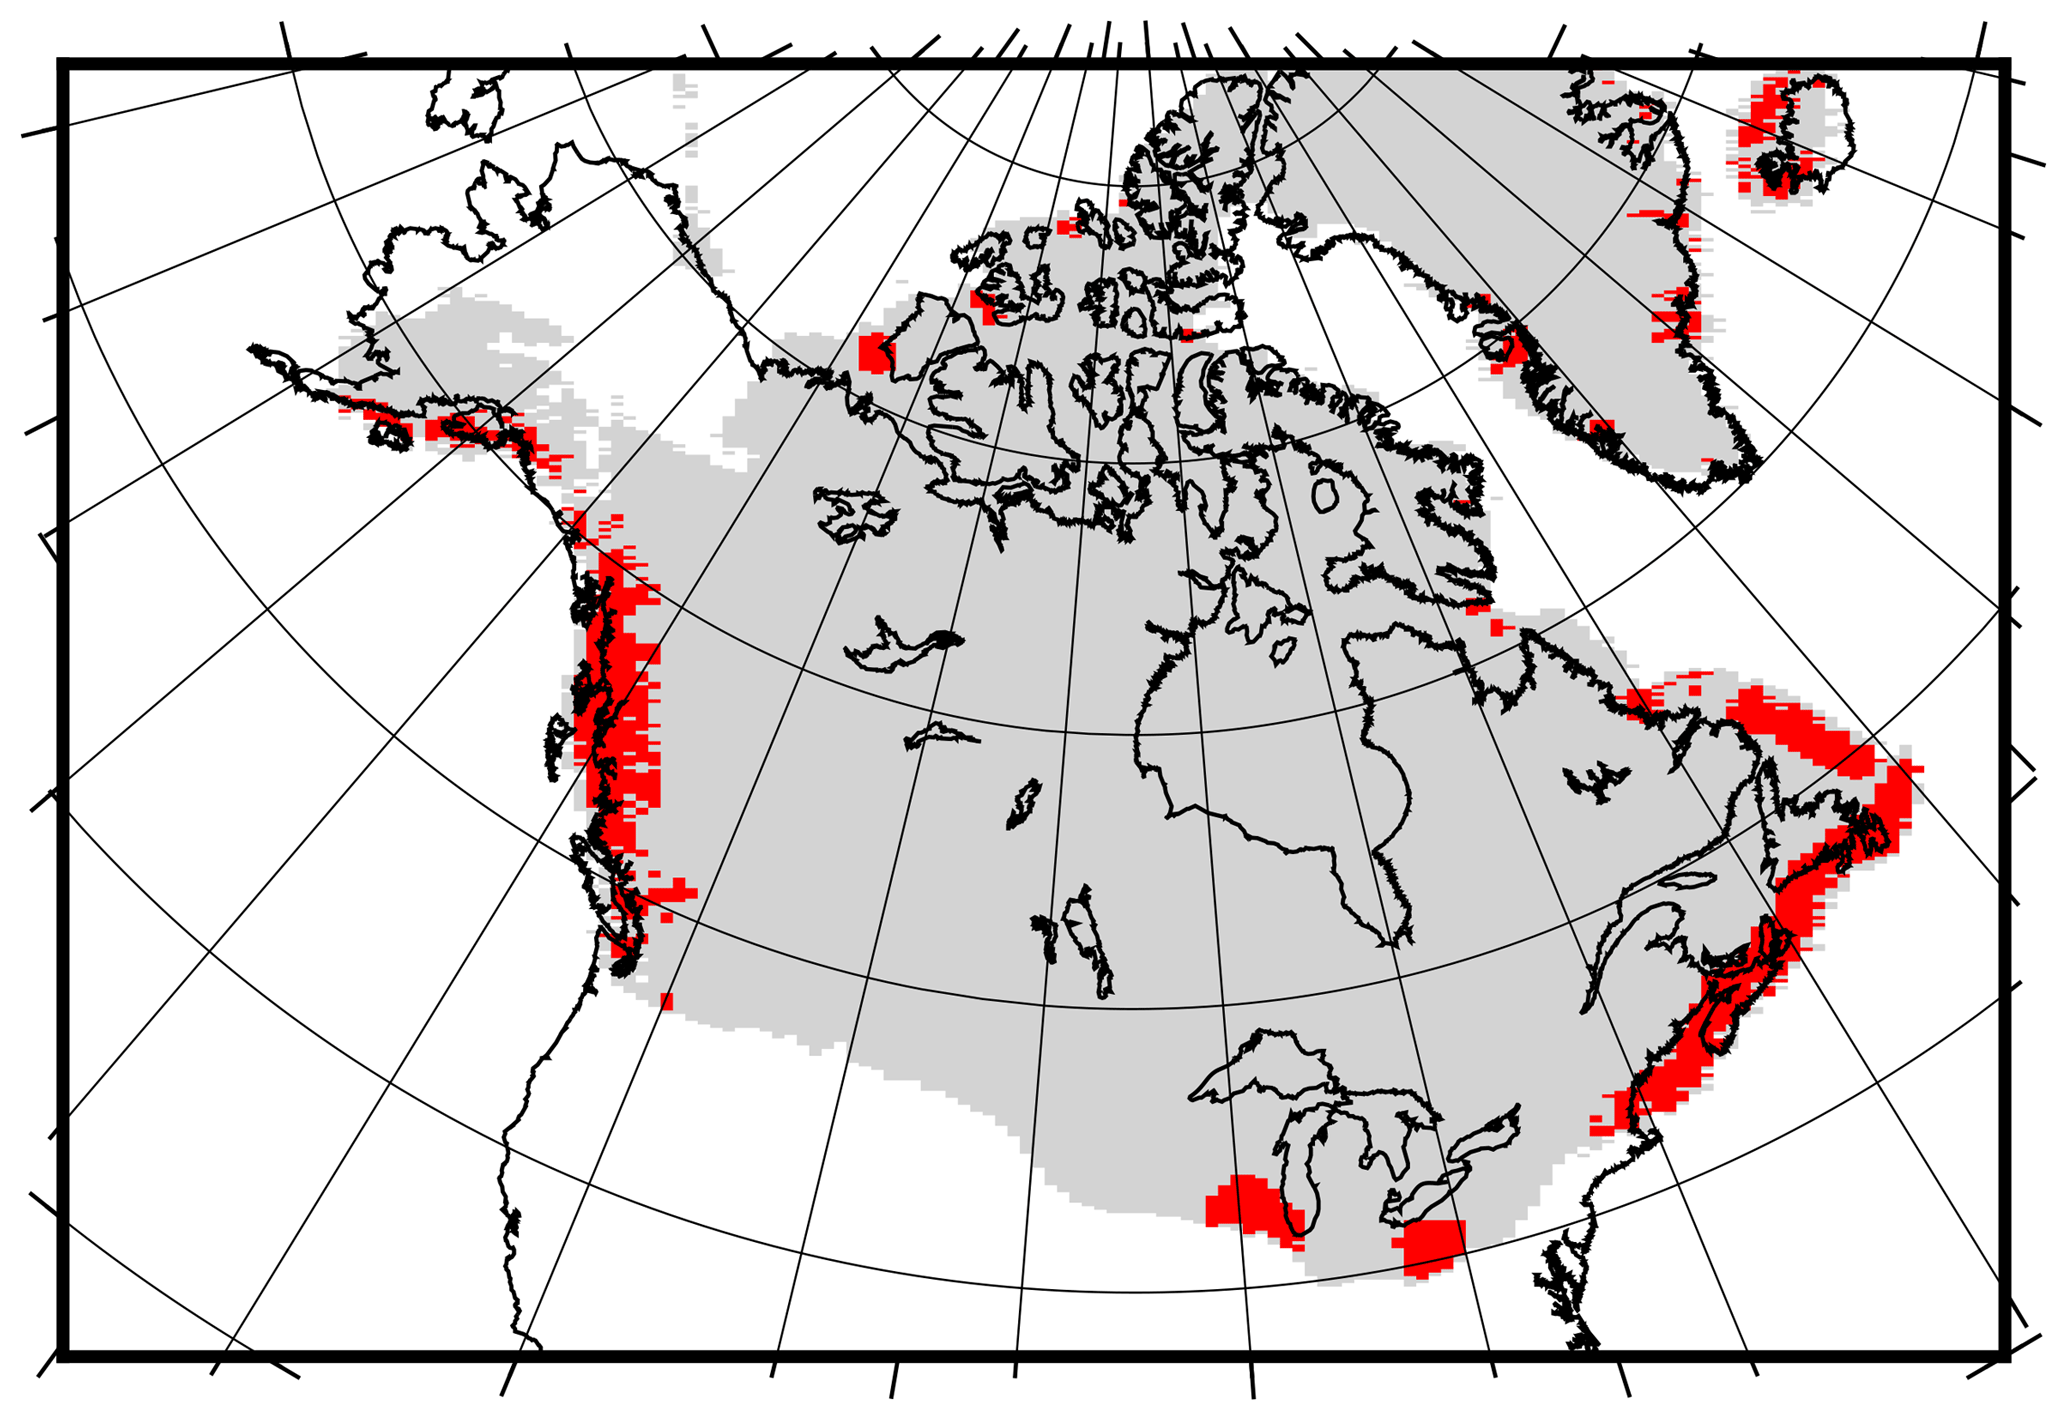
Figure 7Areas in the default simulation (shown in red) where basal frictional heating exceeds 0.01 W m−2. The grey region is where there is grounded ice.
The basal condition model in PISM is based on the assumption that the entire base of the ice sheet is covered in potentially deformable sediments, the strength of which is controlled by the sediment shear friction angle. A lower angle will weaken the ice–bed interface and therefore encourage sliding. The philosophy of the choice of shear friction angle in these examples is as follows. Areas with continuous sediment cover should be weak, since sediment deformation will be the dominant factor in sliding. The angle in sediment-covered areas are lowered from the reference value to accommodate this. For the grain size data, finer-grained sediments will be weaker than coarse-grained sediments, so the angle in areas with finer sediments are lowered from the reference value. For the geology dataset, we expect that areas underlain with sedimentary and mafic volcanic rock will be more prone to erosional effects, therefore are more likely to produce unconsolidated sediments and should therefore be weaker. The angle in these areas are reduced from the reference to simulate this effect.
3.2.1 Impact of sediment distribution
The basal boundary condition in PISM has an assumption that continuous sediment cover is over the entire domain (Bueler and Brown, 2009). In order to simulate the differences in sediment distribution, the shear friction angle is changed depending on the coverage. For continuous areas, it is set to ϕ=10∘ (weak, deformable bed), for discontinuous areas it is set to ϕ=20∘, and for rock-dominant areas it is set to ϕ=30∘ (strong, undeformable bed). Using these values, most of the Canadian Shield has a shear friction angle of 20∘, while areas underlain by Phanerozoic sedimentary rock have values of 10∘. The impact of this is that there are reductions of ice along the east coast of Canada, the Cordillera, the Great Lakes region, western Arctic Archipelago and Greenland by up to 40 % (Fig. 8). There is also an increase in ice thickness in the area east of the Cordillera (5 %–10 % greater), south of the Great Lakes and in Hudson Strait. The lower resistance to flow likely leads the ice sheet to flow further south of the Great Lakes relative to the default simulation and is notably thicker (by several hundred metres). The lack of change in the Canadian Shield, despite decreasing the shear friction angle, is most likely due to the lack of meltwater production causing a reduction in basal strength.
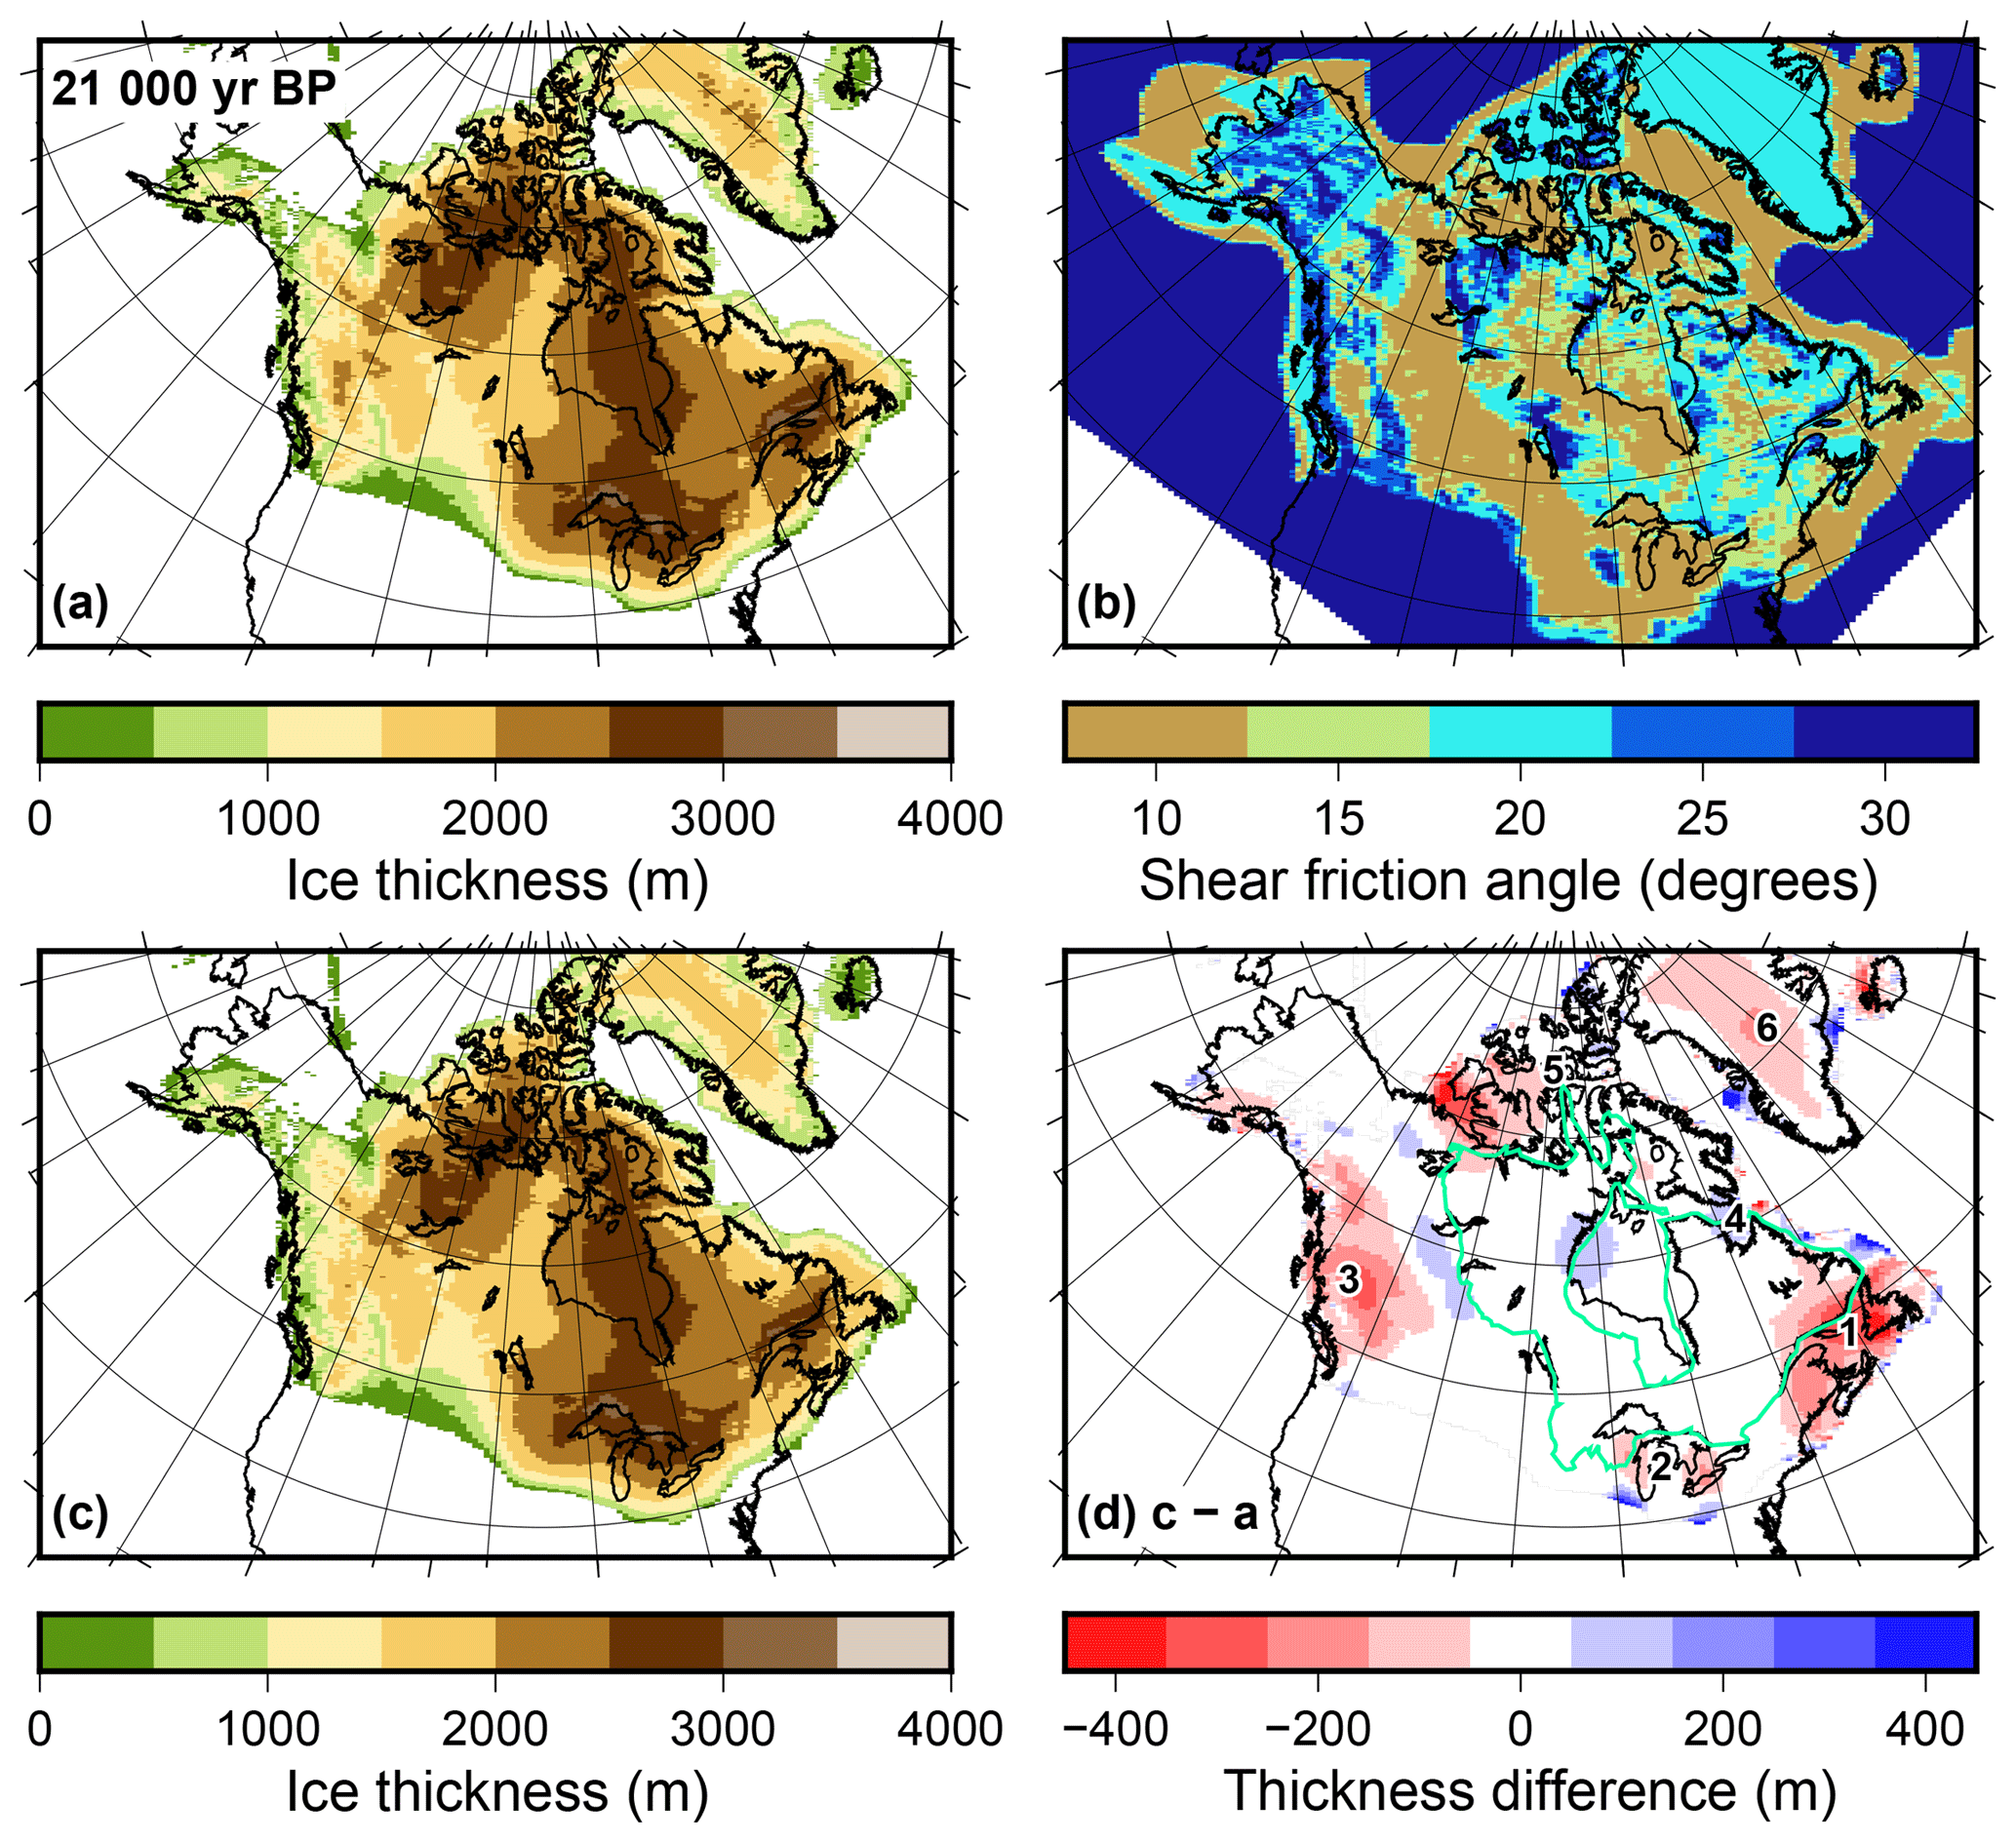
Figure 8Impact of the distribution of sediments on the simulation of North American ice sheets. (a) Thickness of the ice sheets at 21 000 yr BP (after about 101 000 years of simulation) with the default shear friction angle, ϕ=30∘. (b) Shear friction angle adjusted downwards for sediment cover. (c) Ice thickness at 21 000 yr BP using the shear friction angle shown in (b). (d) Difference in ice thickness between (a) and (c). The numbers in (d) represent areas mentioned in the text: (1) eastern Canada, (2) Great Lakes, (3) Cordillera, (4) Hudson Strait, (5) Arctic Archipelago and (6) Greenland. The green outline shows the exposed limit of the Canadian Shield.
3.2.2 Impact of sediment grain size
To test the effects of sediment grain size type, the input map from Fig. 5 was converted to a shear friction angle input by setting clay to ϕ=10∘, silt to ϕ=20∘ and sand to ϕ=30∘. This simulates the fact that clay-rich sediments are mechanically weaker, even though an angle of ϕ=10∘ is below the low end of measurements of real till (Cuffey and Paterson, 2010). The difference in ice thickness at 21 000 yr BP is shown in Fig. 9. In this case, most of the Canadian Shield, Greenland and parts of Cordillera have a shear friction angle of 30∘. Some areas south of the Great Lakes are 10∘, while the rest are 20∘. The end result at 21 000 yr BP is that there is less change in the simulation compared to the reference. There is a slight reduction in ice thickness in the Cordillera (10 %–20 %) and east coast of Canada (5 %–10 %). South of the Great Lakes, where there is clay-rich till with an angle of 10∘, the ice sheet goes further south (one grid cell, or 20 km) than the reference simulation.
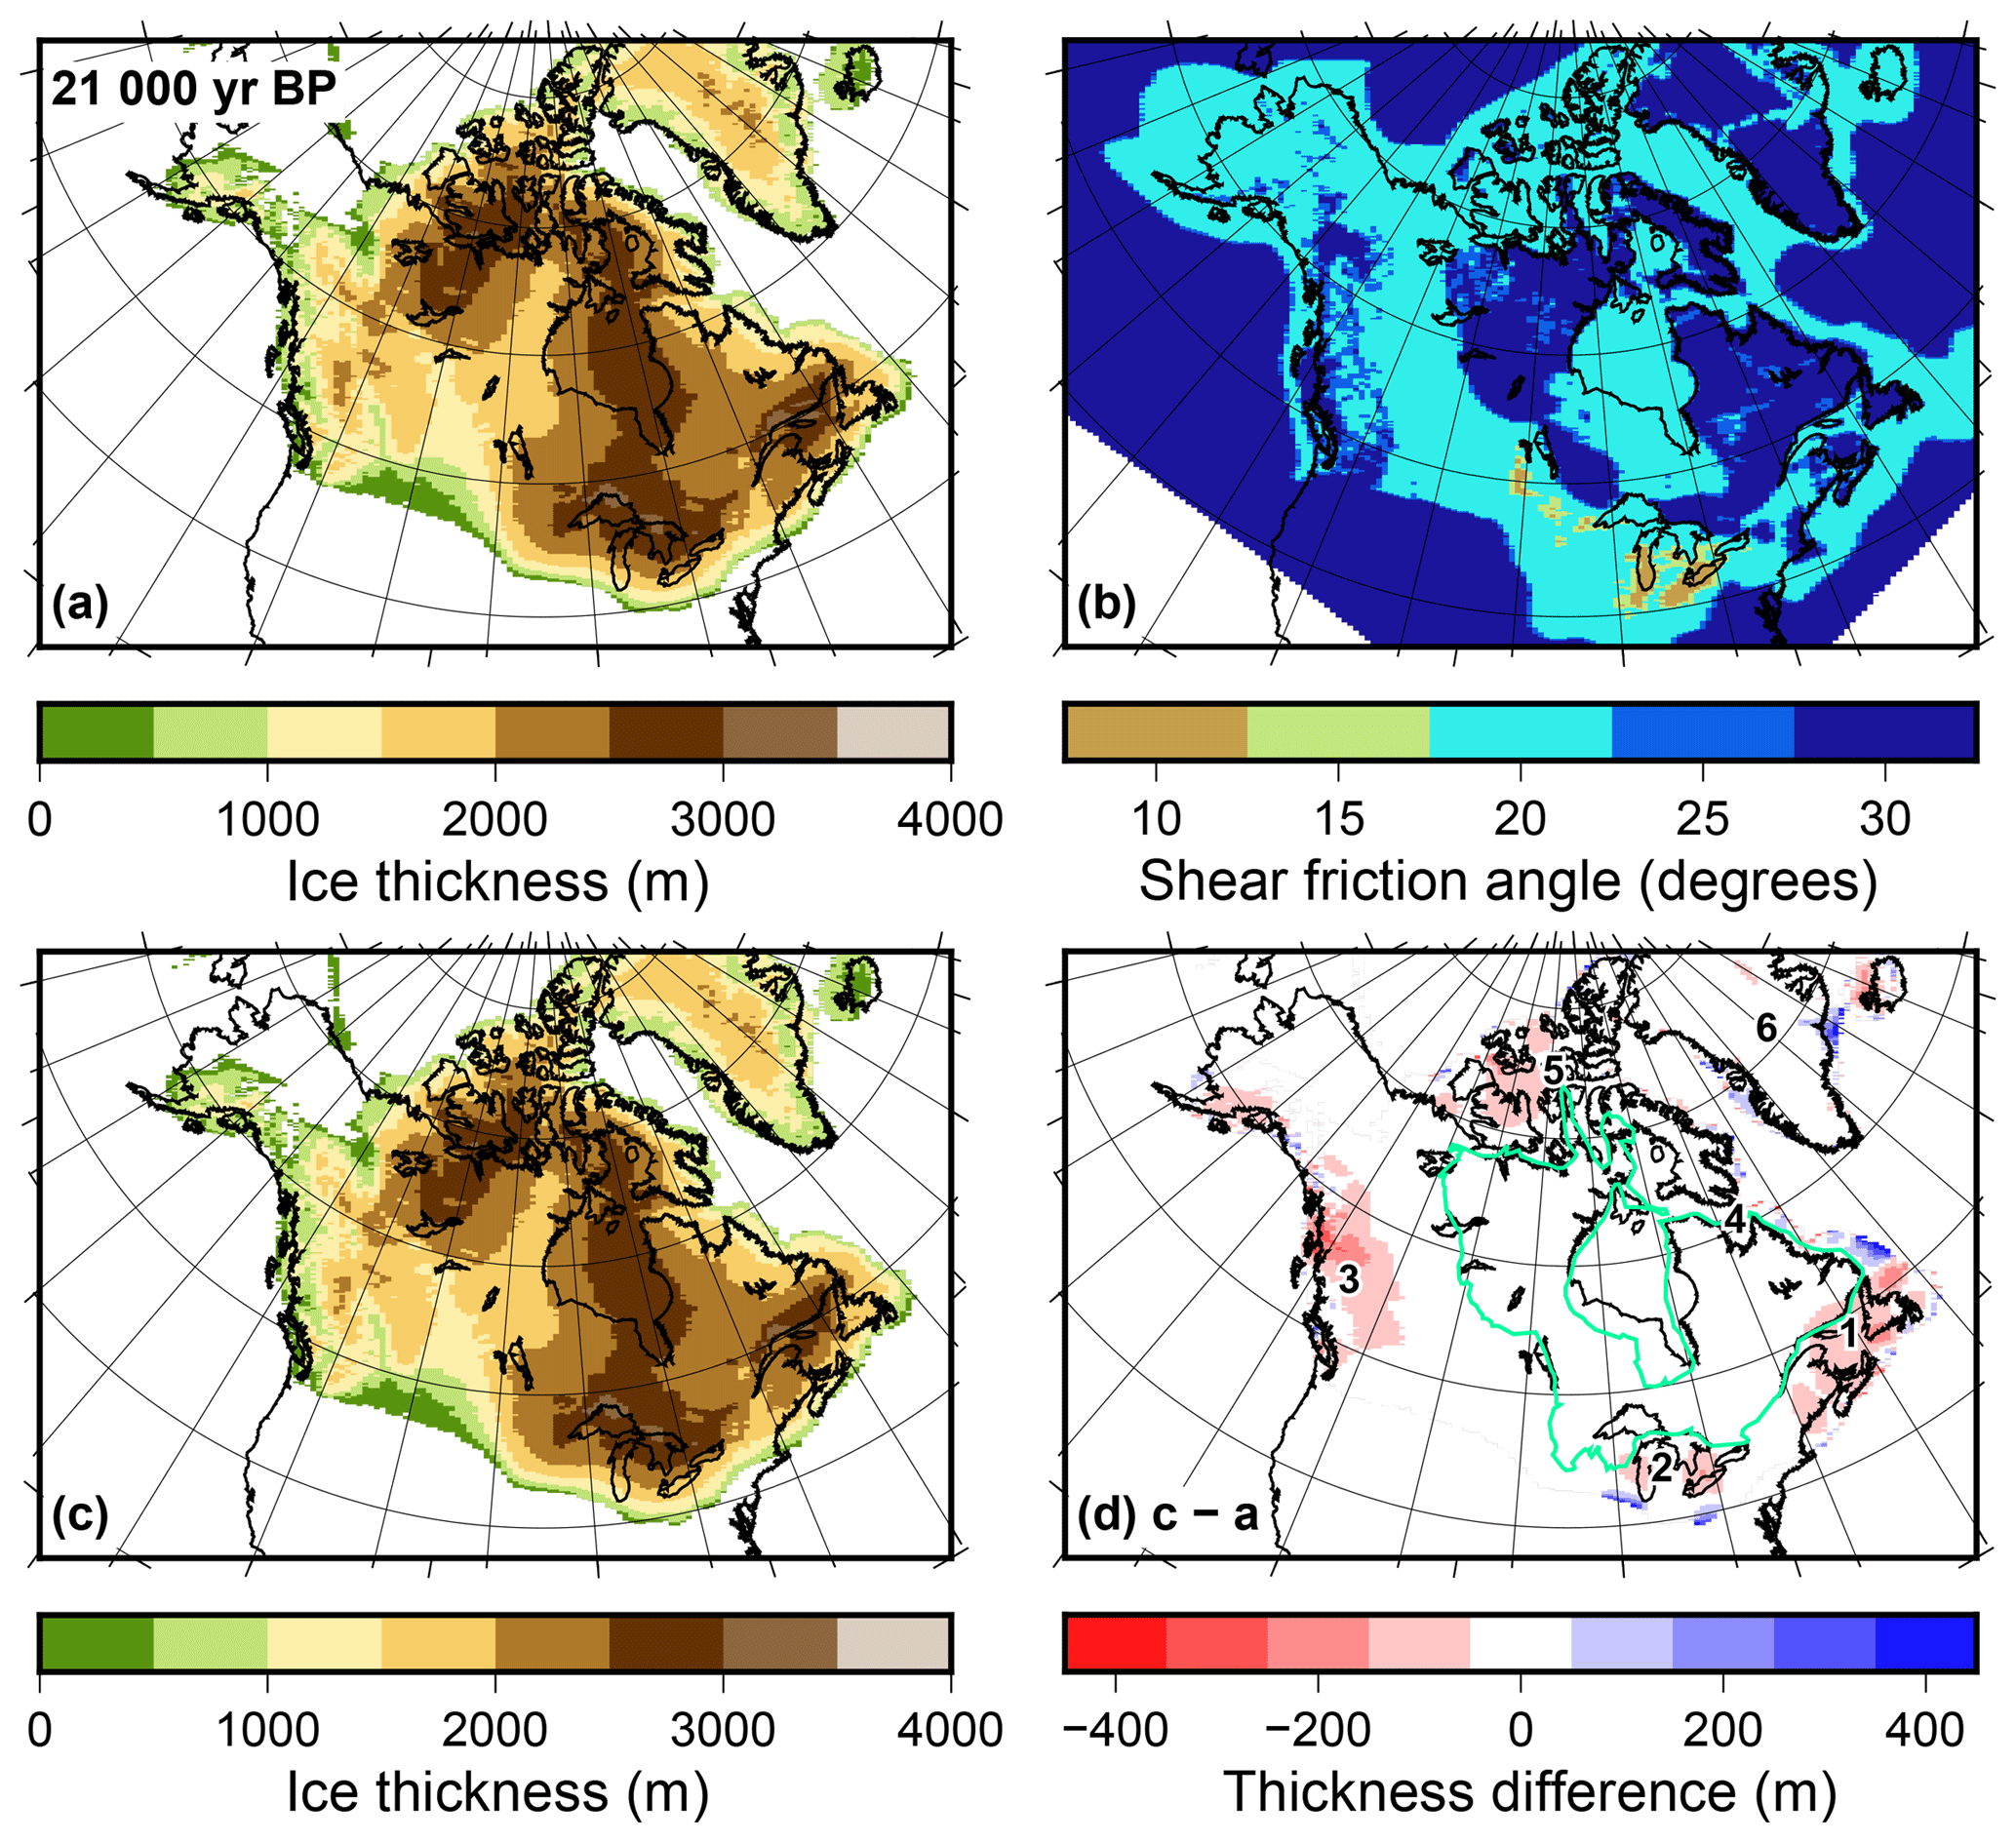
Figure 9Impact of the grain size of sediments on the simulation of North American ice sheets. (a) Thickness of the ice sheets at 21 000 yr BP (after about 101 000 years of simulation) with the default shear friction angle, ϕ=30∘. (b) Shear friction angle adjusted downwards for finer-grained sediments. (c) Ice thickness at 21 000 yr BP using the shear friction angle shown in (b). (d) Difference in ice thickness between (a) and (c). The numbers in (d) represent areas mentioned in the text: (1) eastern Canada, (2) Great Lakes, (3) Cordillera, (4) Hudson Strait, (5) Arctic Archipelago and (6) Greenland. The green outline shows the exposed limit of the Canadian Shield.
3.2.3 Impact of bedrock geology
The effects of bedrock geology are shown in Fig. 10. For this simulation, we adjusted the shear friction angle downwards for geological types that are more likely erode to produce deformable sediments. Sedimentary rock is given an angle of ϕ=10∘ to indicate their relative weakness. Low-grade metamorphic rock (which include areas where the geology is uncertain) is given an angle of ϕ=20∘. Volcanic rock is assigned a value of ϕ=25∘, as it should be more likely to be erodible than plutonic rock. Plutonic rock and high-grade metamorphic rock retain the default value of ϕ=30∘. The results show a decrease in ice thickness in the Cordillera, Canadian Archipelago, eastern Canada and northeastern Greenland by up to about 30 %. These areas are largely underlain by sedimentary rock. As with the other simulations south of the Great Lakes region, the ice sheet goes further south than the reference simulation.
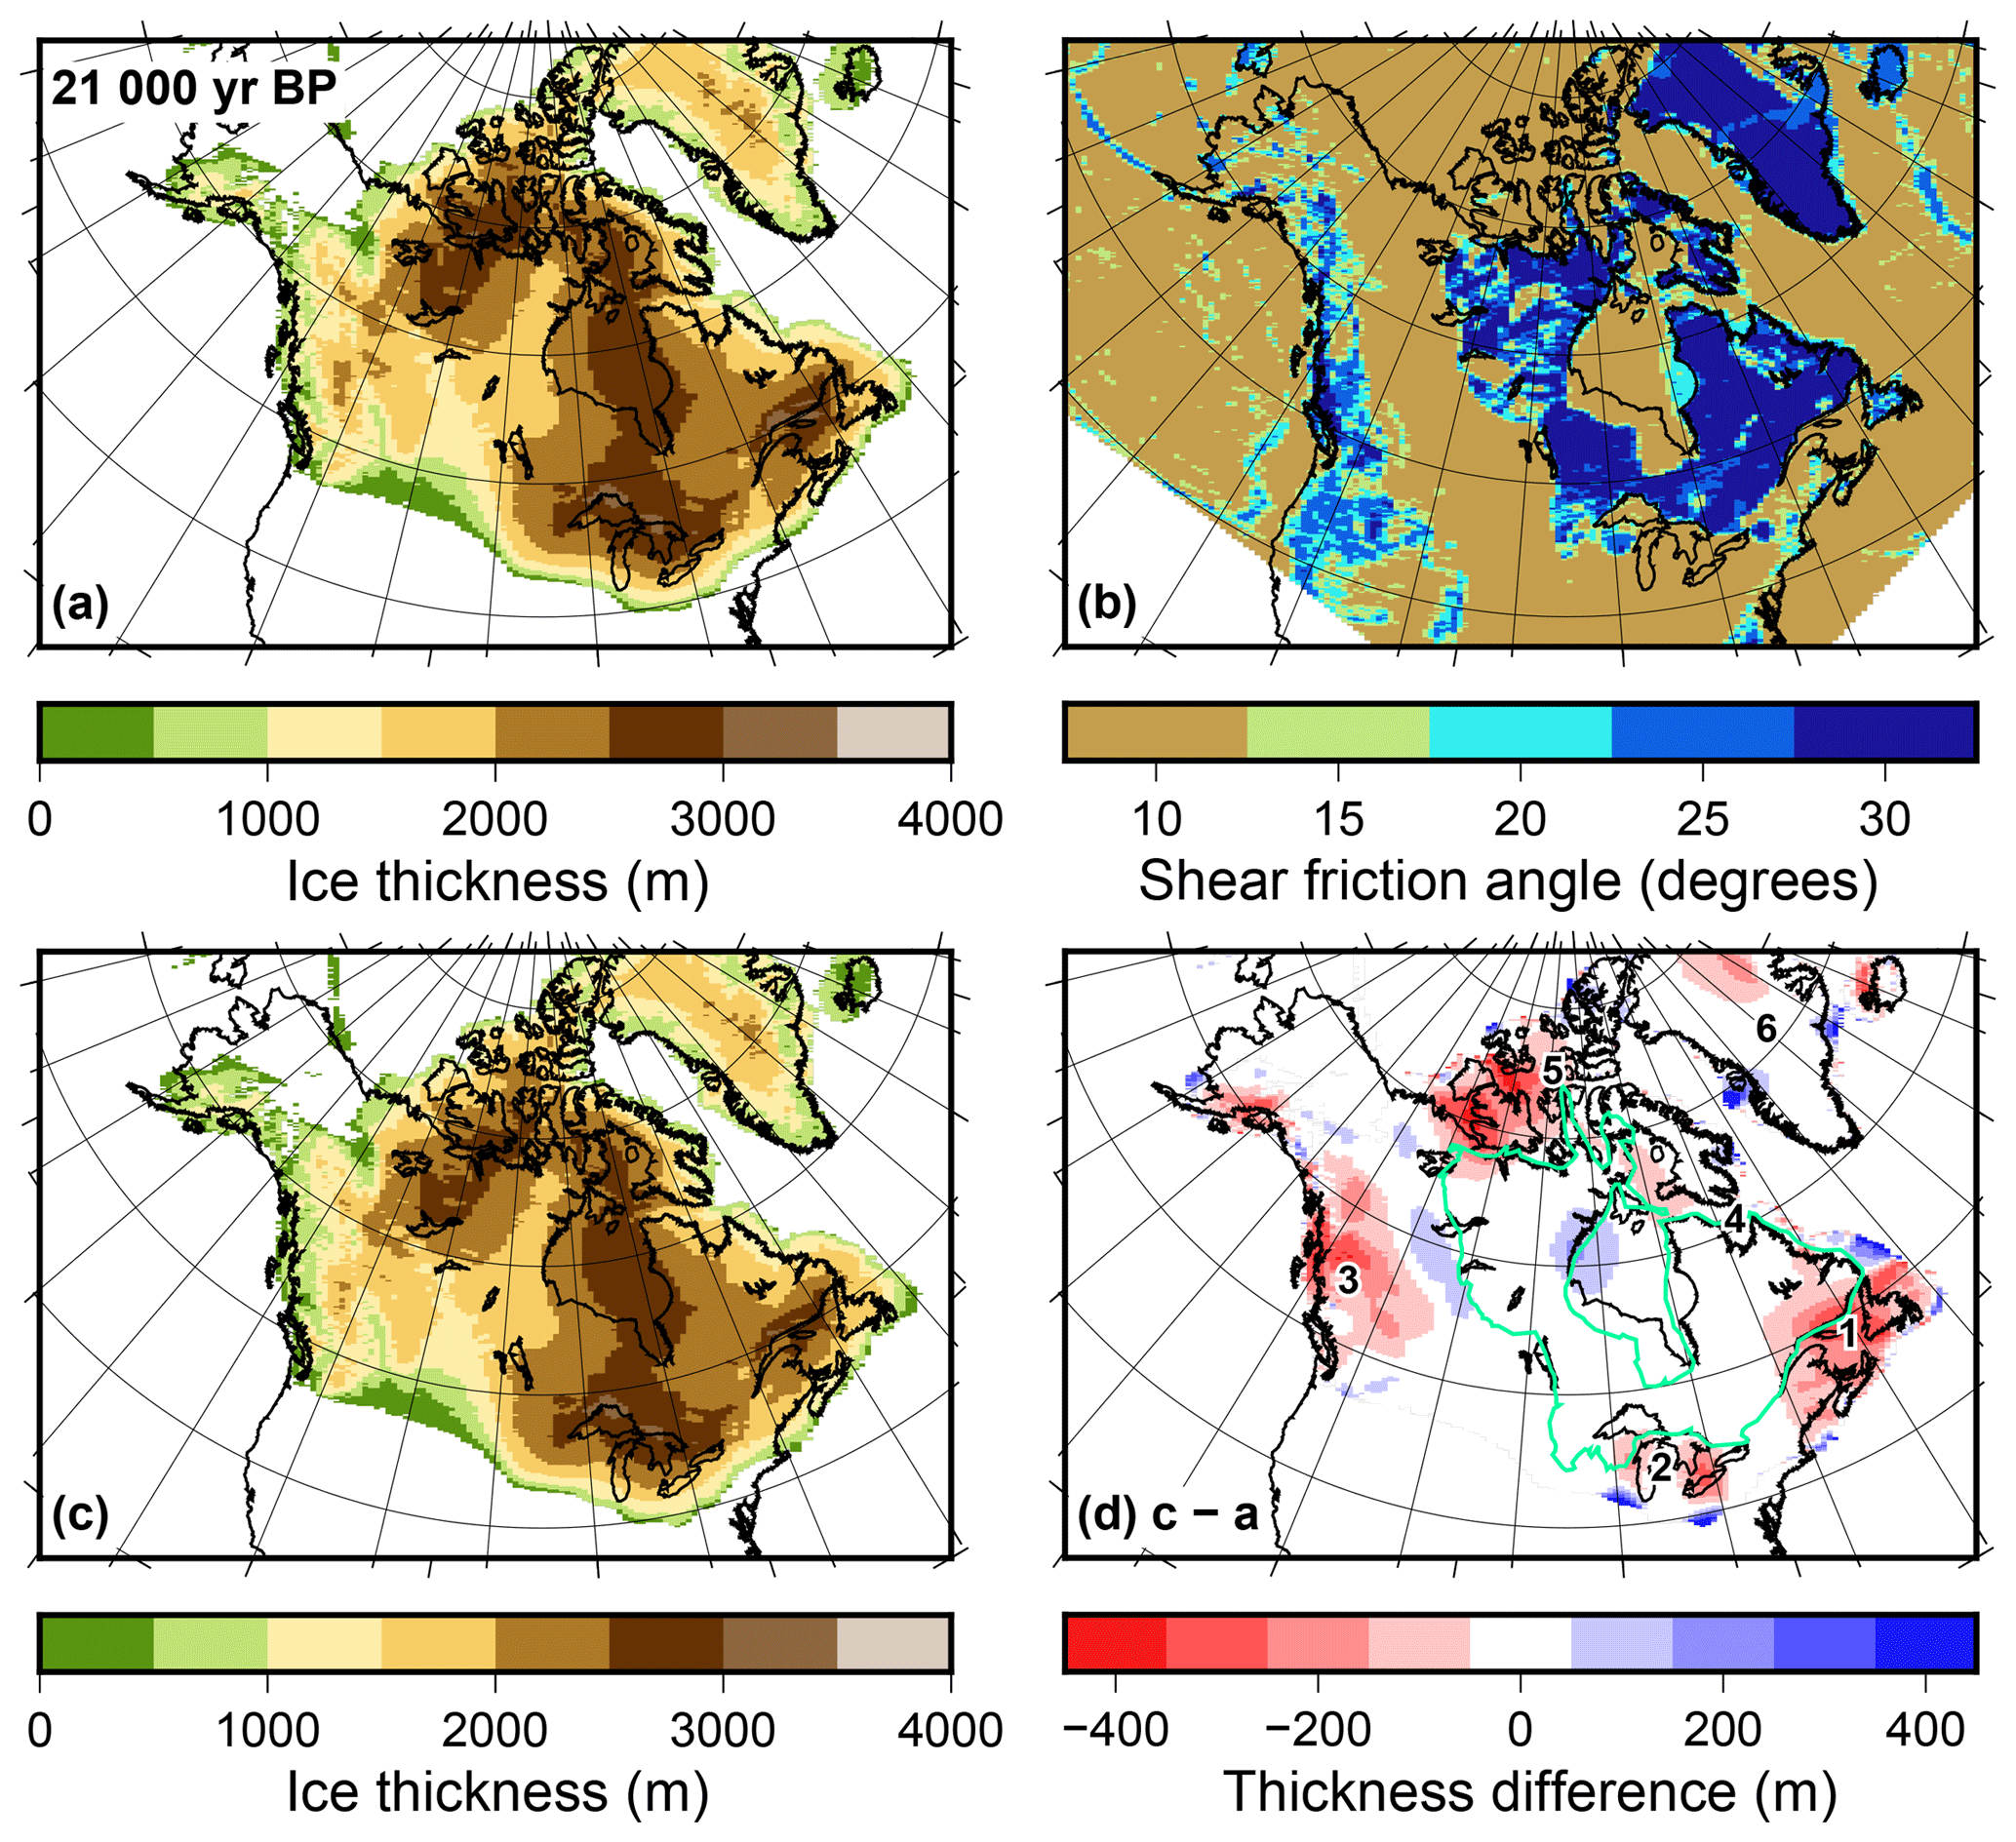
Figure 10Impact of the geology on the simulation of North American ice sheets. (a) Thickness of the ice sheets at 21 000 yr BP (after about 101 000 years of simulation) with the default shear friction angle, ϕ=30∘. (b) Shear friction angle adjusted downwards sediments and volcanic rock. (c) Ice thickness at 21 000 yr BP using the shear friction angle shown in (b). (d) Difference in ice thickness between (a) and (c). The numbers in (d) represent areas mentioned in the text: (1) eastern Canada, (2) Great Lakes, (3) Cordillera, (4) Hudson Strait, (5) Arctic Archipelago and (6) Greenland. The green outline shows the exposed limit of the Canadian Shield.
Shapefiles and NetCDF files of these datasets are available on PANGAEA (https://doi.org/10.1594/PANGAEA.895889, Gowan et al., 2018b).
Our compilation represents the first publicly available continuous dataset of sediment properties that can be implemented into ice sheet modelling studies. We have presented three datasets that present different types of geological data, including sediment distribution, grain size and bedrock geology for the regions in North America, Greenland and Iceland that were glaciated during the late Quaternary. The compilation directly incorporates information from over 50 maps and GIS datasets, plus additional information from over 40 other sources. These datasets are intended for use in ice sheet models, where the geological parameters will have impacts on ice sheet dynamics and hydrology. We demonstrated that changing the basal conditions in an ice sheet model on the basis of these datasets does impact the modelled thickness of the ice. In our simple experiments where we changed the shear friction angle to account for changes in geological properties based on inferred weakness of the ice–bed interface, there were changes of ice thickness by up to 40 %. With these datasets, we hope that improvements can be made to ice sheet models to incorporate this geological data and create a more realistic representation of basal conditions. Examples of such application include changing the shear friction angle in a Mohr–Coulomb plastic basal sliding model, or changing water routing properties in a basal hydrology model. These properties are key to explaining observed ice sheet dynamics, notably the rapid advance and retreat of the Laurentide Ice Sheet, during the last glacial cycle.
EJG compiled the datasets and was the main author of the text. LN designed the ice sheet model simulation. All authors contributed to the text and design of the study.
The authors declare that they have no conflict of interest.
This work was funded by the Helmholtz Climate Initiative REKLIM (Regional
Climate Change), a joint research project at the Helmholtz Association of
German research centres (HGF). This study was also supported by the PACES-II
program at the Alfred Wegener Institute and the Bundesministerium für
Bildung und Forschung funded project, PalMod. The development of PISM is
supported by NASA grant NNX17AG65G and NSF grants PLR-1603799 and
PLR-1644277. Figures in this paper were plotted with the aid of Generic
Mapping Tools (Wessel et al., 2013). We want to thank Jeremy Ely and an
anonymous reviewer for their review, which led to improvements in the dataset
and manuscript. We would like to thank Thompson Davis for notifying us of
several errors in the references.
Edited by: Reinhard Drews
Reviewed by: Jeremy Ely and one anonymous referee
Abe-Ouchi, A., Saito, F., Kawamura, K., Raymo, M. E., Okuno, J., Takahashi, K., and Blatter, H.: Insolation-driven 100,000-year glacial cycles and hysteresis of ice-sheet volume, Nature, 500, 190–193, 2013. a
Alley, R. B.: In search of ice-stream sticky spots, J. Glaciol., 39, 447–454, https://doi.org/10.3189/S0022143000016336, 1993. a
Aylsworth, J. M. and Shilts, W. W.: Bedforms of the Keewatin ice sheet, Canada, Sediment. Geol., 62, 407–428, https://doi.org/10.1016/0037-0738(89)90129-2, 1989. a, b
Batchelor, C. L., Dowdeswell, J. A., and Pietras, J. T.: Seismic stratigraphy, sedimentary architecture and palaeo-glaciology of the Mackenzie Trough: evidence for two Quaternary ice advances and limited fan development on the western Canadian Beaufort Sea margin, Quaternary Sci. Rev., 65, 73–87, https://doi.org/10.1016/j.quascirev.2013.01.021, 2013. a
Booth, D. B.: Glaciofluvial infilling and scour of the Puget Lowland, Washington, during ice-sheet glaciation, Geology, 22, 695–698, https://doi.org/10.1130/0091-7613(1994)022<0695:GIASOT>2.3.CO;2, 1994. a
Borns Jr., N. R., Gadd, P. L., Martineau, G., Chauvin, L., Fullerton, D. S., Fulton, R. J., Chapman, W. F., Wagner, W. P., and Grant, D. R.: Quaternary geologic map of the Quebec quadrangle, United States and Canada, Miscellaneous Investigations Series MAP I-1420 (NL-19), edited by: Richmond, G. M. and Fullerton, D. S., U.S. Geological Survey, scale , 1987. a
Bouchard, M. A.: Subglacial landforms and deposits in central and northern Quebec, Canada, with emphasis on Rogen moraines, Sediment. Geol., 62, 293–308, https://doi.org/10.1016/0037-0738(89)90120-6, 1989. a
Boulton, G. S., Dobbie, K. E., and Zatsepin, S.: Sediment deformation beneath glaciers and its coupling to the subglacial hydraulic system, Quaternary Int., 86, 3–28, https://doi.org/10.1016/S1040-6182(01)00048-9, 2001. a, b
Bueler, E. and Brown, J.: Shallow shelf approximation as a “sliding law” in a thermodynamically-coupled ice sheet model, J. Geophys. Res., 114, F03008, https://doi.org/10.1029/2008JF001179, 2009. a, b, c, d
Calov, R., Ganopolski, A., Petoukhov, V., Claussen, M., and Greve, R.: Large-scale instabilities of the Laurentide ice sheet simulated in a fully coupled climate-system model, Geophys. Res. Lett., 29, 69-1–69-4, https://doi.org/10.1029/2002GL016078, 2002. a
Carlson, A. E., Jenson, J. W., and Clark, P. U.: Modeling the subglacial hydrology of the James Lobe of the Laurentide Ice Sheet, Quaternary Sci. Rev., 26, 1384–1397, https://doi.org/10.1016/j.quascirev.2007.02.002, 2007. a, b
Christoffersen, P., Tulaczyk, S., Wattrus, N. J., Peterson, J., Quintana-Krupinski, N., Clark, C. D., and Sjunneskog, C.: Large subglacial lake beneath the Laurentide Ice Sheet inferred from sedimentary sequences, Geology, 36, 563–566, https://doi.org/10.1130/G24628A.1, 2008. a
Clague, J. J.: Quaternary geology of the Canadian Cordillera, in: Quaternary Geology of Canada and Greenland, in: Geology of Canada, edited by: Fulton, R. J., chap. 1, 17–96, Geological Survey of Canada, 1989. a
Clague, J. J., Fulton, R. J., and Ryder, J. M.: Surficial geology, Vancouver Island and adjacent mainland, British Columbia, map, Open File 837, Geological Survey of Canada, Ottawa, Canada, scale , https://doi.org/10.4095/129736, 1982. a
Clark, P. U. and Pollard, D.: Origin of the middle Pleistocene transition by ice sheet erosion of regolith, Paleoceanography, 13, 1–9, 1998. a
Clark, P. U. and Walder, J. S.: Subglacial drainage, eskers, and deforming beds beneath the Laurentide and Eurasian ice sheets, Geol. Soc. Am. Bull., 106, 304–314, https://doi.org/10.1130/0016-7606(1994)106<0304:SDEADB>2.3.CO;2, 1994. a, b
Cofaigh, C. Ó., Stokes, C. R., Lian, O. B., Clark, C. D., and Tulacyzk, S.: Formation of mega-scale glacial lineations on the Dubawnt Lake Ice Stream bed: 2. Sedimentology and stratigraphy, Quaternary Sci. Rev., 77, 210–227, 2013. a
Corbett, L. B., Bierman, P. R., Lasher, G. E., and Rood, D. H.: Landscape chronology and glacial history in Thule, northwest Greenland, Quaternary Sci. Rev., 109, 57–67, https://doi.org/10.1016/j.quascirev.2014.11.019, 2015. a, b
Corbett, L. B., Bierman, P. R., and Davis, P. T.: Glacial history and landscape evolution of southern Cumberland Peninsula, Baffin Island, Canada, constrained by cosmogenic 10Be and 26Al, Bulletin, 128, 1173–1192, https://doi.org/10.1130/B31402.1, 2016. a, b
Cuffey, K. M. and Paterson, W. S. B.: The physics of glaciers, Elsevier, Burlington, MA, USA, 2010. a, b, c, d, e
Dawes, P. R.: The bedrock geology under the Inland Ice: the next major challenge for Greenland mapping, Geol. Surv. Den. Greenl., 17, 57–60, 2009. a, b
Denne, J. E., Luza, K. V., Richmond, G. M., Jensen, K. M., Fishman, W. D., and Wermund Jr., E. G.: Quaternary Geologic Map of the Wichita 4∘ × 6∘ Quadrangle, United States, Miscellaneous Investigations Series Map I-1420 (NJ-14), edited by: Richmond, G. M. and Christiansen, A. C., U.S. Geological Survey, scale 1:1 000 000, 1993. a
Dowdeswell, J. A., Evans, J., and Cofaigh, C. Ó.: Submarine landforms and shallow acoustic stratigraphy of a 400 km-long fjord-shelf-slope transect, Kangerlussuaq margin, East Greenland, Quaternary Sci. Rev., 29, 3359–3369, https://doi.org/10.1016/j.quascirev.2010.06.006, 2010. a
Dreimanis, A. and Vagners, U. J.: Bimodal distribution of rock and mineral fragments in basal tills, in: Till, a symposium, edited by: Goldthwait, R. P., 237–250, Ohio State University Press, Columbus, Ohio, 1971. a
Duchesne, M. J., Pinet, N., Bédard, K., St-Onge, G., Lajeunesse, P., Campbell, D. C., and Bolduc, A.: Role of the bedrock topography in the Quaternary filling of a giant estuarine basin: the Lower St. Lawrence Estuary, Eastern Canada, Basin Res., 22, 933–951, https://doi.org/10.1111/j.1365-2117.2009.00457.x, 2010. a
Duk-Rodkin, A. and Hughes, O. L.: Surficial Geology, Upper Ramparts River, District of Mackenzie, Northwest Territories, Map 1783A, scale 1 : 250 000, Geological Survey of Canada, 1993. a
Dyke, A. S.: An outline of North American deglaciation with emphasis on central and northern Canada, in: Quaternary Glaciations–Extent and Chronology – Part II: North America, edited by: Ehlers, J., Gibbard, P. L., and Hughes, P. D., Developments in Quaternary Science, 373–424, Elsevier, https://doi.org/10.1016/S1571-0866(04)80209-4, 2004. a, b, c, d
Dyke, A. S., Andrews, J. T., Clark, P. U., England, J. H., Miller, G. H., Shaw, J., and Villette, J. J.: The Laurentide and Innuitian ice sheets during the Last Glacial Maximum, Quaternary Sci. Rev., 21, 9–31, https://doi.org/10.1016/S0277-3791(01)00095-6, 2002. a, b
Evans, D. J. A., Phillips, E. R., Hiemstra, J. F., and Auton, C. A.: Subglacial till: formation, sedimentary characteristics and classification, Earth-Sci. Rev., 78, 115–176, https://doi.org/10.1016/j.earscirev.2006.04.001, 2006. a, b
Eyles, N., Boyce, J. I., and Barendregt, R. W.: Hummocky moraine: sedimentary record of stagnant Laurentide Ice Sheet lobes resting on soft beds, Sediment. Geol., 123, 163–174, https://doi.org/10.1016/S0037-0738(98)00129-8, 1999. a
Eyles, N., Moreno, L. A., and Sookhan, S.: Ice streams of the Late Wisconsin Cordilleran Ice Sheet in western North America, Quaternary Sci. Rev., 179, 87–122, https://doi.org/10.1016/j.quascirev.2017.10.027, 2018. a
Farrand, W. R., Mickelson, D. M., Cowan, W. R., and Goebel, J. E.: Quaternary geologic map of the Lake Superior 4∘ × 6∘ quadrangle, United States and Canada, Miscellaneous Investigations Series Map I-1420 (NL-16), edited by: Richmond, G. M. and Fullerton, D. S., U.S. Geological Survey, scale 1:1 000 000, 1984. a
Fisher, D., Reeh, N., and Langley, K.: Objective reconstructions of the Late Wisconsinan Laurentide Ice Sheet and the significance of deformable beds, Geogr. Phys. Quatern., 39, 229–238, 1985. a
Freire, F., Gyllencreutz, R., Greenwood, S. L., Mayer, L., Egilsson, A., Thorsteinsson, T., and Jakobsson, M.: High resolution mapping of offshore and onshore glaciogenic features in metamorphic bedrock terrain, Melville Bay, northwestern Greenland, Geomorphology, 250, 29–40, https://doi.org/10.1016/j.geomorph.2015.08.011, 2015. a
Fullerton, D. S., Cowan, W. R., Sevon, W. D., Goldthwait, R. P., Farrand, W. R., Muller, E. H., Behling, R. E., and Stravers, J. A.: Quaternary geologic map of the Lake Erie 4∘ × 6∘ quadrangle, United States and Canada, Miscellaneous Investigations Series Map I-1420 (NK-17), edited by: Fullerton, D. S. and Richmond, G. M., U.S. Geological Survey, scale , 1991. a
Fullerton, D. S., Sevon, W. D., Muller, E. H., Judson, S., Black, R. F., Wagner, P. W., Hartshorn, J. H., Chapman, W. F., and Cowan, W. D.: Quaternary geologic map of the Hudson River 4∘ × 6∘ quadrangle, United States and Canada, Miscellaneous Investigations Series Map I-1420 (NK-18), edited by: Fullerton, D.S., U.S. Geological Survey, scale , 1992. a
Fullerton, D. S., Bluemle, J. P., Clayton, L., Steece, F. V., Tipton, M. J., Bretz, R., and Goebel, J. E.: Quaternary geologic map of the Dakotas 4∘ × 6∘ quadrangle, United States, Miscellaneous Investigations Series Map I-1420 (NL-14), edited by: Fullerton, D. S., U.S. Geological Survey, scale , 1995. a
Fullerton, D. S., Ringrose, S. M., Clayton, L., Schreiner, B. T., and Goebel, J. E.: Quaternary geologic map of the Winnipeg 4∘ × 6∘ quadrangle, United States and Canada, Miscellaneous Investigations Series Map I-1420 (NM-14), edited by: Fullerton, D. S., U.S. Geological Survey, scale , 2000. a
Fullerton, D. S., Colton, R. B., Bush, C. A., and Straub, A. W.: Map showing spatial and temporal relations of mountain and continental glaciations on the northern plains, primarily in northern Montana and northwestern North Dakota, Scientific Investigations Map 2843, United States Geological Survey, 2004. a
Fullerton, D. S., Christiansen, E. A., Schreiner, B. T., Colton, R. B., and Clayton, L.: Quaternary Geologic Map of the Regina 4∘ × 6∘ quadrangle, United States and Canada, Miscellaneous Investigations Series Map I-1420 (NM-13), edited by: Fullerton, D. S. and Bush, C. A., U.S. Geological Survey, scale , 2007. a
Fullerton, D. S., Colton, R. B., and Bush, C. A.: Quaternary geologic map of the Glasgow 1∘ × 2∘ quadrangle, Montana, Open-File Report 2012-1217, scale 1 : 250 000, U.S. Geological Survey, 2012. a
Fullerton, D. S., Colton, R. B., and Bush, C. A.: Quaternary geologic map of the Shelby 1∘ × 2∘ quadrangle, Montana, Open-File Report 2012-1170, scale 1 : 250 000, U.S. Geological Survey, 2013. a
Fullerton, D. S., Colton, R. B., and Bush, C. A.: Quaternary geologic map of the Wolf Point 1∘ × 2∘ quadrangle, Montana and North Dakota, Open-File Report 2016-1142, scale 1 : 250 000, U.S. Geological Survey, https://doi.org/10.3133/ofr20161142, 2016. a
Fulton, R. J.: Quaternary Geology of Canada and Greenland, Vol. 1 of Geology of Canada, Geological Survey of Canada, Ottawa, Canada, 5 pp., https://doi.org/10.4095/127905, 1989. a
Fulton, R. J.: Surficial materials of Canada, Map 1880A, scale 1 : 5 000 000, Geological Survey of Canada, https://doi.org/10.4095/205040, 1995. a, b, c, d, e, f, g, h, i, j
Funder, S.: Quaternary Geology of the Ice-Free areas and Adjacent Shelves of Greenland, in: Quaternary Geology of Canada and Greenland, edited by: Fulton, R. J., Geological Survey of Canada, Geology of Canada, no. 1 in chap. 13, 743–792, 1989. a, b
Funder, S. and Klüver, B. G.: Quaternary Map of Greenland Scoresby Sund, Map Sheet 12, scale , The Geological Survey of Greenland, 1988. a
Gadd, N. R., Veillette, J. J., Fullerton, D. S. (Ed.), Wagner, P. W., and Chapman, W. F.: Quaternary geologic map of the Ottawa quadrangle, United States and Canada, Miscellaneous Investigations Series Map I-1420 (NL-18), scale , U.S. Geological Survey, 1993. a
Garrity, C. P. and Soller, D. R.: Database of the Geologic Map of North America, adapted from the map by J. C. Reed, Jr. and others (2005), U.S. Geological Survey Data Series 424, U.S. Geological Survey, available at: https://pubs.usgs.gov/ds/424/ (last access: 17 August 2017), 2009. a
Geological Survey of Canada: Surficial geology of Canada, Map Canadian Geoscience Map 195 (preliminary, surficial data model v. 2.0 conversion of Map 1880A), scale 1 : 5 000 000, Geological Survey of Canada, https://doi.org/10.4095/295462, 2014. a
Goebel, J. E., Mickelson, D. M., Farrand, W. R., Clayton, L., Knox, J. C., Cahow, A. C., Hobbs, H., and Walton Jr., M. S.: Quaternary geologic map of the Minneapolis quadrangle, United States, Miscellaneous Investigations Series Map I-1420 (NL-15), edited by: Richmond, G. M. and Fullerton, D. S., U.S. Geological Survey, scale , 1983. a
Government of Newfoundland and Labrador: Geoscience atlas, Tech. rep., Geological Survey Division of the Department of Natural Resources, St. John's, NL, Canada, version: 3, Build: 1, Build Date: 22 October 2013. a
Gowan, E., Niu, L., Knorr, G., Lohmann, G., and Hinck, S.: Investigating the role of subglacial geology on ice sheet dynamics, Geophys. Res. Abstr., EGU2018-721, EGU General Assembly 2018, Vienna, Austria, 2018a. a
Gowan, E. J., Niu, L., Knorr, G., and Lohmann, G.: Geology datasets in North America, Greenland and surrounding areas for use with ice sheet models, PANGAEA, https://doi.org/10.1594/PANGAEA.895889, 2018b. a, b
Gowan, E. J., Tregoning, P., Purcell, A., Montillet, J.-P., and McClusky, S.: A model of the western Laurentide Ice Sheet, using observations of glacial isostatic adjustment, Quaternary Sci. Rev., 139, 1–16, https://doi.org/10.1016/j.quascirev.2016.03.003, 2016. a
Grasby, S. E. and Chen, Z.: Subglacial recharge into the Western Canada Sedimentary Basin – Impact of Pleistocene glaciation on basin hydrodynamics, Geol. Soc. Am. Bull., 117, 500–514, https://doi.org/10.1130/B25571.1, 2005. a
Gray, H. H., Bleuer, N. K., Lineback, J. A., Swadley, W. C., Richmond, G. M., Miller, R. A., Goldthwait, R. P., and Ward, R. A.: Quaternary geologic map of the Louisville quadrangle, United States, Miscellaneous Investigations Series MAP I-1420 (NJ-16), edited by: Richmond, G. M. and Fullerton, D. S., U.S. Geological Survey, scale 1:1 000 000, 1991. a
Gray, J. T. and Lauriol, B.: Dynamics of the late Wisconsin ice sheet in the Ungava Peninsula interpreted from geomorphological evidence, Arctic Alpine Res., 17, 289–310, https://doi.org/10.2307/1551019, 1985. a
Gregoire, L. J., Payne, A. J., and Valdes, P. J.: Deglacial rapid sea level rises caused by ice-sheet saddle collapses, Nature, 487, 219–222, https://doi.org/10.1038/nature11257, 2012. a
Gustafson, D. J.: A Geophysical Investigation of Dewatering Structures in Western Lake Superior, Master's thesis, University of Minnesota, 2012. a
Håkansson, L., Alexanderson, H., Hjort, C., Möller, P., Briner, J. P., Aldahan, A., and Possnert, G.: Late Pleistocene glacial history of Jameson Land, central East Greenland, derived from cosmogenic 10Be and 26Al exposure dating, Boreas, 38, 244–260, 2009. a
Hallberg, G. R., Lineback, J. A., Mickelson, D. M., Knox, J. C., Goebel, J. E., Hobbs, H. C., Whitfield, J. W., Ward, R. A., Boellstorf, J. D., Swinehart, J. B., and Dreeszen, V. H.: Quaternary Geologic Map of the Des Moines Quadrangle, United States, Miscellaneous Investigations Series Map I-1420 (NK-15), edited by: Richmond, G. M., Fullerton, D. S., and Christiansen, A. C., U.S. Geological Survey, scale , 1994. a
Harrison, J. C., St-Onge, M. R., Petrov, O. V., Strelnikov, S. I., Lopatin, B. G., Wilson, F. H., Tella, S., Paul, D., Lynds, T., Shokalsky, S. P., Hults, C. K., Bergman, S., Jepsen, H. F., and Solli, A.: Geological map of the Arctic, Map 2159A, Geological Survey of Canada, Ottawa, Canada, scale , 2011. a
Hartshorn, W. B., Thompson, W. F., Chapman, R. F., Black, R. F., Richmond, G. M., Grant, D. R., and Fullerton, D. S.: Quaternary geologic map of the Boston quadrangle, United States and Canada, Miscellaneous Investigations Series Map I-1420 (NK-19), edited by: Richmond, G. M. and Fullerton, D. S., U.S. Geological Survey, scale , 1991. a
Henriksen, N., Higgins, A. K., Kalsbeek, F., and Pulvertaft, T. C. R.: Greenland from Archaean to Quaternary, Geol. Surv. Den. Greenl., 18, 1–126, 2009. a
Hildes, D. H., Clarke, G. K., Flowers, G. E., and Marshall, S. J.: Subglacial erosion and englacial sediment transport modelled for North American ice sheets, Quaternary Sci. Rev., 23, 409–430, https://doi.org/10.1016/j.quascirev.2003.06.005, 2004. a
Hjort, C., Ingólfsson, Ó., and Norðdahl, H.: Late Quaternary geology and glacial history of Hornstrandir, northwest Iceland: a reconnaissance study, Jökull, 35, 9–29, 1985. a
Howard, A. D., Behling, R. E., Wheeler, W. H., Daniels, R. B., Swadley, W. C., Richmond, G. M., Goldthwait, R. P., Fullerton, D. S., Sevon, W. D., and Miller, R. A.: Quaternary geologic map of the Blue Ridge quadrangle, United States, Miscellaneous Investigations Series Map I-1420 (NJ-17), edited by: Richmond, G. M., Fullerton, D. S., and Christiansen, A. C., U.S. Geological Survey, scale , 1991. a
Hutchinson, D. R., Lewis, C. F., and Hund, G. E.: Regional stratigraphic framework of surficial sediments and bedrock beneath Lake Ontario, Geogr. Phys. Quatern., 47, 337–352, 1993. a
Ingólfsson, Ó.: Late Weichselian glacial geology of the lower Borgarfjördur region, western Iceland: a preliminary report, Arctic, 38, 210–213, 1985. a
Iverson, N. R. and Zoet, L. K.: Experiments on the dynamics and sedimentary products of glacier slip, Geomorphology, 244, 121–134, https://doi.org/10.1016/j.geomorph.2015.03.027, 2015. a, b, c
Jackson, G. D.: Geology, Belcher Islands, Nunavut, Open File 4923, scale 1 : 125 000, Geological Survey of Canada, https://doi.org/10.4095/292434, 2012. a
Josenhans, H. and Lehman, S.: Late glacial stratigraphy and history of the Gulf of St. Lawrence, Canada, Can. J. Earth Sci., 36, 1327–1345, https://doi.org/10.1139/e99-030, 1999. a
Josenhans, H. W. and Zevenhuizen, J.: Dynamics of the Laurentide ice sheet in Hudson Bay, Canada, Mar. Geol., 92, 1–26, https://doi.org/10.1016/0025-3227(90)90024-E, 1990. a
Karlstrom, T. N. V.: Surficial geology of Alaska, USGS Numbered Series IMAP 357, scale 1 : 584 000, U.S. Geological Survey, 1964. a
Karrow, P. F.: Quaternary Geology of the Great Lakes Subregion, in: Quaternary Geology of Canada and Greenland, edited by: Fulton, R. J., Vol. 1, chap. 4, 326–350, Geological Survey of Canada, 1989. a
King, E. L.: Quaternary unconsolidated sediment thickness on the Grand Banks of Newfoundland and northeast Newfoundland Shelf; a GIS database, Open File 7513, scale 1 : 500 000, Geological Survey of Canada, https://doi.org/10.4095/295113, 2014. a
Kjær, K. H., Larsen, E., van der Meer, J., Ingólfsson, Ó., Krüger, J., Benediktsson, Í. Ö., Knudsen, C. G., and Schomacker, A.: Subglacial decoupling at the sediment/bedrock interface: a new mechanism for rapid flowing ice, Quaternary Sci. Rev., 25, 2704–2712, https://doi.org/10.1016/j.quascirev.2006.06.010, 2006. a
Klassen, R.: Quaternary geology of the Southern Canadian Interior Plains, chap. 2, 138–166, Geological Survey of Canada, 1989. a
Kovanen, D. J. and Slaymaker, O.: Glacial imprints of the Okanogan Lobe, southern margin of the Cordilleran Ice Sheet, J. Quaternary Sci., 19, 547–565, https://doi.org/10.1002/jqs.855, 2004. a
Kulessa, B., Hubbard, A. L., Booth, A. D., Bougamont, M., Dow, C. F., Doyle, S. H., Christoffersen, P., Lindbäck, K., Pettersson, R., Fitzpatrick, A. A. W., and Jones, G. A.: Seismic evidence for complex sedimentary control of Greenland Ice Sheet flow, Science Advances, 3, e1603071, https://doi.org/10.1126/sciadv.1603071, 2017. a
Larsen, N. K., Kjær, K. H., Funder, S., Möller, P., van der Meer, J. J., Schomacker, A., Linge, H., and Darby, D. A.: Late Quaternary glaciation history of northernmost Greenland–Evidence of shelf-based ice, Quaternary Sci. Rev., 29, 3399–3414, 2010. a
Laske, G. and Masters, G.: A Global Digital Map of Sediment Thickness, EOS T. Am. Geophys. Un., 78, F483, 1997. a
Lewis, C. F. M., Cameron, G. D. M., King, E. L., Todd, B. J., and Blasco, S. M.: Structural contour, isopach and feature maps of Quaternary sediments in western Lake Ontario, Report INFO-0555, Atomic Energy Control Board, Ottawa, Canada, 1995. a
Licciardi, J., Clark, P., Jenson, J., and Macayeal, D.: Deglaciation of a soft-bedded Laurentide Ice Sheet, Quaternary Sci. Rev., 17, 427–448, https://doi.org/10.1016/S0277-3791(97)00044-9, 1998. a
Lineback, J. A., Dell, C. I., and Gross, D. L.: Glacial and postglacial sediments in Lakes Superior and Michigan, Geol. Soc. Am. Bull., 90, 781–791, https://doi.org/10.1130/0016-7606(1979)90<781:GAPSIL>2.0.CO;2, 1979. a
Lineback, J. A., Bleuer, N. K., Mickelson, D. M., Farrand, W. R., and Goldthwait, R. P.: Quaternary geologic map of the Chicago quadrangle, United States, Miscellaneous Investigations Series Map I-1420 (NK-16), edited by: Richmond, G. M. and Fullerton, D. S., U.S. Geological Survey, scale 1:1 000 000, 1983. a
Lipovsky, P. S. and Bond, J. D.: Yukon digital surficial geology compilation, digital release 1, Yukon Geological Survey, release date: 8 April 2014. a
Loring, D. H. and Nota, D. J. G.: Morphology and sediments of the Gulf of St. Lawrence, Bulletin of the Fisheries Research Board of Canada 182, Fisheries Research Board of Canada, 147 pp., 1973. a
MacLean, B.: Marine geology of Hudson Strait and Ungava Bay, Eastern Arctic Canada: Late Quaternary sediments, depositional environments, and late glacial-deglacial history derived from marine and terrestrial studies, Geological Survey of Canada Bulletin, 566, 200 pp., https://doi.org/10.4095/212180, 2001. a
MacLean, B., Blasco, S., Bennett, R., England, J., Rainey, W., Hughes-Clarke, J., and Beaudoin, J.: Ice keel seabed features in marine channels of the central Canadian Arctic Archipelago: evidence for former ice streams and iceberg scouring, Quaternary Sci. Rev., 29, 2280–2301, https://doi.org/10.1016/j.quascirev.2010.05.032, 2010. a
MacLean, B., Blasco, S., Bennett, R., Lakeman, T., Hughes-Clarke, J., Kuus, P., and Patton, E.: New marine evidence for a Late Wisconsinan ice stream in Amundsen Gulf, Arctic Canada, Quaternary Sci. Rev., 114, 149–166, https://doi.org/10.1016/j.quascirev.2015.02.003, 2015. a
Margold, M., Stokes, C. R., and Clark, C. D.: Ice streams in the Laurentide Ice Sheet: Identification, characteristics and comparison to modern ice sheets, Earth-Sci. Rev., 143, 117–146, 2015. a
Massey, N. W. D., MacIntyre, D. G., Desjardins, P. J., and Cooney, R. T.: Digital map of British Columbia: whole province, GeoFile 2005-1, B.C. Ministry of Energy and Mines, Victoria, BC, Canada, scale , 2005. a
Matile, G. L. D. and Keller, G. R.: Surficial Geology Compilation Map Series, Tech. rep., Manitoba Science, Technology, Energy and Mines, Manitoba Geological Survey, scale , available at: https://www.manitoba.ca/iem/geo/gis/geoscience.html (last access: 13 October 2017), 2006. a, b, c
McMartin, I., Dredge, L. A., Ford, K. L., and Kjarsgaard, I. M.: Till composition, provenance and stratigraphy beneath the Keewatin Ice Divide, Schultz Lake area (NTS 66A), mainland Nunavut, Open File 5312, Geological Survey of Canada, 2006. a
Melanson, A., Bell, T., and Tarasov, L.: Numerical modelling of subglacial erosion and sediment transport and its application to the North American ice sheets over the Last Glacial cycle, Quaternary Sci. Rev., 68, 154–174, https://doi.org/10.1016/j.quascirev.2013.02.017, 2013. a
Morlighem, M., Williams, C. N., Rignot, E., An, L., Arndt, J. E., Bamber, J. L., Catania, G., Chauché, N., Dowdeswell, J. A., Dorschel, B., Fenty, I., Hogan, K., Howat, I., Hubbard, A., Jakobsson, M., Jordan, T. M., Kjeldsen, K. K., Millan, R., Mayer, L., Mouginot, J., Noël, B. P. Y., O'Cofaigh, C., Palmer, S., Rysgaard, S., Seroussi, H., Siegert, M. J., Slabon, P., Straneo, F., van den Broeke, M. R., Weinrebe, W., Wood, M., and Zinglersen, K. B.: BedMachine v3: Complete bed topography and ocean bathymetry mapping of Greenland from multibeam echo sounding combined with mass conservation, Geophys. Res. Lett., 44, 11051–11061, https://doi.org/10.1002/2017GL074954, 2017. a
Niessen, F., Matthiessen, J., and Stein, R.: Sedimentary environment and glacial history of the Northwest Passage (Canadian Arctic Archipelago) reconstructed from high-resolution acoustic data, Polarforschung, 79, 65–80, 2010. a
Niu, L., Lohmann, G., Hinck, S., and Gowan, E. J.: Sensitivity of atmospheric forcing on Northern Hemisphere ice sheets during the last glacial-interglacial cycle using output from PMIP3, Clim. Past Discuss., https://doi.org/10.5194/cp-2017-105, 2017. a, b
Ontario Geological Survey: Quaternary Geology of Ontario, Tech. Rep. Dataset 14, scale 1 : 1 000 000, digital map, 1997. a
Ontario Geological Survey: Surficial geology of southern Ontario, Miscellaneous Release Data 128, revised 2010, 2003. a
Piotrowski, J. A., Mickelson, D. M., Tulaczyk, S., Krzyszkowski, D., and Junge, F. W.: Were deforming subglacial beds beneath past ice sheets really widespread?, Quaternary Int., 86, 139–150, https://doi.org/10.1016/S1040-6182(01)00056-8, 2001. a
Piotrowski, J. A., Larsen, N. K., and Junge, F. W.: Reflections on soft subglacial beds as a mosaic of deforming and stable spots, Quaternary Sci. Rev., 23, 993–1000, https://doi.org/10.1016/j.quascirev.2004.01.006, 2004. a
Piper, D. J. W., Mudie, P. J., Fader, G. B., Josenhans, H. W., MacLean, B., and Vilks, G.: Quaternary geology of the southwestern Canadian Shield, in: Geology of the Continental Margin of Eastern Canada, edited by: Keen, M. J. and Williams, G. L., Geology of Canada Series 2, chap. 10, 475–607, Geological Survey of Canada, 1990. a
PISM authors: PISM, a Parallel Ice Sheet Model, available at: http://www.pism-docs.org, last access: 19 October 2017. a
Plouffe, A.: Quaternary geology of the Fort Fraser and Manson River map areas, central British Columbia, Bulletin 554, scale 1 : 250 000, Geological Survey of Canada, https://doi.org/10.4095/211641, 2000. a
Prest, V. K.: Surficial Deposits of Prince Edward Island, Map 1366A, scale 1 : 126 720, Geological Survey of Canada, https://doi.org/10.4095/108971, 1973. a
Principato, S. M., Jennings, A. E., Kristjánsdóttir, G. B., and Andrews, J. T.: Glacial-marine or subglacial origin of diamicton units from the southwest and north Iceland shelf: implications for the glacial history of Iceland, J. Sediment. Res., 75, 968–983, https://doi.org/10.2110/jsr.2005.073, 2005. a
Rampton, V. N.: Quaternary geology of the Tuktoyaktuk coastlands, Northwest Territories, Memoir 423, Energy, Mines and Resources Canada, 1988. a
Reed, J. C., Wheeler, J. O., and Tucholke, B. E.: Geologic Map of North America: Decade of North American Geology, Map 001, scale 1 : 500 000, Geological Society of America, 2004. a, b
Sado, E. V., Fullerton, D. S., Baker, C. L., and Farrand, W. R.: Quaternary Geologic Map of the Sudbury quadrangle, United States and Canada, Miscellaneous Investigations Series Map I-1420 (NL-17), edited by: Fullerton, D. S., U.S. Geological Survey, scale 1:1 000 000, 1993. a
Sado, E. V., Fullerton, D. S., and Farrand, W. R.: Quaternary Geologic Map of the Lake Nipigon quadrangle, United States and Canada, Miscellaneous Investigations Series Map I-1420 (NM-16), edited by: Fullerton, D. S., U.S. Geological Survey, scale 1:1 000 000, 1994. a
Sado, E. V., Fullerton, D. S., Goebel, J. E., and Ringrose, S. M.: Quaternary Geologic Map of the Lake of the Woods quadrangle, United States and Canada, Miscellaneous Investigations Series Map I-1420 (NM-15), edited by: Fullerton, D. S., U.S. Geological Survey, scale 1:1 000 000, 1995. a
Scholz, C. A.: Late and Post-glacial Lacustrine Sediment Distribution in western Lake Superior From Seismic Reflection Profiles, in: Thirtieth Annual Institute On Lake Superior Geology, Wausau, Wisconsin, United States, 61–62, 1984. a
Schreiner, B. T.: Quaternary geology of the Precambrian Shield, Saskatchewan, Report 221, scale: 1 : 1 000 000, Saskatchewan Energy and Mines, Saskatchewan Geological Survey, 1984. a
Simpson, M. A.: Surficial Geology Map of Saskatchewan, Map, scale 1 : 1 000 000, Environment Branch, Saskatchewan Research Council, from surficial geology maps at 1 : 250 000 scale by Campbell, J. E. and Simpson, M. A., and 1 : 1 000 000 scale by Schreiner, B. T., 1997. a
Soller, D. R. and Garrity, C. P.: Quaternary sediment thickness and bedrock topography of the glaciated United States east of the Rocky Mountains, Scientific Investigations Map 3392, scale 1 : 5 000 000, U.S. Geological Survey, https://doi.org/10.3133/sim3392, 2018. a, b
Soller, D. R. and Reheis, M. C.: Surficial Materials in the Conterminous United States, U.S. Geological Survey Open File Report OFR-03-275, U.S. Geological Survey, scale , available at: https://pubs.er.usgs.gov/publication/ofr2003275 (last access: 5 August 2016), 2004. a, b
Soller, D. R., Reheis, M. C., Garrity, C. P., and Van Sistine, D. R.: Map Database for Surficial Materials in the Conterminous United States, U.S. Geological Survey Data Series 425, U.S. Geological Survey, available at: http://pubs.usgs.gov/ds/425, scale 1:5,000,000 (last access: 5 August 2016), 2009. a
Stea, R. R., Conley, H., and Brown, Y.: Surficial geology of the province of Nova Scotia, Map 92-3, Nova Scotia Department of Natural Resources, Mines and Energy Branchs, Halifax, Nova Scotia, Canada, scale 1:500 000, 1992. a
Stokes, C. R., Clark, C. D., Lian, O. B., and Tulaczyk, S.: Ice stream sticky spots: a review of their identification and influence beneath contemporary and palaeo-ice streams, Earth-Sci. Rev., 81, 217–249, https://doi.org/10.1016/j.earscirev.2007.01.002, 2007. a
Stokes, C. R., Tarasov, L., and Dyke, A. S.: Dynamics of the North American Ice Sheet Complex during its inception and build-up to the Last Glacial Maximum, Quaternary Sci. Rev., 50, 86–104, https://doi.org/10.1016/j.quascirev.2012.07.009, 2012. a
St-Onge, M. R., Van Gool, J. A., Garde, A. A., and Scott, D. J.: Correlation of Archaean and Palaeoproterozoic units between northeastern Canada and western Greenland: constraining the pre-collisional upper plate accretionary history of the Trans-Hudson orogen, Geol. Soc. Spec. Publ., 318, 193–235, https://doi.org/10.1144/SP318.7, 2009. a
Storrar, R. D., Stokes, C. R., and Evans, D. J.: Morphometry and pattern of a large sample (>20 000) of Canadian eskers and implications for subglacial drainage beneath ice sheets, Quaternary Sci. Rev., 105, 1–25, https://doi.org/10.1016/j.quascirev.2014.09.013, 2014. a
Sugden, D.: Landscapes of glacial erosion in Greenland and their relationship to ice, topographic and bedrock conditions, in: Progress in geomorphology: Papers in honour of David L. Linton, Institute of British Geographers, London, UK, Special publication, no. 7, 177–195, 1974. a, b
Swinehart, J. B., Dreeszen, V. H., Richmond, G. M., Tipton, M. J., Bretz, R., Steece, F. V., Hallberg, G. R., and Goebel, J. E.: Quaternary geologic map of the Platte River quadrangle, United States, Miscellaneous Investigations Series Map I-1420 (NK-14), edited by: Richmond, G. M., U.S. Geological Survey, scale 1:1 000 000, 1994. a
Tarasov, L. and Peltier, W.: A geophysically constrained large ensemble analysis of the deglacial history of the North American ice-sheet complex, Quaternary Sci. Rev., 23, 359–388, https://doi.org/10.1016/j.quascirev.2003.08.004, 2004. a
Tarasov, L., Dyke, A. S., Neal, R. M., and Peltier, W.: A data-calibrated distribution of deglacial chronologies for the North American ice complex from glaciological modeling, Earth Planetary Sc. Lett., 315–316, 30–40, https://doi.org/10.1016/j.epsl.2011.09.010, 2012. a
Teller, J. T. and Fenton, M. M.: Late Wisconsinan glacial stratigraphy and history of southeastern Manitoba, Can. J. Earth Sci., 17, 19–35, https://doi.org/10.1139/e80-002, 1980. a
Thériault, R., Beauséjour, S., and Tremblay, A.: Geological map of Quebec, QERPUB – Publication du M.E.R. DV2012-07, scale 1 : 2 000 000, Ministère des Resources naturelles, Québec, 2012. a
Thorleifson, L. H., Wyatt, P. H., Shilts, W., and Nielsen, E.: Hudson Bay lowland Quaternary stratigraphy: evidence for early Wisconsinan glaciation centered in Quebec, in: The Last Interglacial–Glacial Transition in North America, edited by: Clark, P. U. and Lea, P. D., Vol. 270 of Special Paper, 207–221, Geological Society of America, https://doi.org/10.1130/SPE270-p207, 1992. a
Todd, B., Lewis, C., Nielsen, E., Thorleifson, L., Bezys, R., and Weber, W.: Lake Winnipeg: geological setting and sediment seismostratigraphy, J. Paleolimnol., 19, 215–243, https://doi.org/10.1023/A:1007997024412, 1998. a
Todd, B. J. and Shaw, J.: Laurentide Ice Sheet dynamics in the Bay of Fundy, Canada, revealed through multibeam sonar mapping of glacial landsystems, Quaternary Sci. Rev., 58, 83–103, https://doi.org/10.1016/j.quascirev.2012.10.016, 2012. a
Todd, B. J., Fader, G. B., Courtney, R. C., and Pickrill, R. A.: Quaternary geology and surficial sediment processes, Browns Bank, Scotian Shelf, based on multibeam bathymetry, Mar. Geol., 162, 165–214, https://doi.org/10.1016/S0025-3227(99)00092-4, 1999. a
Tulaczyk, S., Kamb, W. B., and Engelhardt, H. F.: Basal mechanics of Ice Stream B, West Antarctica: 2. Undrained plastic bed model, J. Geophys. Res.-Sol. Ea., 105, 483–494, https://doi.org/10.1029/1999JB900328, 2000. a
Uchupi, E. and Bolmer, S.: Geologic evolution of the Gulf of Maine region, Earth-Sci. Rev., 91, 27–76, https://doi.org/10.1016/j.earscirev.2008.09.002, 2008. a
Voges, A.: International Quaternary Map of Europe, Map IQuaME2500, Bundesanstalt für Geowissenschaften und Rohstoffe, Hannover, Germany, scale , 1995. a
Walter, F., Chaput, J., and Lüthi, M. P.: Thick sediments beneath Greenland's ablation zone and their potential role in future ice sheet dynamics, Geology, 42, 487–490, https://doi.org/10.1130/G35492.1, 2014. a
Weidick, A. and Christoffersen, M.: Quaternary Map of Greenland Søndre Strømfjord – Nûgssuaq, Map Sheet 3, scale 1 : 500 000, The Geological Survey of Greenland, 1974. a
Weidick, A. and Christoffersen, M.: Quaternary Map of Greenland Frederikshåbs Isblink – Søndre Strømfjord, Map Sheet 2, scale 1 : 500 000, The Geological Survey of Greenland, 1978. a
Weidick, A. and Klüver, B. G.: Quaternary Map of Greenland SydgrønSund, Map Sheet 1, scale 1 : 500 000, The Geological Survey of Greenland, 1987. a
Wessel, P., Smith, W. H., Scharroo, R., Luis, J., and Wobbe, F.: Generic mapping tools: improved version released, EOS T. Am. Geophys. Un., 94, 409–410, https://doi.org/10.1002/2013EO450001, 2013. a
Wheeler, J. O., Hoffman, P. F., Card, K. D., Davidson, A., Sanford, B. V., Okulitch, A. V., and Roest, W. R.: Geological Map of Canada, Map 1860A, scale 1 : 5 000 000, Geological Survey of Canada, https://doi.org/10.4095/208175, 1996. a, b
Whitfield, J. W., Ward, R. A., Denne, J. E., Holbrook, D. F., Bush, W. V., Lineback, J. A., Luza, K. V., Jensen, K. M., and Fishman, W. D.: Quaternary geologic map of the Ozark Plateau quadrangle, United States, Miscellaneous Investigations Series Map I-1420 (NJ-15), edited by: Richmond, G. M. and Weide, D. L., U.S. Geological Survey, scale , 1993. a
Wilson, F. H., Hults, C. P., Mull, C. G., and Karl, S. M.: Geologic map of Alaska, Scientific Investigations Map 3340, scale 1 : 1 584 000, United States Geological Survey, https://doi.org/10.3133/sim3340, pamphlet 196, 2015. a
Yukon Geological Survey: Yukon Digital Bedrock Geology, Tech. rep., available at: http://www.geology.gov.yk.ca/update_yukon_bedrock_geology_map.html, last access: 2 September 2016. a