the Creative Commons Attribution 4.0 License.
the Creative Commons Attribution 4.0 License.
 | 02 May 2019
30 years of European Commission Radioactivity Environmental Monitoring data bank (REMdb) – an open door to boost environmental radioactivity research
Marco Sangiorgi
Miguel Angel Hernández Ceballos
Giorgia Iurlaro
Giorgia Cinelli
Marc de Cort
The Radioactivity Environmental Monitoring data bank (REMdb) was created in the aftermath of the Chernobyl accident (1986) by the European Commission (EC) – Directorate-General Joint Research Centre (DG JRC), sited in Ispra (Italy). Since then it has been maintained there with the aim to keep a historical record of the Chernobyl accident and to store the radioactivity monitoring data gathered through the national environmental monitoring programs of the member states (MSs). The legal basis is the Euratom Treaty, Chapter III Health and Safety, Articles 35 and 36, which clarify that MSs shall periodically communicate to the EC information on environmental radioactivity levels. By collecting and validating this information in REMdb, JRC supports the DG for Energy in its responsibilities in returning qualified information to the MSs (competent authorities and general public) on the levels of radioactive contamination of the various compartments of the environment (air, water, soil) on the European Union scale. REMdb accepts data on radionuclide concentrations from EU MSs in both environmental samples and foodstuffs from 1984 onwards. To date, the total number of data records stored in REMdb exceeds 5 million, in this way providing the scientific community with a valuable archive of environmental radioactivity topics in Europe. Records stored in REMdb are publicly accessible until 2011 through an unrestricted repository “REM data bank – Years 1984–2006” https://doi.org/10.2905/jrc-10117-10024 (De Cort et al., 2007) and “REM data bank – Years 2007–2011” https://doi.org/10.2905/de42f259-fafe-4329-9798-9d8fabb98de5 (De Cort et al., 2012). Access to data from 2012 onwards is granted only after explicit request, until the corresponding monitoring report is published. Each data record contains information describing the sampling circumstances (sampling type, begin and end time), measurement conditions (value, nuclide, apparatus, etc.), location and date of sampling, and original data reference. In this paper the scope, features and extension of REMdb are described in detail.


Radiation occurs when energy is emitted by a source and then travels through a medium, until it is absorbed by matter. In this sense, radiation is a fact of life as every person, animal and object is subjected to radiation every day. Radiation can be either ionizing or non-ionizing. Whenever we refer to radiation in this paper, we mean ionizing radiation unless we say otherwise. By definition (ICRP, 1990), ionizing radiation is a radiation with enough energy to break chemical bonds; this includes X-rays and gamma rays, while a source is anything which may cause exposure, by emitting ionizing radiation or by releasing radioactive substances or radioactive material, and can be treated as a single entity for purposes of protection and safety.
About 80 % of radioactivity in the environment derives from natural sources (background radiation), the rest being associated with the creation and use of artificial sources by human activities, such as medical applications. The main natural sources are cosmic radiation, which is generated by interaction of primary radiation (mainly protons) with atoms of the atmosphere (e.g. Cinelli et al., 2017); terrestrial radiation, which is produced as a consequence of the presence of radioactive materials in the Earth's crust, such as 40K, 238U and 232Th and their daughter nuclides (UNSCEAR, 2008); and internal radiation, which is generated by the presence of 40K, 14C and 210Pb in human bodies from birth. As a consequence of anthropogenic activities, such as Chernobyl and Fukushima (e.g. Imanaka et al., 2015), detonations of nuclear weapons (e.g. Gabrieli et al., 2011), nuclear waste handling and disposal, medical procedures (e.g. diagnostic X-rays, radiation therapy) (e.g. Alkhorayef et al., 2018), and mining (e.g. Carvalho et al., 2014), the background radioactivity level has increased.
The hazards to people and the environment from radioactive contamination depend on the nature of the radioactive contaminant, the level of contamination and the extent of the spread of contamination (e.g. Ogundare and Adekoya, 2015). Elevated levels of radioactive elements in the environment, resulting from natural or anthropogenic activities, can be a significant problem for the ecosystem and may threaten human health, especially if they build up in the food chain. Consequently, ionizing radiation has to be assessed and, if necessary, controlled. In this line, the importance of an adequate characterization of the variability and uncertainty in exposure assessments for human health risk assessments has been emphasized by several national and international organizations (e.g. WHO/FAO, 2006; InVS and AFSSET, 2007). Monitoring radioactivity in the environment is of utmost importance in order to observe trends over time and to verify that there is compliance with the Basic Safety Standards Directive (2000/473/Euratom, 2000; 2013/59/Euratom, 2013; IAEA, 2014).
The transboundary nature and the amount of the contamination during the Chernobyl accident triggered the international organizations to promote international cooperation and communication in nuclear, radiation, and emergency preparedness and response. Under the Euratom Treaty (Council Decision 87/600/EURATOM of 14 December 1987), Article 36 requires the competent authorities of each member state (MS) to regularly provide the environmental radioactivity monitoring data resulting from their Article 35 obligations to the European Commission (EC) in order to keep the EC informed on the levels of radioactivity in the environment (air, water, milk and mixed diet) which could affect population.
The continuous communication of environmental radioactivity monitoring data after the Chernobyl accident to the EC from MSs triggered the need to integrate, store and organize them so that the collection of information can be easily accessed, managed and updated. With this purpose, the number and diversity of environmental radioactivity data received from the MSs have been and are routinely stored in the Radioactivity Environmental Monitoring data bank (REMdb) (https://rem.jrc.ec.europa.eu/RemWeb/, last access: 21 December 2018), which is managed by the EC Joint Research Centre (JRC) sited in Ispra (Italy) as part of its Directorate-General for Energy (DG ENER) support programme. REMdb is the base to annually inform of the radioactivity levels in the environment in the European community, as stated in Article 35–36 of the Euratom Treaty. Every MS has its own database and they submit just a part of their measurements to REMdb.
Environmental radioactivity databases contribute to scientific knowledge of the processes affecting radionuclide distribution and the sources introducing radioactivity into the environment. They provide critical inputs to the evaluation of the environmental radionuclide levels at regional and global scales, deliver information on temporal trends of radionuclides levels, and identify gaps in available information. They are also used as a basis for the assessment of the radiation doses to local, regional and global human populations and biota. In this sense, REMdb makes accessible and understandable to a wider audience radioactivity measurements made by all MSs in air, water, milk and mixed diet in the aftermath of the Chernobyl accident, and brings to the scientific community research opportunities to exploit a unique collection of nearly 5 million environmental radioactivity measurements since 1984.
This paper addresses the scope, features and extensions of REMdb with the intention to provide the scientific community with easy access to these data. Since REMdb is constantly growing, this paper decided to refer to data up to 2016, which are almost fully validated at the time this paper is written. The REMdb measurements are public until 2011 (http://data.jrc.ec.europa.eu/collection/id-0117, last access: 21 December 2018), while access to data from 2012 is restricted until relative monitoring reports are released and may be granted only after explicit request. In this paper, REMdb data and monitoring networks are described in Sect. 2, as well as the applied quality control methodology. Then, Sect. 3 presents the status of REMdb for the sampling media recommended by the EC. Finally, data record details and conclusions are reported in Sects. 4 and 5 respectively.
The primary scope of REMdb is to provide a unique and single framework for working with environmental radioactivity data originating from many and diverse sources. REMdb was set up in 1988 and collects in a harmonized format environmental radioactivity data for environmental samples, foodstuffs and other media from 1984 onwards.
There has been significant effort in updating REMdb at a frequent, regular basis in a consistent and systematic way to preserve the integrity of information deposited in the database. The database is currently hosted on an internal JRC server, equipped with the latest version of Oracle 12c RDBMS (relational database management system). The servers are within the JRC internal firewall. They are centrally managed and adhere to all JRC security guidelines and policies. They are accessible under custom applications (DST, RemWeb, etc.) and third-party software (SQL Developer) through standard communication protocols like SSH, SFTP and TCP/IP. Automatic backups occur on the server.
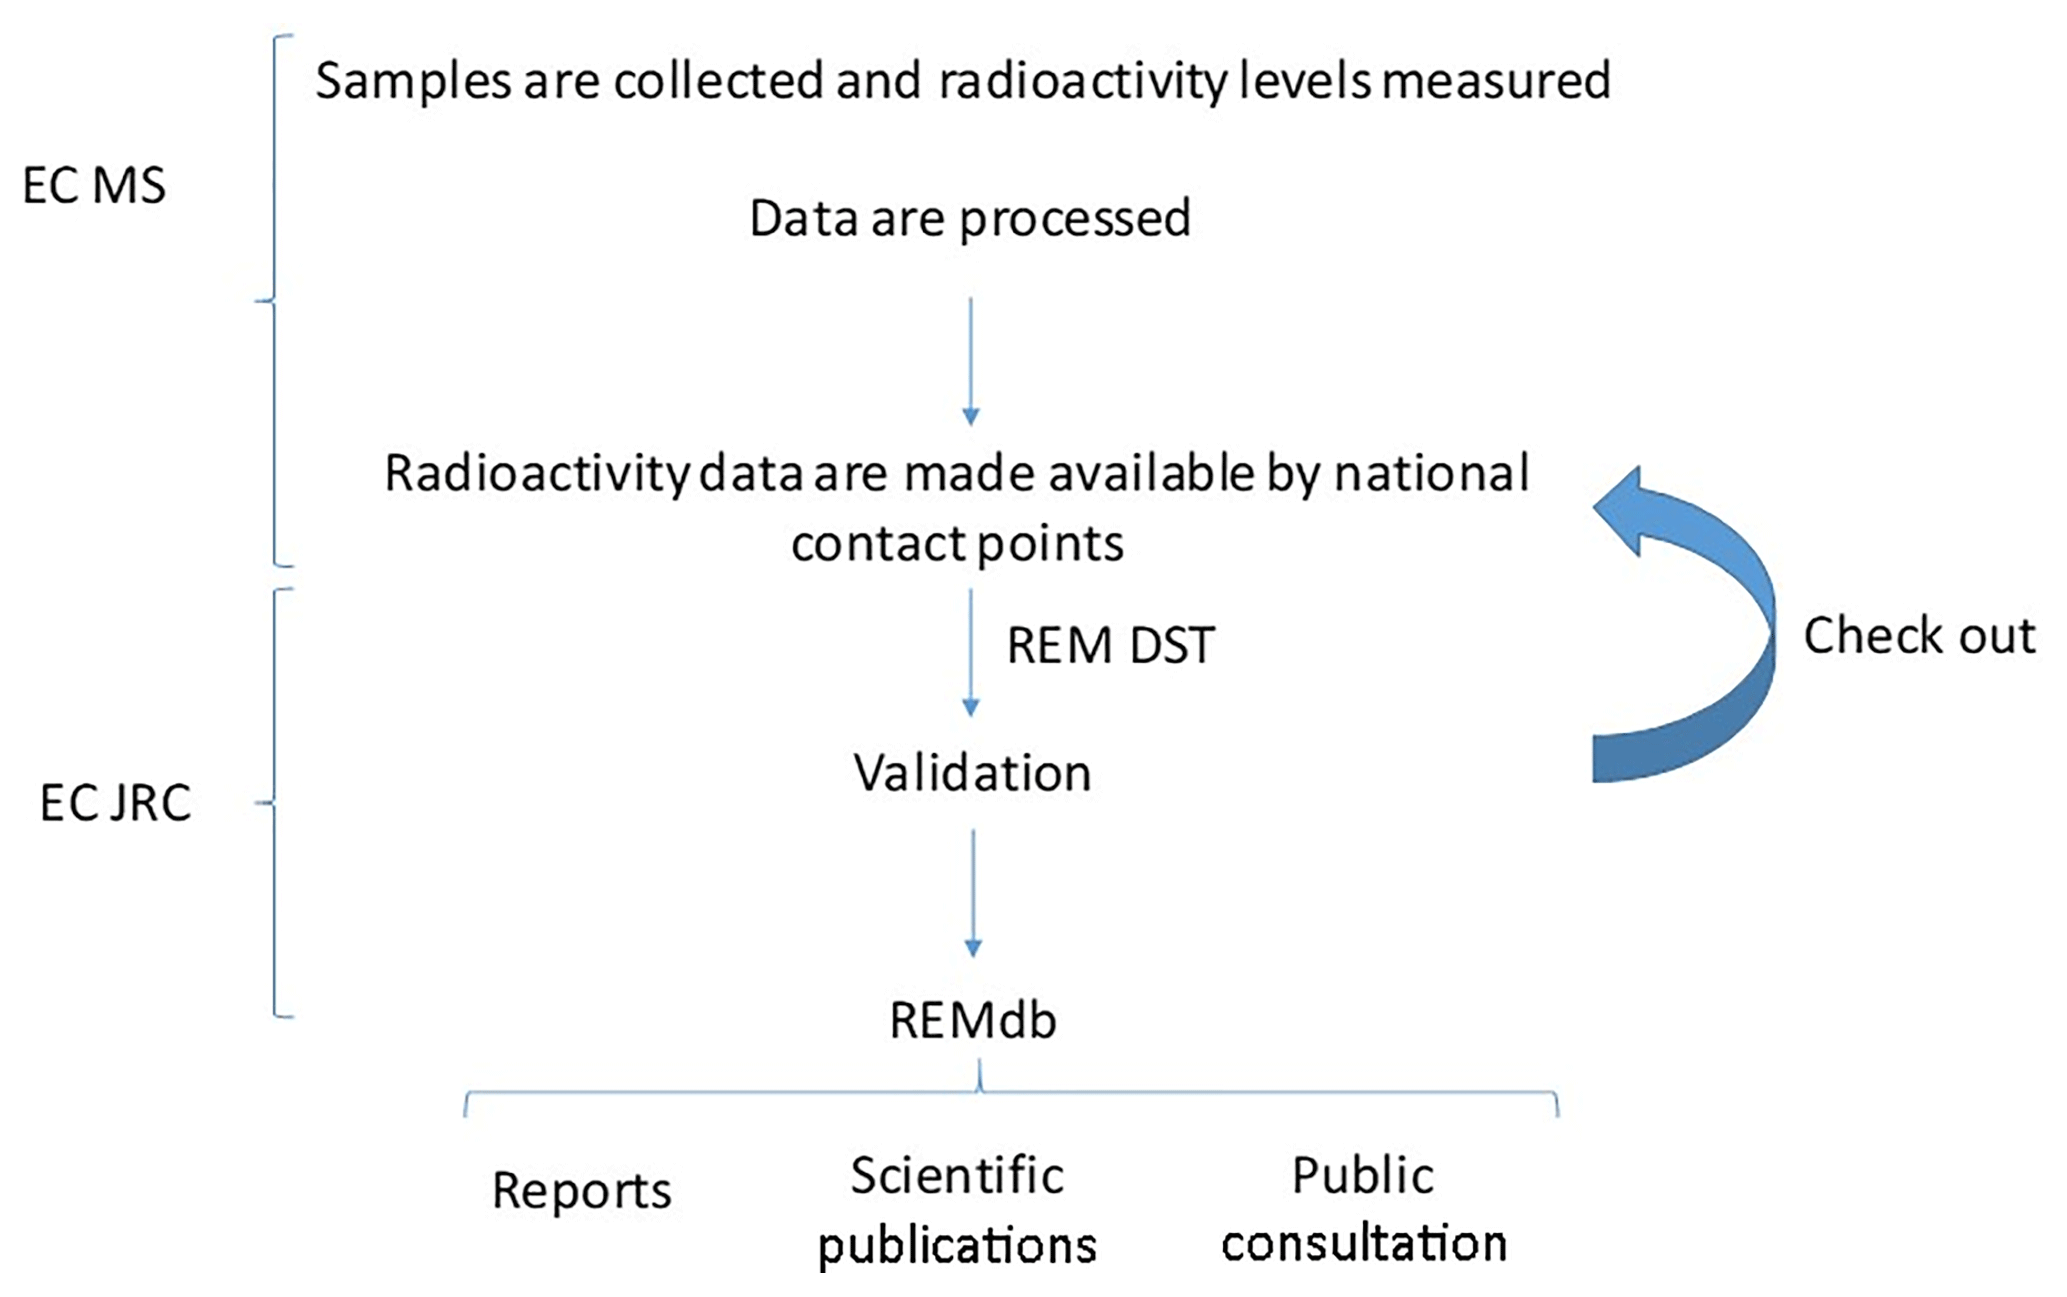
Figure 1 sketches the process from the collection of samples to the final store of data in REMdb. First samples are collected and radioactivity levels are measured by the MSs in specialized and accredited laboratories; once measurements are processed they are made available to the National Contact Points and submitted into REMdb by using a tool called REM Data Submission Tool; submitted data are checked by JRC, shown back to those who have submitted them and validated. Finally, after validation, data are processed for the creation of a yearly monitoring report and made freely available to the public. An important tool in this process is the REM Data Submission Tool (REM DST) by which data are sent on a regular basis by the national contact points of the EU-28 (28 member countries of the EU) to the JRC. It is worth pointing out that the JRC assists MSs in using REM DST correctly by organizing regular training courses (e.g. the 2018 edition was held on 13–14 November).
Once the data are gathered from the MSs, the database is conceived as a series of data records, each one containing a single measurement of a single radionuclide on a single sample, and does not include summary statistics, which have to be created ex post.
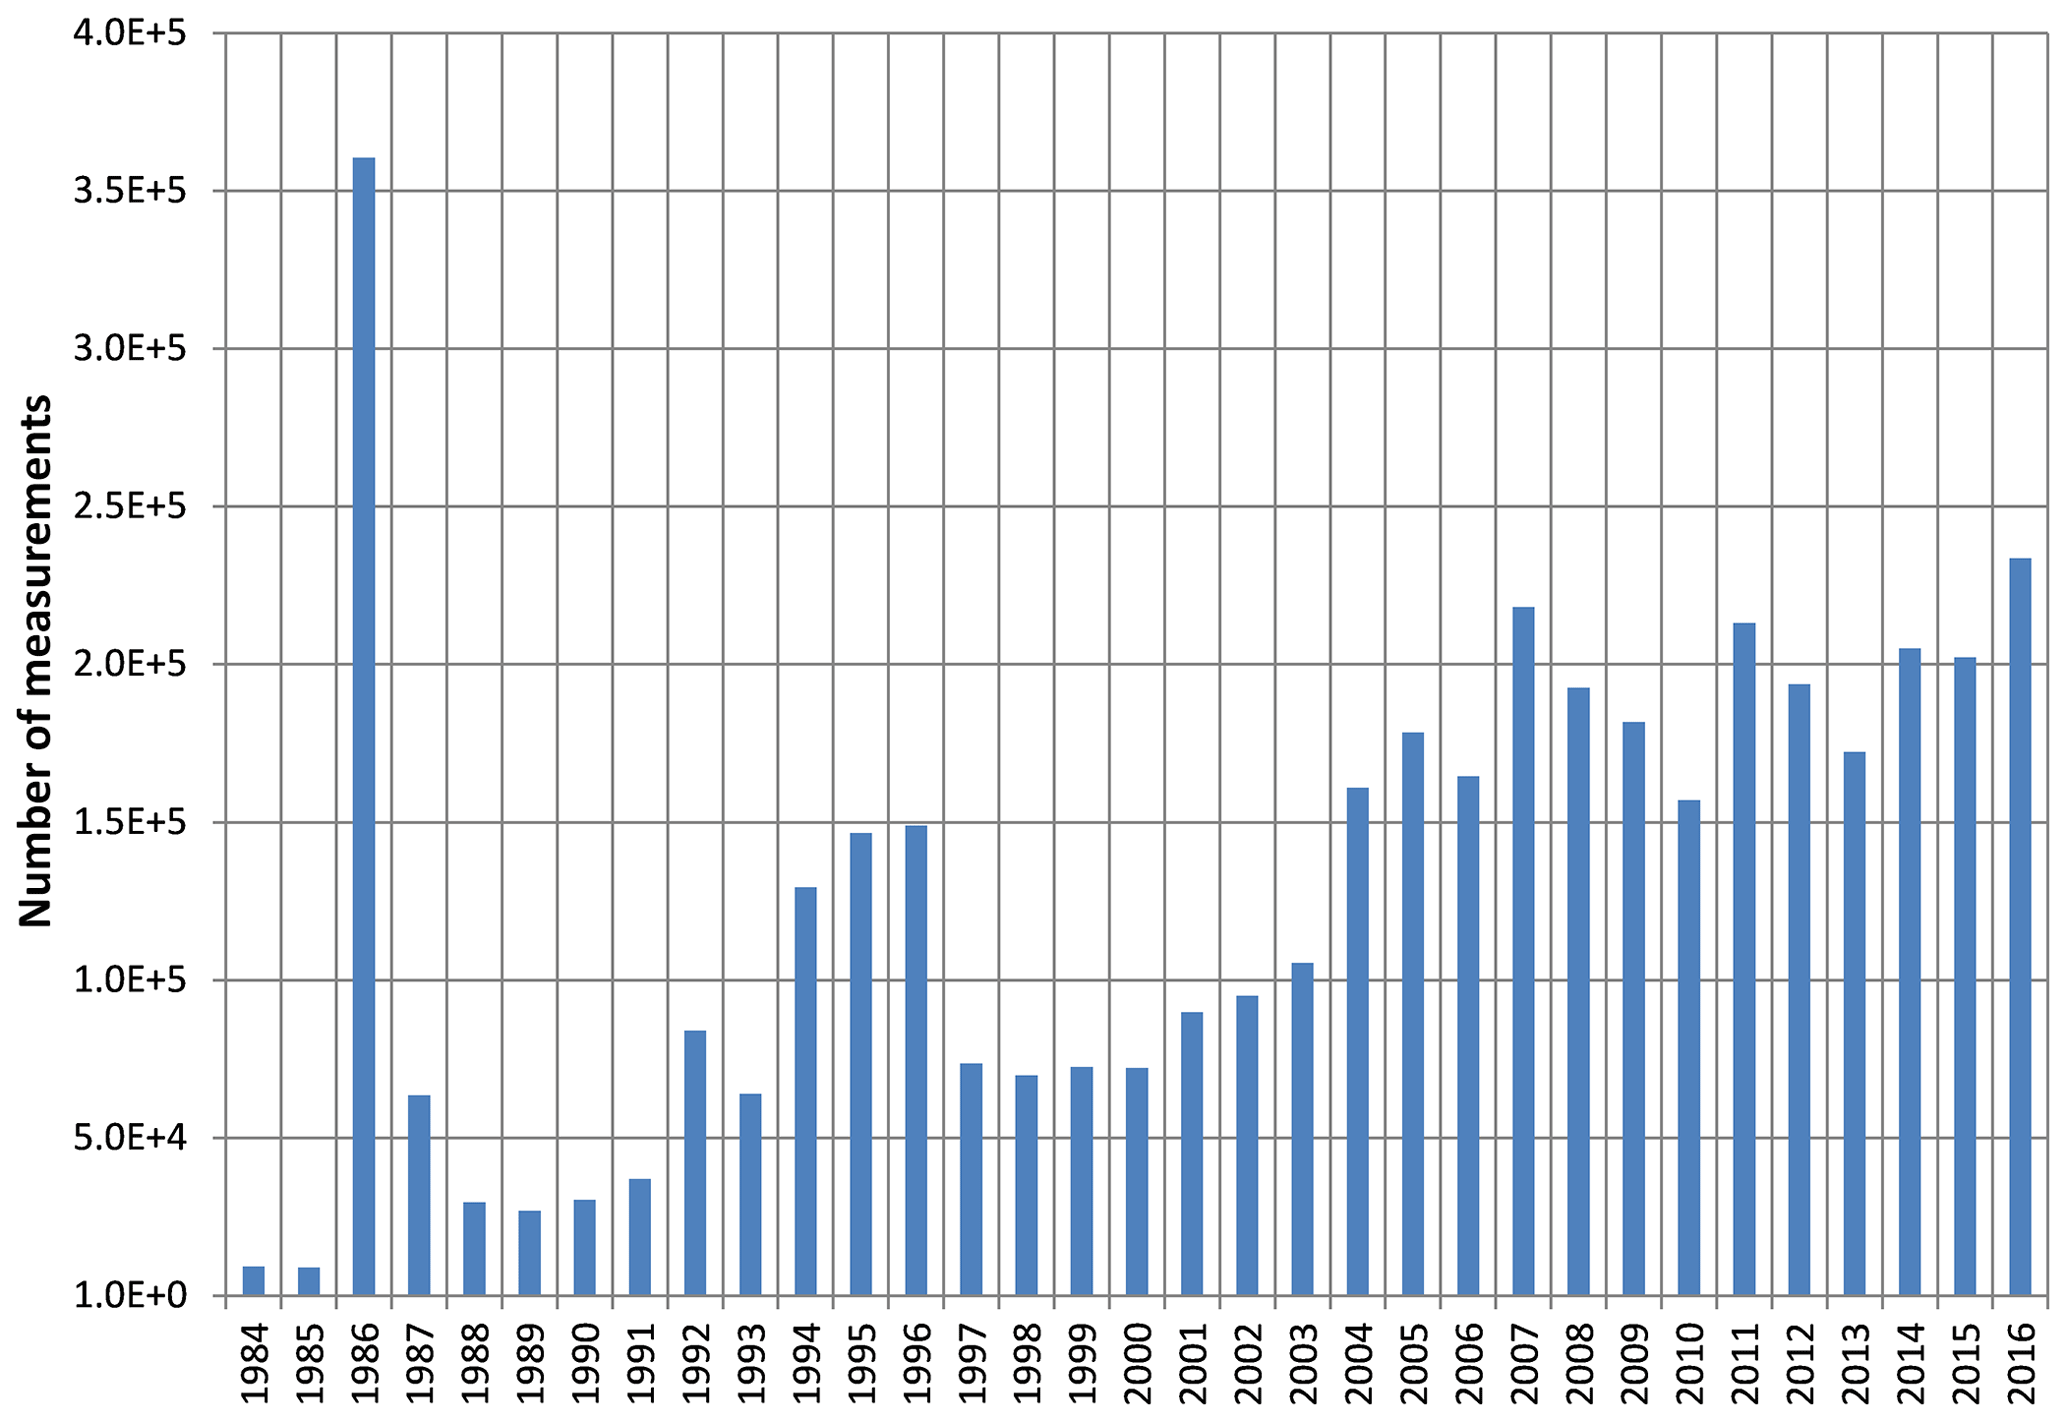
At present, the total number of data records stored in REMdb exceeds 5 million. Figure 2 shows the number of data stored in REMdb from 1984 to 2016. It is clear that the Chernobyl accident generated a peak in the number of measurements and created consciousness about the importance of monitoring radioactivity. Additionally, the increase in data observed from 1994 to 1996 is also associated with Chernobyl, due to the compilation of contamination data from countries or regions in Europe resulting from the radioactive material released during the accident. For instance, after data validation and inter-comparison, the “Atlas of caesium deposition on Europe after the Chernobyl accident” was published in 1998 (De Cort et al., 1998).
The yearly evolution of measurements stored in REMdb is also influenced, as one can expect, by the number of countries which joined REMdb since its creation. The number of submitted measurements ranges from 1 million for Germany and France to 10 000 for Ireland, Denmark and Greece. Figure 3 shows the year in which each country started submitting measurements to REMdb, and displays the great difference in the number of measurements from country to country (on a logarithmic scale). Czech Republic, Lithuania, Estonia, Latvia, Poland and Bulgaria (marked in red) joined REMdb in 2002, but Poland made available samples since 1986. Slovenia (marked in orange) joined in 2003; Slovakia, and Romania (marked in yellow) joined in 2004; Cyprus (marked in light green) joined in 2006 and Malta (marked in dark green) in 2008. REMdb contains a large and representative number of measurements for each MS, in spite of a large range of variability in the number of measurements from country to country.
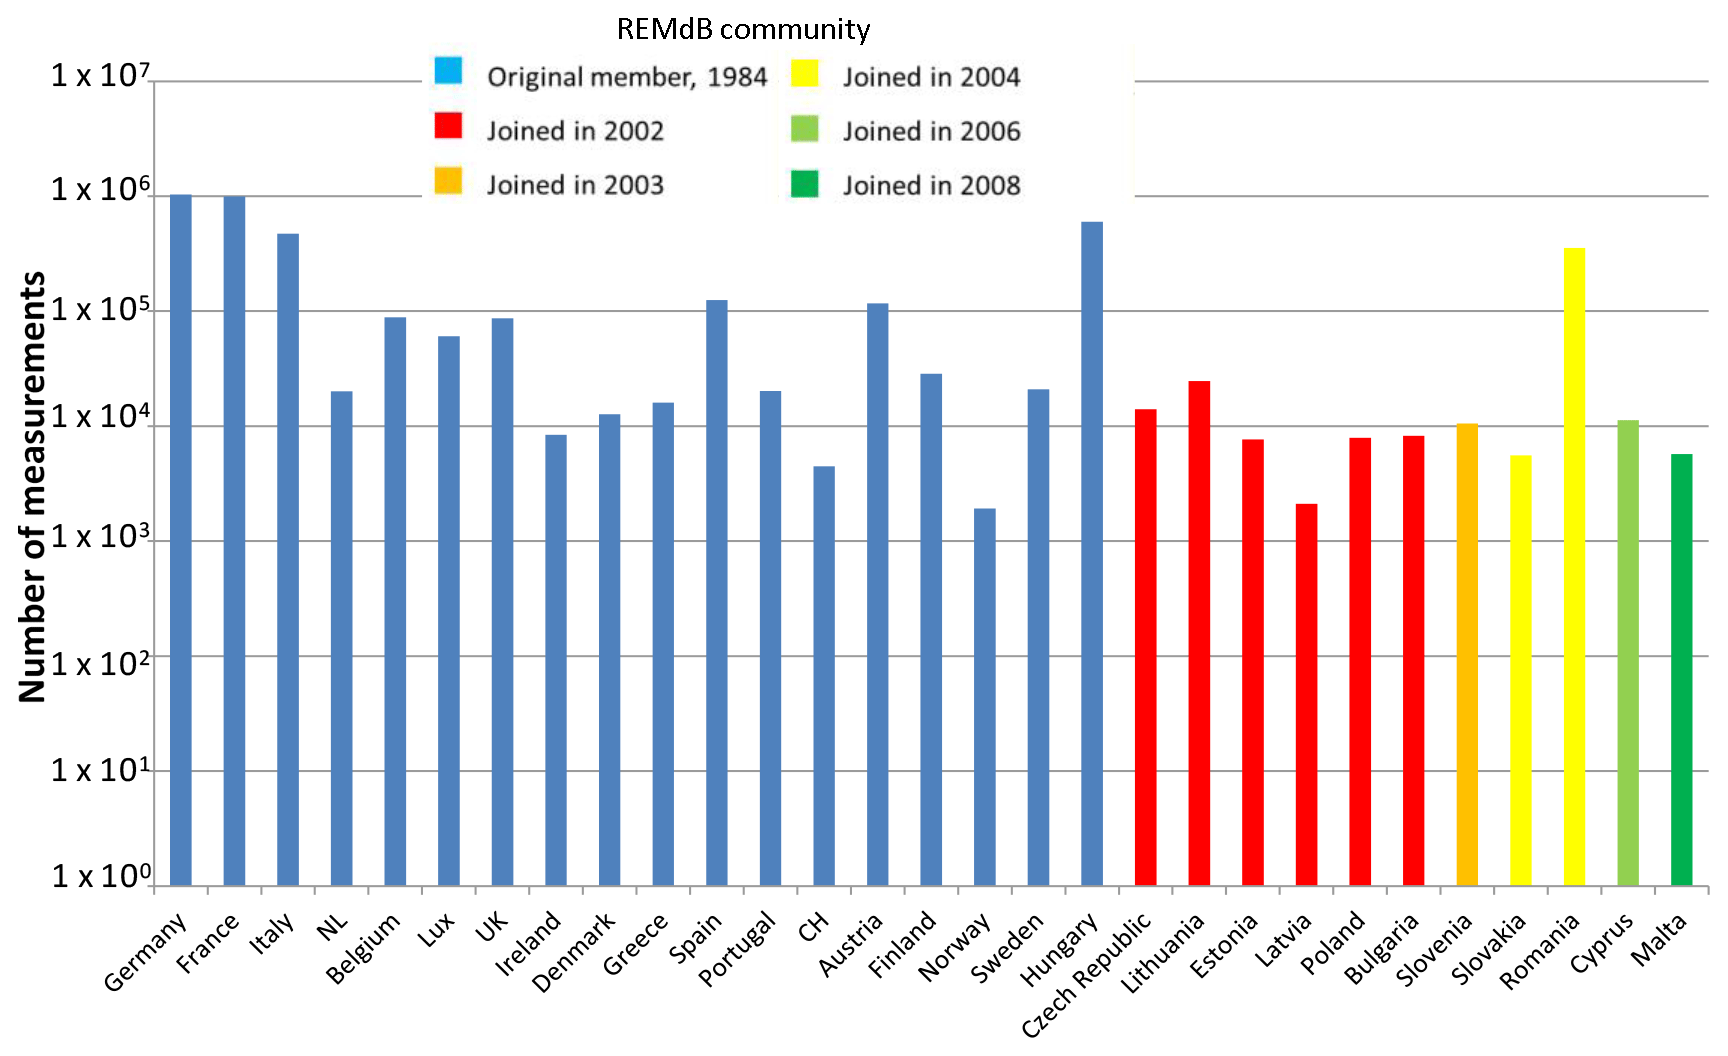
Figure 3Countries participating in REMdb according to their year of joining and number of measurements stored in REMdb from each country.
2.1 Quality control
Submitted data quality control is a duty of the laboratories which have to use defined procedures for tests and calibration including sampling technique. The laboratories have to participate in periodical inter-comparison tests for the specific matrix and measurement methods. Data providers and the MSs' competent authorities are responsible for their submitted data.
The value of a database system is dependent on the quality of primary data, the organization and reliability of the data entry and verification systems, and the accessibility of data. It has to be noted that continuous maintenance and frequent updates of the database are also important issues confronted on the practical end.
As part of JRC control procedures, all data entered into the database are internally reviewed, shown back to the MSs as they would appear in REMdb and checked once more. When the corresponding data provider approves them, they are stored and flagged as “verified”. By doing this, spurious or incomplete datasets are avoided before making them available to all users. Further controlled and documented releases of summarized data are timetabled such that values are not changing on a regular basis.
2.2 Measurements and monitoring networks
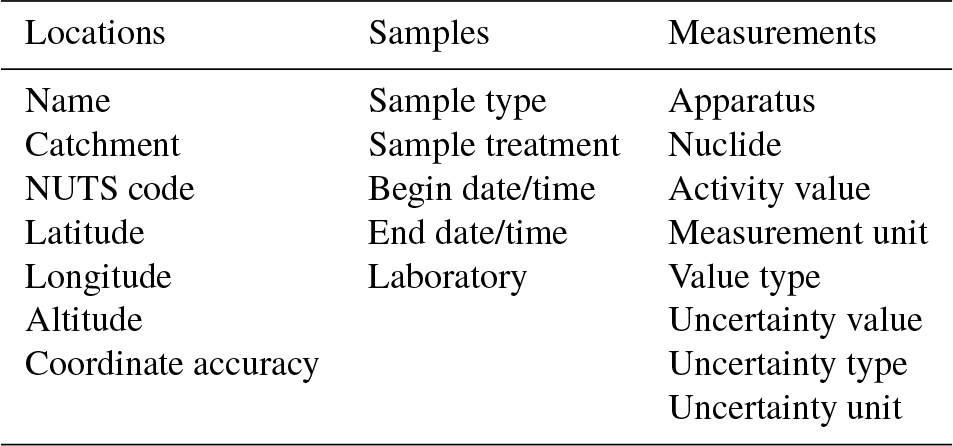
Measurements carried out by the MSs can be very different from each other, as they can be referred to different sample types (water, air, food, soil, etc.), different nuclides, different apparatus used for the measurement, different sampling period, etc. REMdb streamlines the various formats adopted in the EU for reporting routine environmental measurements. In order to bring some harmony and classify the information, some standard sample categories or types are defined and some minimum requirements of the information collected in REMdb are set. Table 1 indicates the information requested in order to be stored as a record in REMdb; not all fields are mandatory. There are three main blocks of information (locations, samples and measurements), which mainly refer to source of data and information necessary to describe the procedures for sample collection, treatment, analysis and measurement as performed by the original laboratories (Nweke et al., unpublished data, 2015).
Table 1Minimum requirements associated with data stored in REMdb.
It is worth pointing the field “less than” in the measurements record: this field is not mandatory and represents the best that can be done with the instruments, which vary from country to country. The value is used to indicate that the results of measurements are reported “less than a given value” or “below a threshold detection limit” (called lower limit of detection). This field is often left empty and no measurements are provided even if they were carried out because they were considered too low to be worth being reported.
A detailed classification of sample types or sample categories in REMdb can be found in De Cort et al. (2004). There are eight main categories in this classification: (1) environmental samples, (2) uncultivated products, (3) crops, vegetables, and fruit, (4) manufactured agricultural products, (5) animal products, (6) dairy products, (7) technical samples, and (8) mixed diet. Within this classification, it is necessary to highlight that sample types can also have subtypes, for example, water samples are subdivided into surface water samples and drinking water samples. Figure 4 shows the number of single measurements per sample type stored in REMdb. This figure shows how most sample types have more than a hundred records. One can observe that the largest category is airborne particulate with more than 106 measurements, while a considerable number of records are also available for the freshwater ecosystem (surface water and drinking water). Conversely, some sample types and/or subtypes were foreseen but not populated at all, such as amniotic fluid, which belongs to human biological samples.
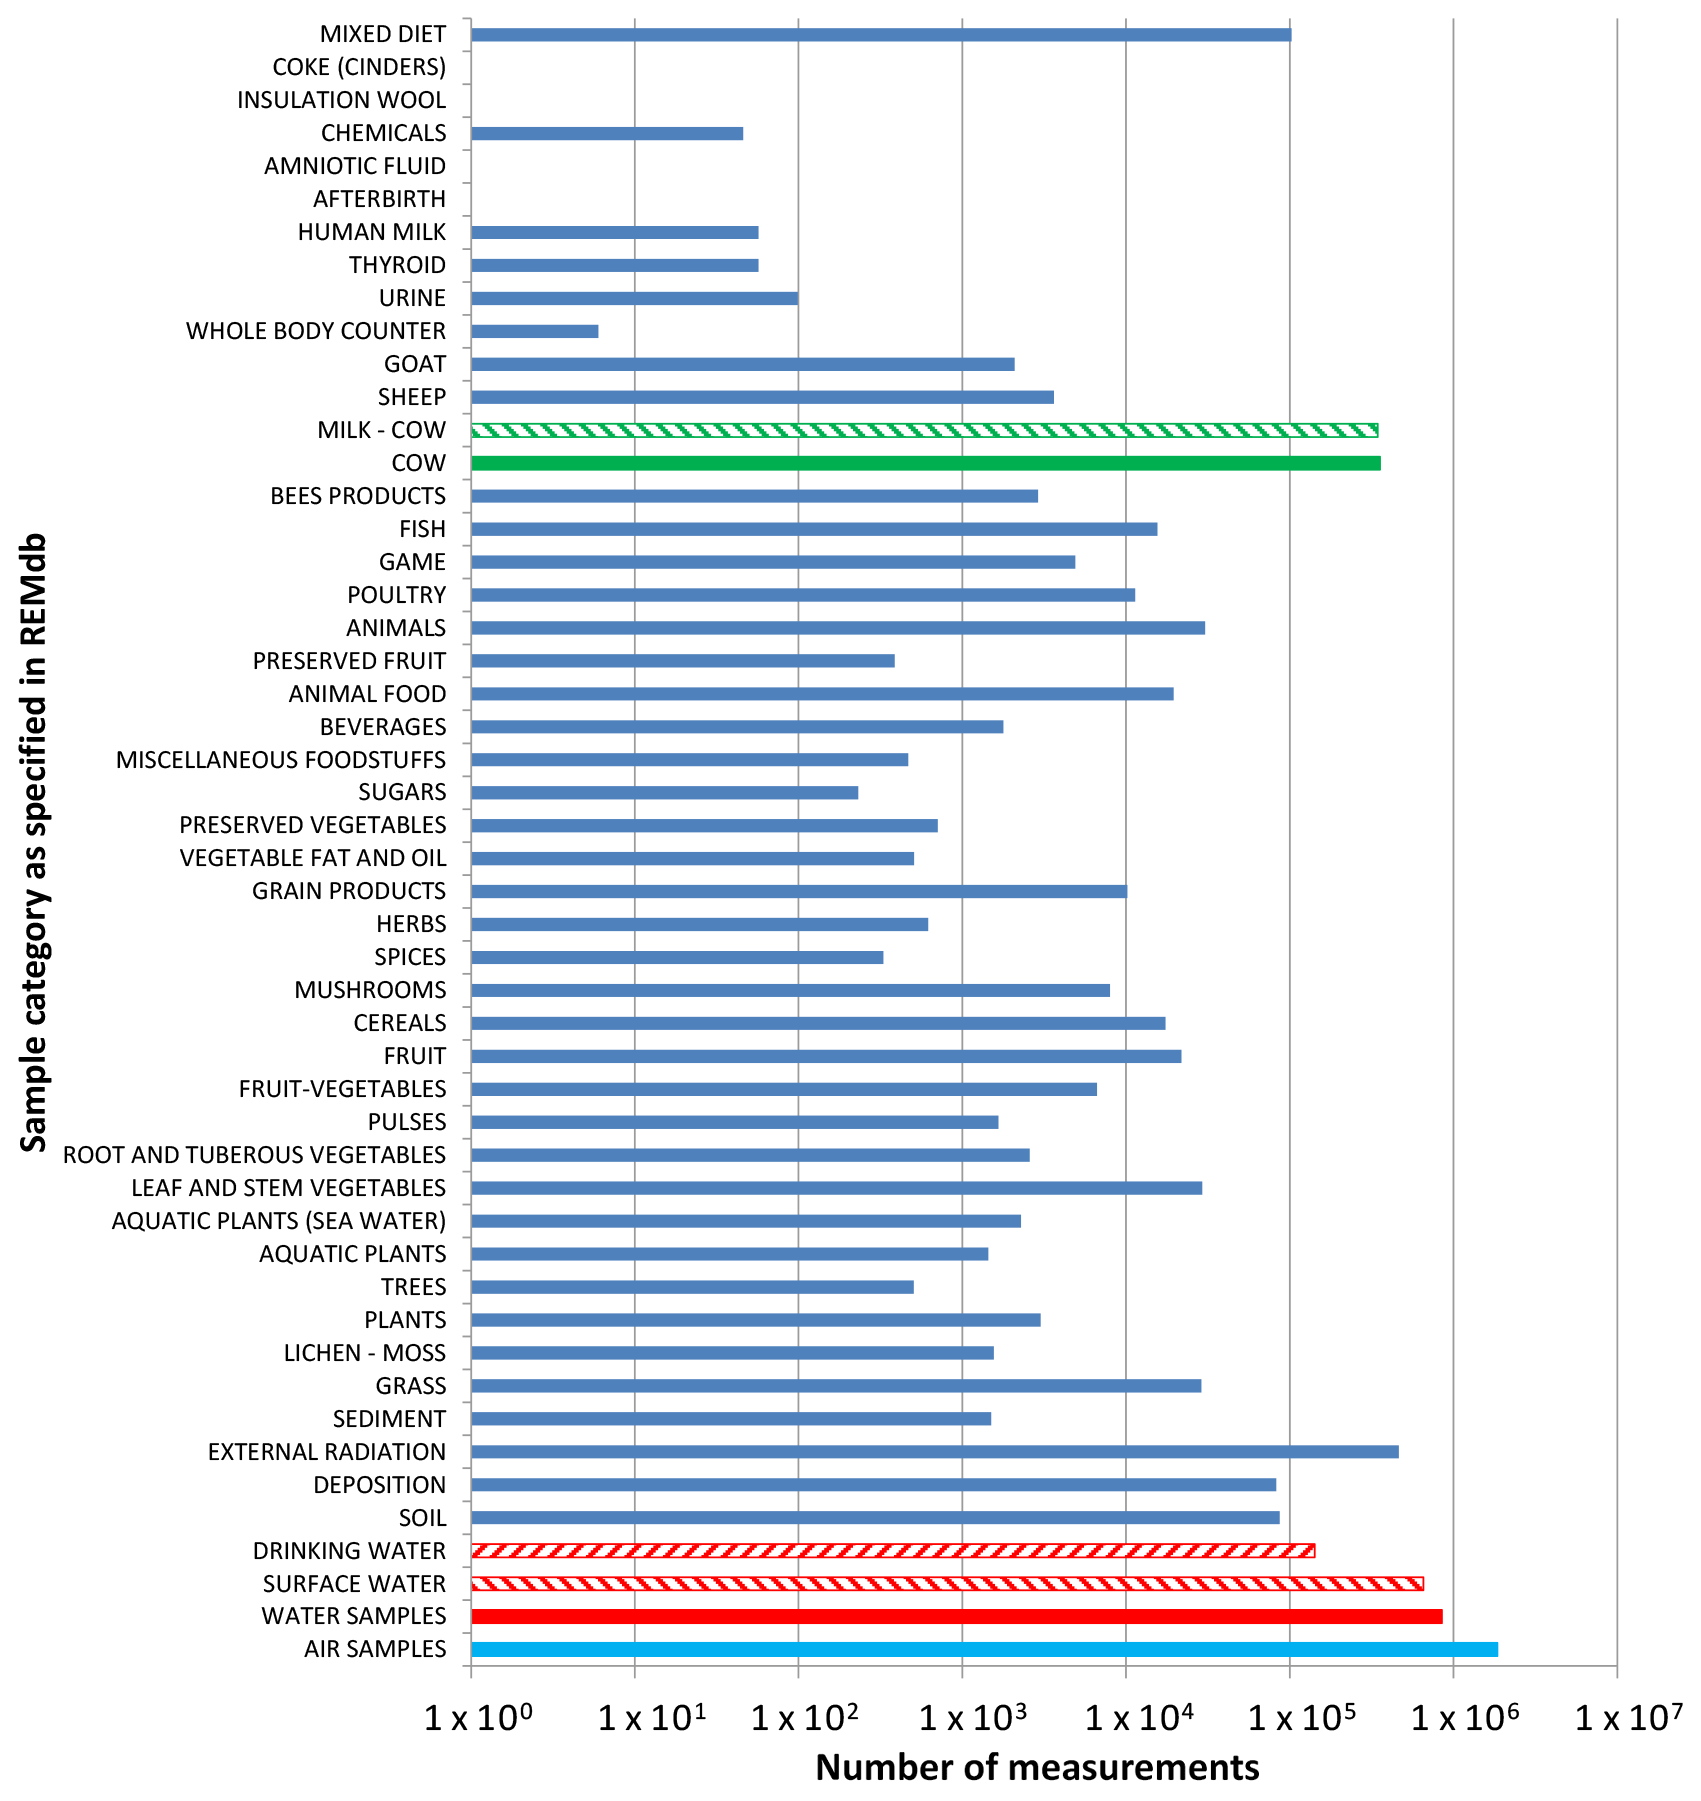
Figure 4Number of measurements per sample type as specified in REMdb (logarithmic scale, subtypes surface water and drinking water are included in type water samples, subtype milk-cow is included in type cow).
At present around 70 radionuclides are regularly reported and stored in REMdb. Figure 5 shows the number of measurements of the most sampled radionuclides stored in the database, which varies greatly from year to year, from country to country and also from nuclide to nuclide. In 1986, during the Chernobyl accident, there was a big and sudden increase in the number of different radionuclides reported and stored in REMdb (almost 100), while in 1994 there was a peak of 110; afterwards it stabilized around 70. In a similar way, some nuclides were of more concern soon after the accident and gradually lost importance due to their short life (e.g. 131I and 134Cs), while others gained more and more importance because of their applications in other fields, such as the 7Be, which is used as an atmospheric tracer (e.g. Lozano et al., 2012). Germany, France and Italy are the countries which report more radionuclides (about 100); UK and Hungary take into consideration about 60 while the remaining nations focus their attention on 20 radionuclides or even fewer, which is anyway much higher compared to what is recommended by the Commission Recommendation 2000/473/Euratom: gross alpha and beta, 137Cs, 3H, 90Sr, 40K, 14C, 7Be.
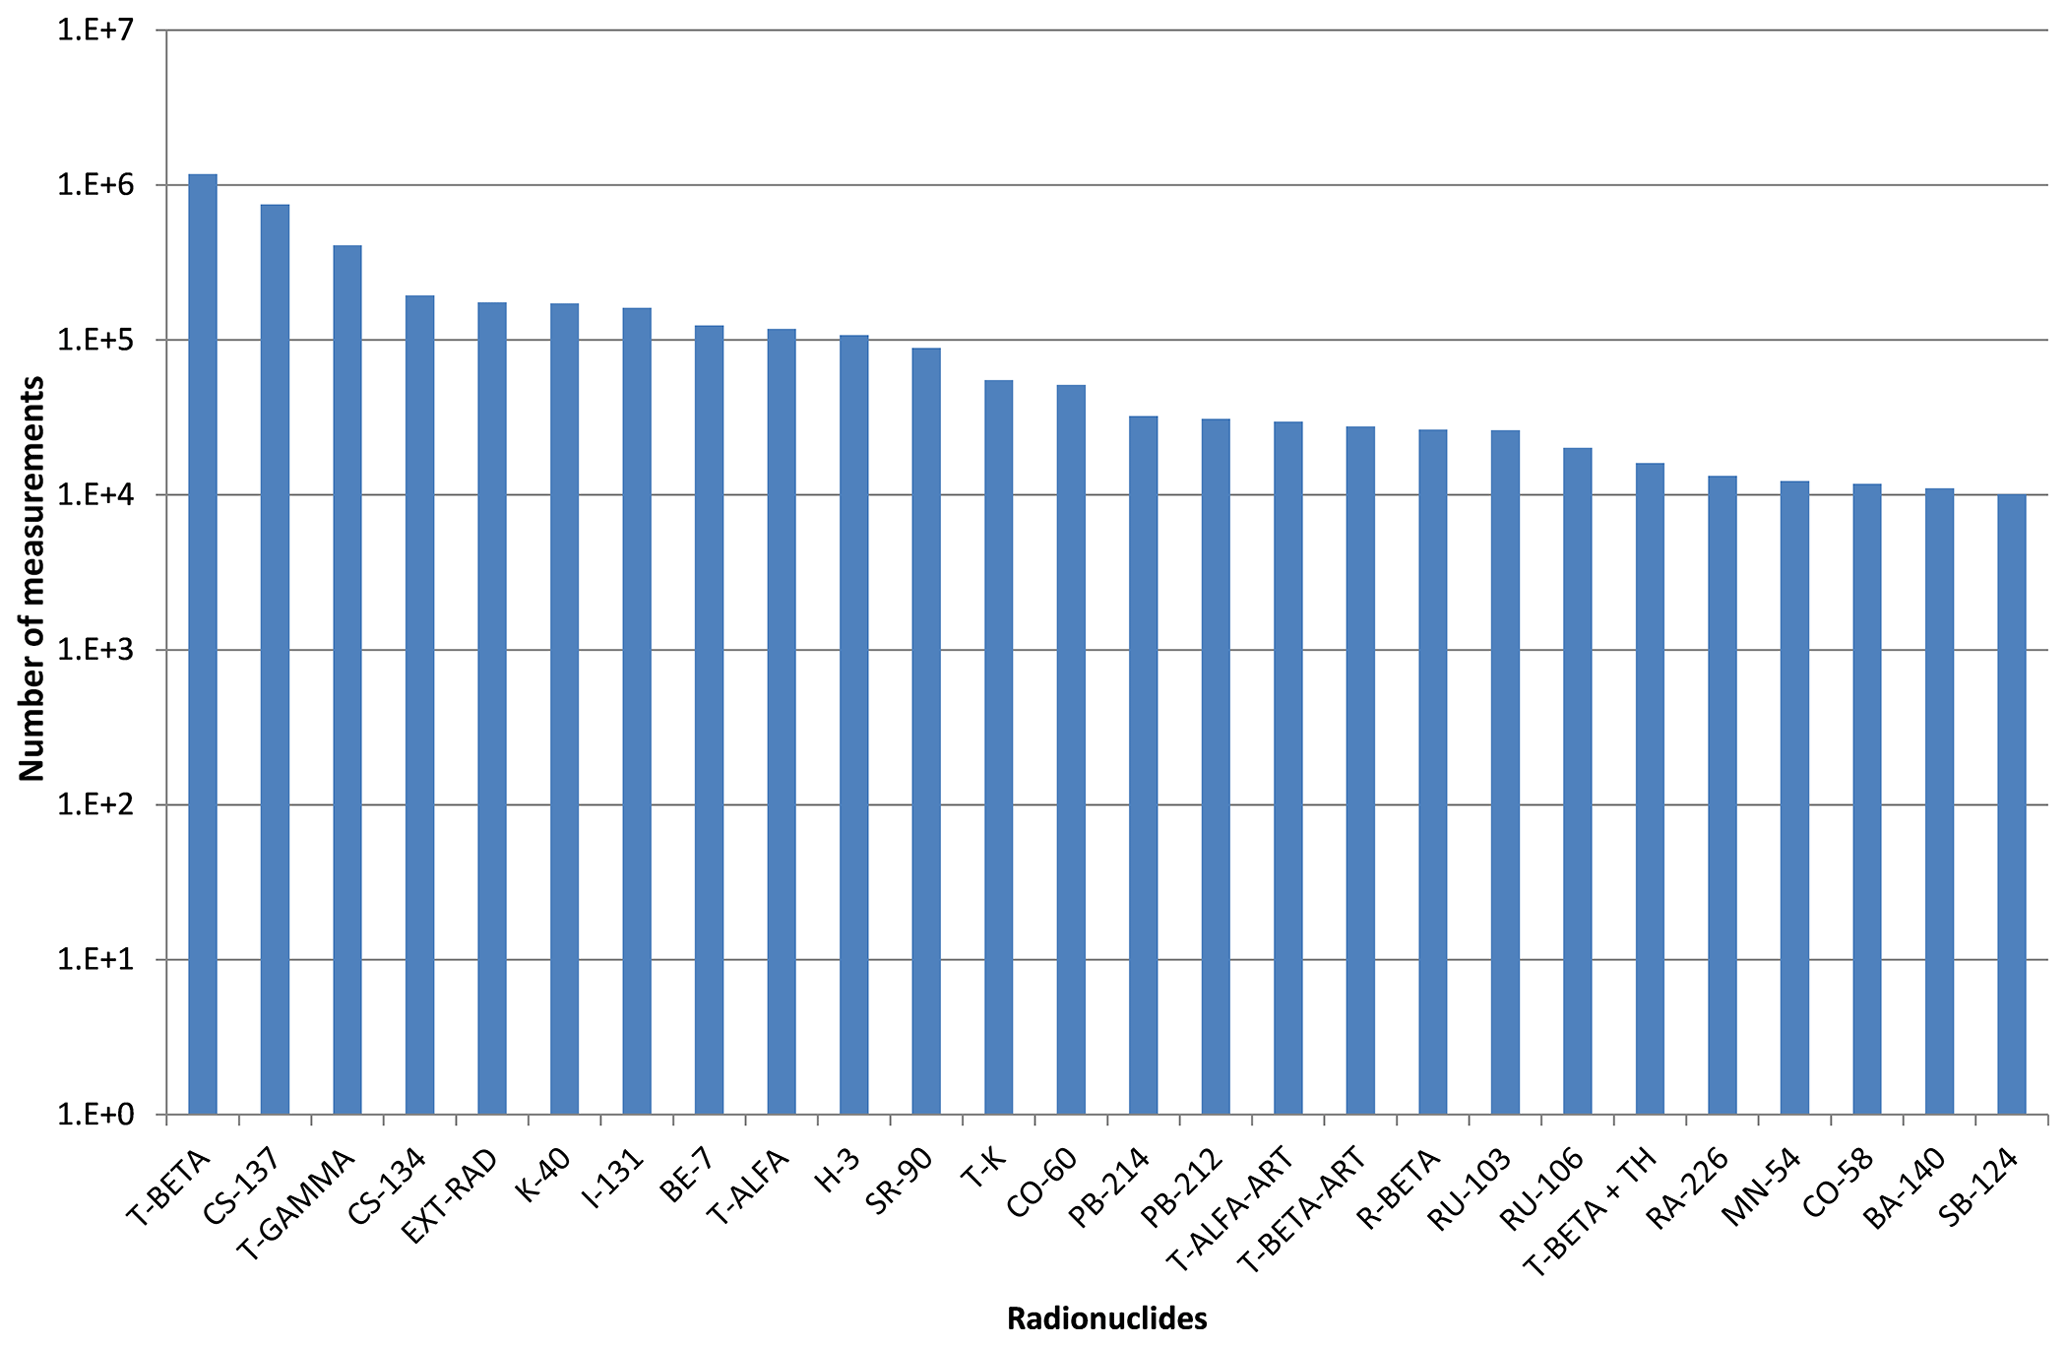
Figure 5Number of single measurements grouped by radionuclide stored in REMdb; the figure shows just those with a number of measurements above 1×10⁴.
Figure 6 shows how the main radionuclides stored in REMdb are also those with the largest country coverage. For example, more than 30 countries measure total beta, 137Cs and 7Be. Looking at this figure, 72 % of the total number of radionuclides are measured in more than 20 countries, and 22 % in more than 30 of them. This fact is associated with the number of monitoring stations deployed in each country reporting high-quality measurements to REMdb. In Europe, different approaches to the definition of the national environmental monitoring networks have been adopted, based on socio-economic considerations about where to install monitoring stations.

Figure 6Number of countries providing information on a certain radionuclide to REMdb; the figure shows just those radionuclides with at least 10 countries reporting them.
2.3 Dense and sparse network
Figure 7 shows an example of the sampling locations distributed all over member states' territories in 2006 corresponding to 137Cs in airborne particulates. Differences in the number of sampling locations between both plots are associated with the definition of dense and sparse monitoring networks (2000/473/Euratom, 2000). The sparse network is included in the dense network, being a subset of it. There is no distinction between the structures of data stored in REMdb as a dense or sparse network: both kinds of data comply with the same requirements. While dense network refers to a monitoring network that comprises sampling locations distributed throughout the member state's territory and used by the commission to compute regional averages for radioactivity levels in the community, sparse network groups those locations in which high-sensitivity measurements are performed. A sparse monitoring network therefore means a monitoring network which comprises at least one representative location of that geographical division for every geographical division and for every sampling medium.

Figure 7Example of sampling locations of dense (a) and sparse (b) networks for 137Cs as airborne particulates, year 2011.
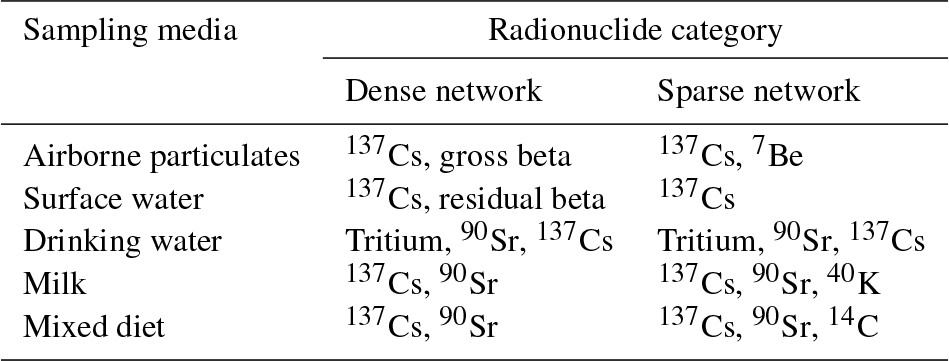
Activities such as the medical uses of radiation; the operation of nuclear installations; the production, transport, and use of radioactive material; and the management of radioactive waste must be subject to standards of safety (2013/59/Euratom, 2013). The commission recommendation of 8 June 2000 on the application of Article 36 of the Euratom Treaty (2000/473/Euratom, 2000) concerning the monitoring of the levels of radioactivity in the environment for assessing the exposure of the population as a whole suggests that some sample types and radionuclides are of more concern due to their higher contribution to the annual dose. Table 2 shows the sample types and radionuclide categories to be monitored and reported to the commission. These radionuclides are therefore measured and reported thoroughly by the MSs, as can be seen in Fig. 5.
Table 2Sample types and measurements as recommended in 2000/473/Euratom (2000).
All the measured radionuclides except 90Sr and 137Cs can be of either natural or artificial origin. The two exceptions are of artificial origin, mainly from past atmospheric weapons testing and from radioactive routine or accidental discharges from nuclear facilities.
Gross alpha and gross beta measurements are appropriate to characterize the total radioactivity of the sample. Gross beta is, by definition, the total measured beta activity in a sample; beta from tritium and in general very low energy beta emitters are normally not considered and short lived radon daughters are excluded through a sufficient delay time (e.g. 5 d) before counting. Gross beta activity results are always dependent on the instrument used and even if some instruments can measure low-energy beta particles, gross beta analysis does not detect weak beta emitters such as 3H, 14C, 35S and 129I. Residual beta is the measured gross beta activity minus 40K activity, the latter being the main natural source of activity in water.
Following the contamination of the environment with radionuclides, the population is exposed through both external and internal irradiation pathways. From a radioecological point of view, the behaviour of radionuclides in the environment and the interaction (uptake, excretion) with food organisms (plants, fungi, animals) is essential for the prediction of future internal exposure due to intake of contaminated foods (e.g. Merz et al., 2016).
3.1 Air measurements
Airborne particulate is measured due to its greater radiological significance. Airborne radioactive materials may occur in either gaseous or particulate form. In general, the latter is of greater potential radiological significance because it may be deposited and hence remain in the local environment. For instance, regarding emissions from Fukushima, 137Cs was attached in the size range of 0.1–2 µm in diameter (Kaneyasu et al., 2012). Consequently, most national routine monitoring networks measure only the particulate component.
Airborne particulate sampling is carried out by pumping air through filters. In most countries filters are changed daily and analysed for total beta activity following the decay of radon decay products. Individual radionuclide analyses are performed weekly, monthly or quarterly. Figure 8 shows the total number of measurements in the database by country for 137Cs and 7Be in the air. Artificial alpha-emitting aerosols are rarely measured by routine monitoring networks as they are usually undetectable, even close to the nuclear installations where they are produced. 137Cs and 7Be are normally measured with gamma spectrometry at the same time; therefore the number of reported measurements for both nuclides should be the same, but it does not happen because of lack of harmonization between countries.
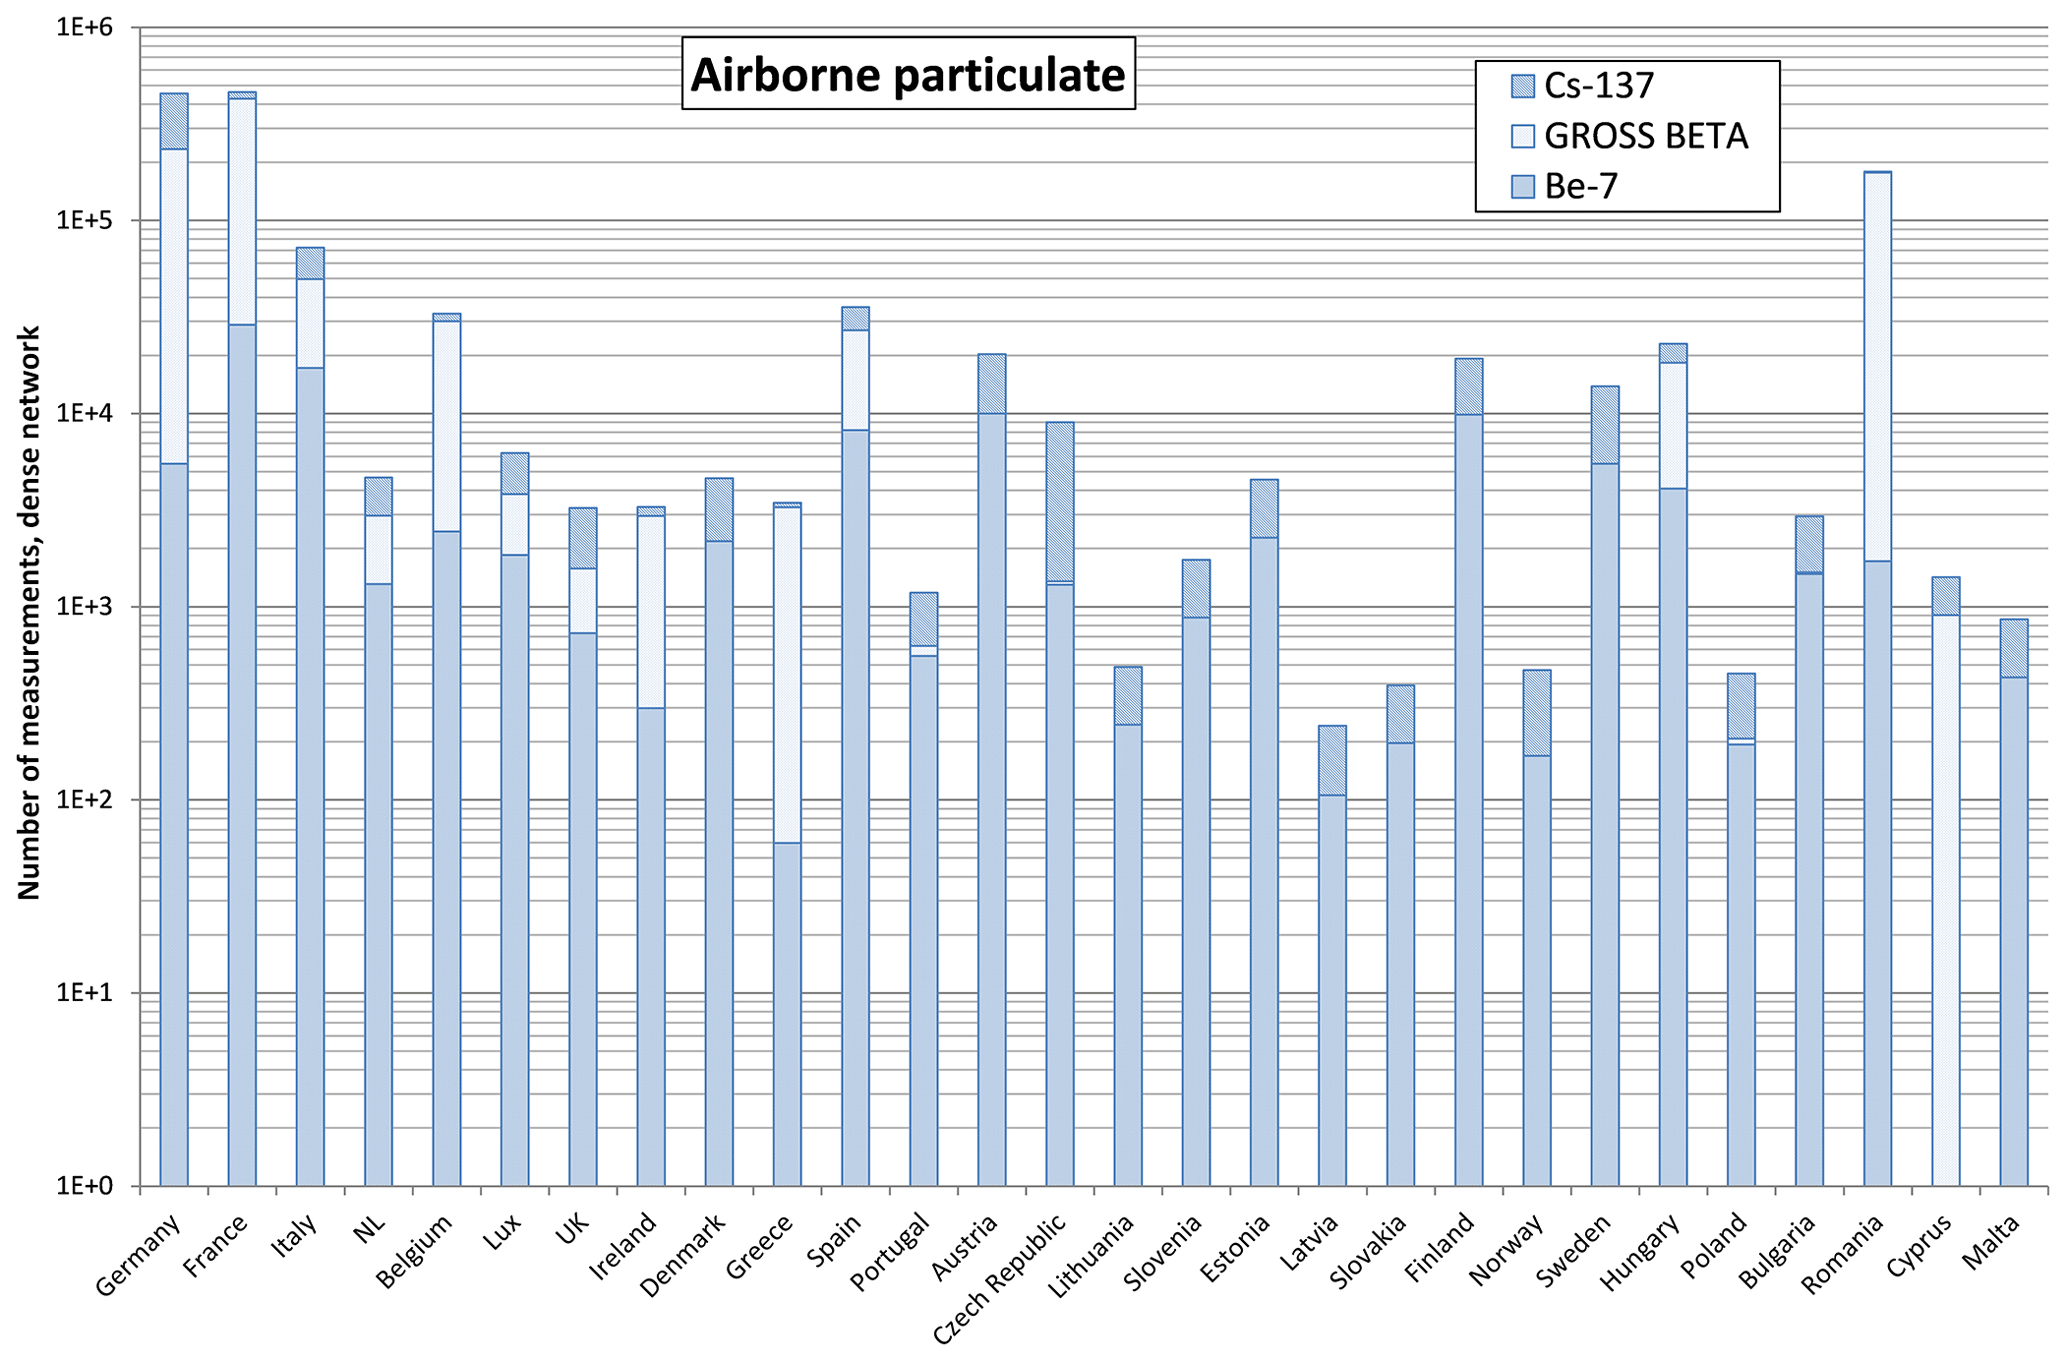
Figure 8Total number of measurements in REMdb (dense network) for sample type airborne particulates, 137Cs, total beta and 7Be, by country as recommended in 2000/273/Euratom.
137Cs is of major concern because it is the most abundant anthropogenic radionuclide and, because of its high volatility, the radiation type it emits and its biological activity (chemical analogue of potassium). Conversely, the cosmogenic radionuclide 7Be is important because it has the highest activity concentration in air (troposphere) among all cosmogenic radionuclides (Eisenbud and Gesell, 1997) and gives its contribution to the annual effective dose, which is about 30 nSv year−1 (Magnoni, 2018). As a consequence, 7Be is widely used as an aerosol tracer in order to study aerosol transport and removal in the troposphere by testing scavenging parametrizations (e.g. Alonso-Hernández et al., 2014).
3.2 Water measurements: surface and drinking
The presence of artificial radionuclides in aquatic environment results from global fallout from atmospheric nuclear weapons tests, fallout from the Chernobyl accident, discharges of radionuclides from nuclear installations, contributions from nuclear testing sites, past dumping of radioactive wastes, nuclear submarine accidents, loss of radioactive sources, applications of radionuclides in medicine and industry, and the burn-up of satellites using radionuclides as their power source (Livingston and Povinec, 2000). They pose a number of health hazards, especially when these radionuclides are deposited in the human body through drinking, and can eventually become incorporated into sediments and living species.
Due to human activities, the fraction of 3H and the presence of 137Cs have to be checked in this sampling media. Natural radionuclides in river water include 3H at levels of [0.02–0.1] Bq L−1, 40K [0.04–2 Bq L−1], radium, radon and their short-lived decay products [< 0.4–2 Bq L−1] (De Cort et al., 2004) while 137Cs is the most abundant anthropogenic radionuclide present in the marine environment (e.g. Aarkrog et al., 1997).
Surface water is one of the compartments into which authorized discharges of radioactive effluents from nuclear installations are made and hence (mostly rivers, but also sea water very close to the facilities) radionuclides in this sampling media can be found either in the water phase or associated with suspended particles and sediments. For instance, the Chernobyl accident in 1986 contributed significantly mainly to 134Cs and 137Cs inventories in seawater of the Baltic and North seas, resulting in the Baltic Sea being the most highly contaminated by 137Cs (e.g. Nies and Nielsen, 1996). Povinec et al. (2003) analyse the distribution of anthropogenic 137Cs in surface waters of the NE Atlantic Ocean for the year 2000, reporting mean values from 60±50 Bq m−3 for the Irish Sea to 2.1±1.2 Bq m−3 for the English Channel.
Either samples are taken continuously and bulked for monthly or quarterly analysis or alternatively spot samples are taken periodically several times a year and analysed individually or as a composite. Figure 9a shows the total number of 137Cs and total beta measurements regarding surface water media in REMdb.

Figure 9(a) Number of measurements in REMdb (dense network) for surface water, by country, as recommended in 2000/473/Euratom (2000). (b) Number of measurements in REMdb (dense network) for drinking water, by country, as recommended in 2000/473/Euratom (2000).
Drinking water, however, is monitored because of its vital importance for humans, even though a severe radioactive contamination of this medium is unlikely. Samples may be taken from ground or surface water supplies, from water distribution networks, mineral waters, etc. Spot samples are taken a few times a year and analysed individually, or samples are taken daily and bulked for monthly or quarterly analysis. The number of measurements included in REMdb for this sampling media is shown in Fig. 9b. Same as for surface water, the most important natural radionuclides in drinking water are 3H, 40K, radium, radon and their short-lived decay products, but they vary greatly. While eventual presence of 3H may or may not be due to human activities, 90Sr and 137Cs can only be a consequence of anthropogenic activities.
3.3 Milk measurements
For many contamination scenarios, especially for accidentally released radionuclides, consumption of milk and dairy products has been shown to be one of the most important pathways of radiation for the public (UNSCEAR, 2008). As an example of its importance, monitoring of 137Cs and 90Sr in consumption milk has been ongoing since 1955 and 1960 in Sweden (http://projects.amap.no/project/monitoring-of-cs-137-and-sr-90-in-consumption-milk/, last access: 21 December 2018) and Finland (http://www.radioecology-exchange.org/content/monitoring-sr-90-and-cs-137-milk-finland, last access: 21 December 2018).
Figure 10 shows the total number of measurements of 137Cs, 40K and 90Sr in cow's milk per European country. Samples are mostly taken at dairies covering large geographical areas in order to obtain representative samples. They are generally taken on a monthly basis, but sometimes only during the pasture season. Generally, the concentrations of the stable elements calcium (Ca) and potassium (K) are determined because of the similarity of their metabolic behaviour with strontium (Sr) and caesium (Cs) respectively.
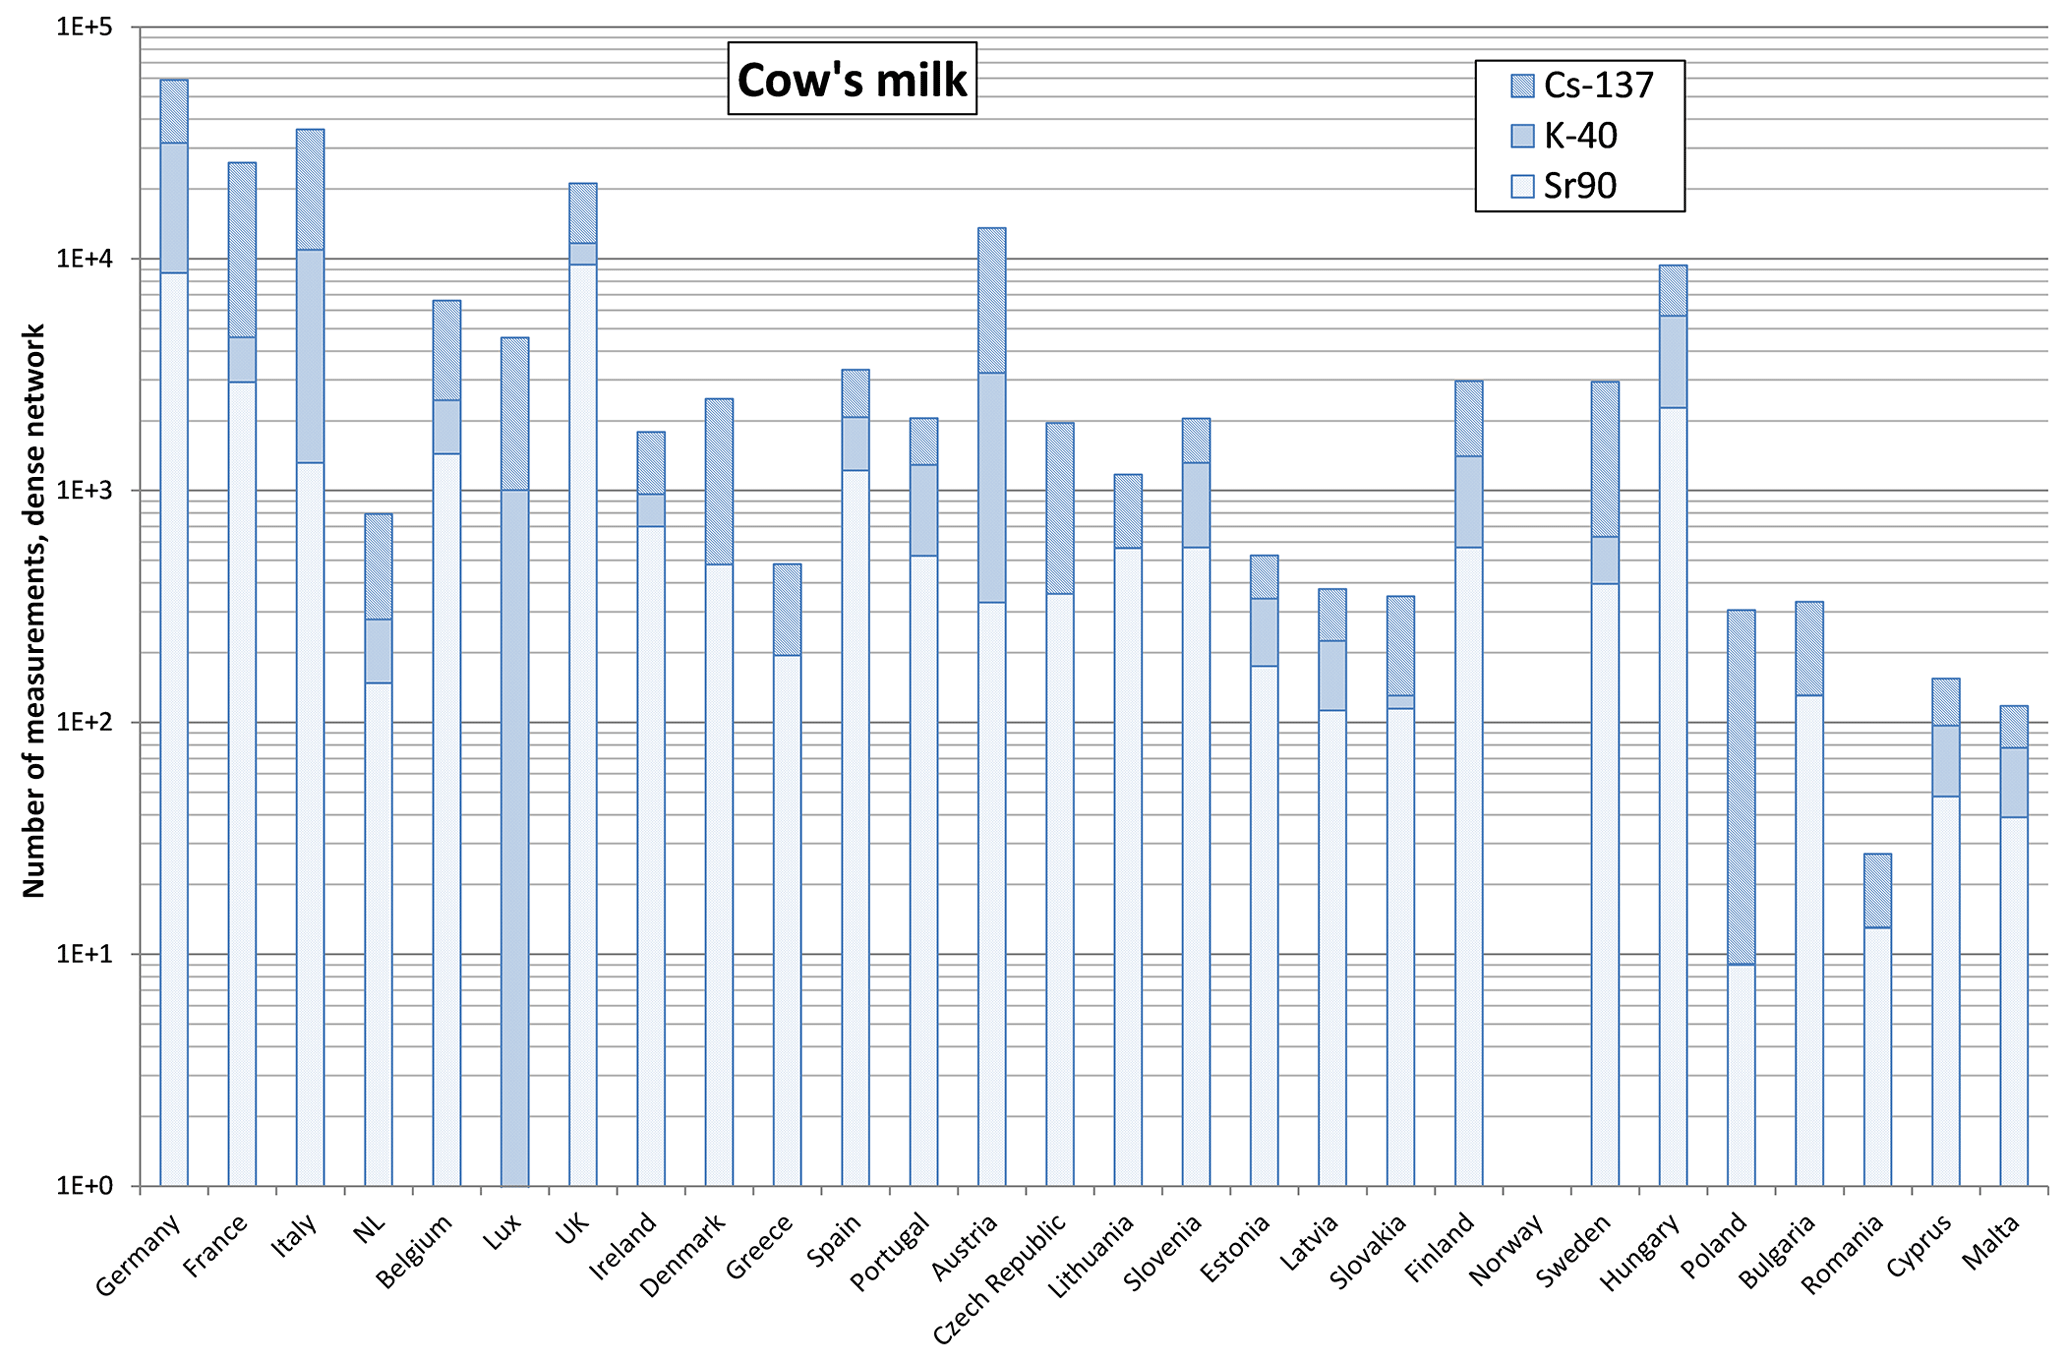
Figure 10Number of measurements in REMdb (dense network) for sample type cow's milk, 137Cs, 40K and 90Sr, by country, as recommended in 2000/473/Euratom (2000).
3.4 Mixed diet measurements
The aim of measuring radioactivity in mixed diet is to obtain “integral” information on the uptake of radionuclides by humans via the food chain. Samples are taken as ingredients or as complete meals, mostly at places where many meals are consumed (i.e. factory restaurants, schools). The trend is to sample complete meals according to food consumption statistics to give a representative figure for the contamination of mixed diet; it's also very common to analyse single foodstuffs and combine them according to local diet style. Knowledge of the contamination of the individual ingredients together with the composition of the national diet can also lead to a representative figure.
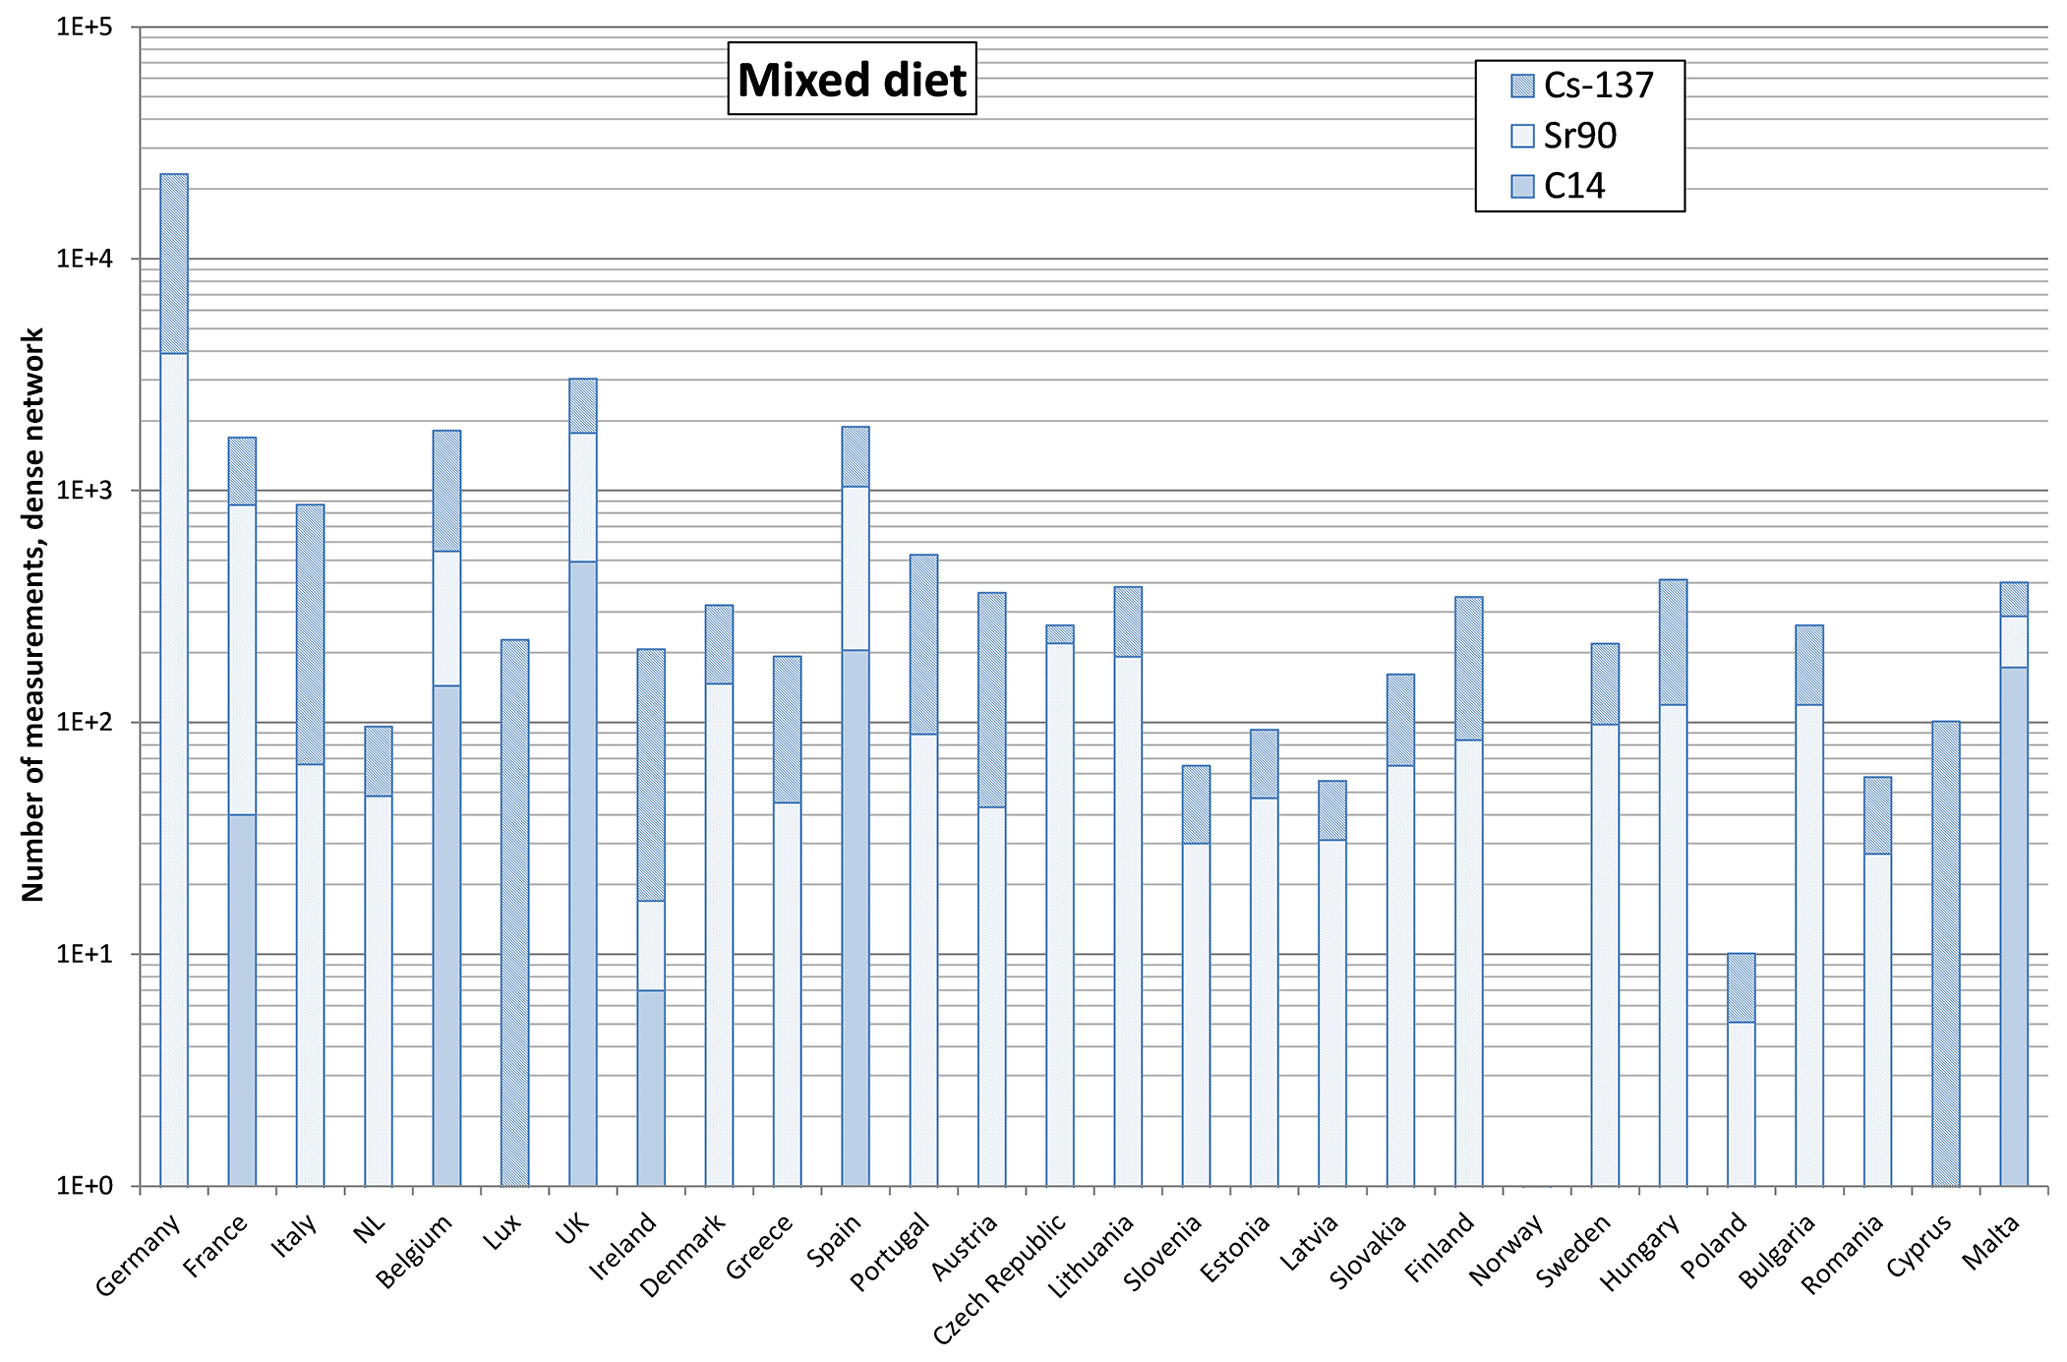
Figure 11Number of measurements in REMdb for sample type mixed diet, 137Cs, 90Sr and 14C, by country, as recommended in 2000/473/Euratom (2000).
Rather than expressing the radioactivity content of foodstuffs per unit weight, it is more appropriate to estimate the activity consumed per day per person (Bq d−1 per person). Generally, the concentrations of the stable isotopes of calcium and potassium are determined because of the similarity of their metabolic behaviour to strontium and caesium respectively. Typical values in mixed diet are 0.7 to 1.5 g d−1 per person for calcium and 3 to 4 g d−1 per person for potassium. Figure 11 shows the total number of measurements for sample type mixed diet, 137Cs, 90Sr and 14C by country, as recommended in Table 2.
Environmental radiation monitoring datasets are freely available at JRC Data Catalogue http://data.jrc.ec.europa.eu/collection/id-0117 (last access: 21 December 2018).
Before a dataset may be published, the corresponding monitoring report must be issued first. At the time this paper is being prepared, monitoring reports up to the year 2011 were published; therefore it is possible to release datasets up to 2011. People are invited to check our data catalogue for updates.
Datasets can be downloaded singularly as Excel files and zipped due to their dimension year by year from 1984 to 2006 by following subsequent PIDs or as a whole:
REM data bank – years 1984–2006 at https://doi.org/10.2905/jrc-10117-10024 (De Cort et al., 2007);
REM data bank – years 2007–2011 at https://doi.org/10.2905/de42f259-fafe-4329-9798-9d8fabb98de5 (De Cort et al., 2012).
The fields made available for download are (in brackets is the field abbreviation): locality name (LOC_NAME), country name (COUNTRY_NAME), locality latitude (LOC_ LATITUDE), locality longitude (LOC_LONGITUDE), sample type description (STY_DESCRIPTION), sample treatment description (STR_DESCRIPTION), sample begin date time (SAM_ BEGINDATETIME), sample end date time (SAM_ENDDATETIME), laboratory name (LAB_NAME), apparatus description (APT_DESCRIPTION), nuclide (NUC_CODE), measured standard activity value (MEA_STANDARDACTIVITYVALUE), measured standard unit (MEU_STANDARDUNIT), value type description (VAT_DESCRIPTION). Dataset size can be up to 35 MB and contain up to 200 lines, each line representing a single record or measurement.
Users can also access REMdb online and retrieve the data through personal queries. Monitoring reports from year 1996 to 2011 are also available for download at the corresponding dataset.
For full database access or questions, please write an e-mail to JRC-REMDBSUPPORT@ec.europa.eu.
This paper provides a synthesis of the online Radioactivity Environmental Monitoring data bank (REMdb). The database presented here contains more than 5 million records from 1984 onward concerning radioactivity levels in Europe of air, deposition, water, milk, meat, crops and vegetables; REMdb brings endless research opportunities to the scientific community. The database is accessible via a web browser and is open to the scientific community. During its more than 30 years of operation, REMdb has grown more and more in number of measurements thanks also to more countries joining the project. Nevertheless, experience has shown that its structure could be optimized in order to accommodate users' needs and compare measurements carried out by different laboratories. Future work focuses on maintaining the update frequency, enhancing the user's accessibility to original data and developing a user-friendly interface.
MdC was in charge of REMdb creation and is the main reference for information since he is the person responsible for the project. MS is the main author. MAHC was the main reviewer and gave technical guidance. GC and GI gave very valuable contributions with their comments.
The authors declare that they have no conflict of interest.
By accessing the REM database and its content, the user agrees that the law of the European Union, without regard to principles of conflict of laws, will govern these terms and conditions and any dispute of any sort that might arise between the user and the European Commission. The European Union reserves the right to modify or discontinue temporarily or permanently the REM database (or any part thereof) without prior notice to users.
The authors would like to thank all the EU member states for having sent the data and David Carlson for his very helpful and kind support.
This paper was edited by Giulio G. R. Iovine and reviewed by Arunkumar Anbu Aravazhi and five anonymous referees.
87/600/Euratom: Council Decision of 14 December 1987, on Community Arrangements for the Early Notification of Information in the Event of a Radiological Emergency, Official Journal of the European Communities, OJ L 371 ELI, available at: http://data.europa.eu/eli/dec/1987/600/oj (last access: 21 December 2018), 1987.
2000/473/Euratom: Commission Recommendation of 8 June 2000 on the application of Article 36 of the Euratom Treaty concerning the monitoring of the levels of radioactivity in the environment for the purpose of assessing the exposure of the population as a whole (notified under document number C(2000) 1299) ELI, available at: http://data.europa.eu/eli/reco/2000/473/oj (last access: 21 December 2018), 2000.
2013/59/Euratom: Council Directive of 5 December 2013 laying down Basic Safety Standards for protection against the dangers arising from exposure to ionising radiation, and repealing Directives 89/618/Euratom, 90/641/Euratom, 96/29/Euratom, 97/43/Euratom and 2003/122/Euratom, ELI, available at: http://data.europa.eu/eli/dir/2013/59/oj (last access: 21 December 2018), 2013.
Aarkrog, A., Baxter, M. S., Bettencourt, A. O., Bojanowski, R., Bologa, A., Charmasson, S., Cunha, I., Delfanti, R., Duran, E., Holm, E., Jeffree, R., Livingston, H. D., Mahapanyawong, S., Nies, H., Osvath, I., Pingyu, L., Povinec, P. P., Sanchez, A., Smith, J. N., and Swift, D.: A Comparison of Doses from 137Cs and 210Po in Marine Food: A Major International Study, J. Environ. Radioactiv., 34, 69–90, https://doi.org/10.1016/0265-931X(96)00005-7, 1997.
Alkhorayef, M., Hamza, Y., Sulieman, A., Salih, I., Babikir, E., and Bradley, D. A.: Effective dose and radiation risk estimation in certain paediatric renal imaging procedures, Radiat. Phys. Chem., 154, 64–68, https://doi.org/10.1016/j.radphyschem.2018.06.016, 2018.
Alonso-Hernández, C. M., Morera-Gómez, Y., Cartas-Águila, H., and Guillén-Arruebarrena, A.: Atmospheric deposition patterns of 210Pb and 7Be in Cienfuegos, Cuba, J. Environ. Radioactiv., 138, 149–155, https://doi.org/10.1016/j.jenvrad.2014.08.023, 2014.
Carvalho, F. P., Oliveira, J. M., and Malta, M.: Radioactivity in Iberian Rivers with Uranium Mining Activities in their Catchment Areas, Proced. Earth Plan. Sc., 8, 48–52, https://doi.org/10.1016/j.proeps.2014.05.011, 2014.
Cinelli, G., Gruber, V., De Felice, L., Bossew, P., Hernandez-Ceballos, M. A., Tollefsen, T., Mundigl, S., and De Cort, M.: European annual cosmic-ray dose: estimation of population exposure, J. Maps, 13, 812–821, https://doi.org/10.1080/17445647.2017.1384934, 2017.
De Cort, M., Dubois, G., Fridman, S. D., Germenchuk, M. G., Izrael, Y. A., Janssens, A., Jones, A. R., Kelly, G. N., Kvasnikova, E. V., Matveenko, I. I., Nazarov, I. M., Pokumeiko, Y. M., Sitak, V. A., Stukin, E. D., Tabachny, L. Y., Tsaturov, Y. S., and Avdyushin, S. I.: Atlas of Caesium Deposition on Europe after the Chernobyl Accident. Office for Official Publications of the European Communities, Luxembourg, ISBN 92-828-3140-X, Catalogue number CG-NA-16-733-29-C, EUR 16733, 1998.
De Cort, M., Tollefsen, T., Marsano, A., and Gitzinger, C.: Environmental Radioactivity in the European Community 2004–2006, s.l.:s.n., 2004.
De Cort, M., Sangiorgi, M., Hernandez Ceballos, M. A., Vanzo, S., Nweke, E., Tognoli, P. V., and Tollefsen, T.: REM data bank – Years 1984–2006, European Commission, Joint Research Centre (JRC) [Dataset], PID, https://doi.org/10.2905/jrc-10117-10024, 2007.
De Cort, M., Sangiorgi, M., Hernandez Ceballos, M. A., Vanzo, S., Nweke, E., Tognoli, P. V., and Tollefsen, T.: REM data bank – Years 2006–2011, European Commission, Joint Research Centre (JRC) [Dataset], PID, https://doi.org/10.2905/de42f259-fafe-4329-9798-9d8fabb98de5, 2012.
Eisenbud, M. and Gesell, T.: Environmental Radioactivity from Natural, Industrial and Military Sources, Academic Press, Paperback ISBN 9781493300419, 656 pp., 1997.
Gabrieli, J., Cozzi, G., Vallelonga, P., Schwikowski. M., Sigl, M., Eickenberg, J., Wacker, L., Boutron, C., Gäggeler, H., Cescon, P., and Barbante, C.: Contamination of Alpine snow and ice at Colle Gnifetti, Swiss/Italian Alps, from nuclear weapons tests, Atmos. Environ., 45, 587–593, https://doi.org/10.1016/j.atmosenv.2010.10.039, 2011.
IAEA: Radiation Protection and Safety of Radiation Sources: International Basic Safety Standards, STI/PUB/1578, ISBN 978-92-0-135310-8, 2014.
ICRP (International Commission on Radiological Protection): 1990 Recommendations of the International Commission on Radiological Protection, Annals of the ICRP, vol 21, nos. 1–3, Pergamon Press, Oxford (ICRP publication 60), 1990.
Imanaka, T., Hayashi, G., Endo, S.: Comparison of the accident process, radioactivity release and ground contamination between Chernobyl and Fukushima-1, J. Radiat. Res., 56, i56–i61, https://doi.org/10.1093/jrr/rrv074, 2015.
InVS and AFSSET (Institut de Veille Sanitaire, Agence Francaise de Securite Sanitaire de L'environnement et du Travail): Estimating the health impact of environmental pollution and quantitative assessment of health risks, available at: http://www.side.developpement-durable. gouv.fr/EXPLOITATION/DEFAULT/doc/IFD (last access: 21 December 2018), 2007.
Kaneyasu, N., Ohashi, H., Suzuki, F., Okuda, T., and Ikemori, F.: Sulphate aerosol as a potential transport medium of radiocesium from the Fukushima nuclear accident, Environ. Sci. Technol., 46, 5720–5726, https://doi.org/10.1021/es204667h, 2012.
Livingston, H. D. and Povinec, P. P.: Anthropogenic marine radioactivity, Ocean Coast. Manage., 43, 689–712, https://doi.org/10.1016/S0964-5691(00)00054-5, 2000.
Lozano, R. L.,Hernández-Ceballos, M. A., San Miguel, E. G., Adame, J. A., Bolívar, J. P.: Meteorological factors influencing the 7Be and 210Pb concentrations in surface air from the southwestern Iberian Peninsula, Atmos. Environ., 63, 168–178, https://doi.org/10.1016/j.atmosenv.2012.09.052, 2012.
Magnoni, M.: Environmental Radioactivity and Radioecology, in: Physical Agents in the environment and workplace-Noise and vibrations, electromagnetic fields and Ionizing Radiations, edited by: Licitra, G., d'Amore, G., and Magnoni, M., Taylor and Francis Group, LLC, 2018.
Merz, S., Shozugawa, K., and Steinhauser, G.: Effective and ecological half-lives of 90Sr and 137Cs observed in wheat and rice in Japan,J. Radioan. Nucl. Ch., 307, 1807–1810, https://doi.org/10.1007/s10967-015-4352-6, 2016,
Nies, H. and Nielsen, S. P.: Radioactivity in the Baltic Sea, Conference of International Symposium on Radionuclides in the Oceans, France, 1996.
Ogundarea, F. O. and Adekoya, O. I.: Gross alpha and beta radioactivity in surface soil and drinkable water around a steel processing facility, Journal of Radiation Research and Applied Sciences, 8, 411–417, https://doi.org/10.1016/j.jrras.2015.02.009, 2015.
Povinec, P. P., Bailly du Bois, P., Kershaw, P. J., Nies, H., and Scotto, P.: Temporal and spatial trends in the distribution of 137Cs in surface waters of Northern European Seas – a record of 40 years of investigations, Deep-Sea Res.-Pt. II, 50, 2785–2801, https://doi.org/10.1016/S0967-0645(03)00148-6, 2003.
UNSCEAR (United Nations Scientific Committee on the Effects of Atomic Radiation): Sources and Effects of Ionizing Radiation, Report to the General Assembly Annex B: Exposures of the Public and Workers from Various Sources of Radiation, United Nations, New York, 2008.
WHO/FAO (World Health Organization & Food and Agriculture Organization of the United Nations): Food safety risk analysis: a guide for national food safety authorities, Geneva, World Health Organization, available at: http://www.who.int/iris/handle/10665/43718 (last access: 21 December 2018), 2006.