the Creative Commons Attribution 4.0 License.
the Creative Commons Attribution 4.0 License.
 | 01 Jul 2019
A unified data set of airborne cloud remote sensing using the HALO Microwave Package (HAMP)
Marek Jacob
Felix Ament
Susanne Crewell
Florian Ewald
Martin Hagen
Lutz Hirsch
Friedhelm Jansen
Mario Mech
Bjorn Stevens
Cloud properties and their environmental conditions were observed during four aircraft campaigns over the North Atlantic on 37 flights. The Halo Microwave Package (HAMP) was deployed on the German research aircraft HALO (High Altitude Long Range Research Aircraft) during these four campaigns. HAMP comprises microwave radiometers with 26 channels in the frequency range between 20 and 183 GHz and a 35 GHz cloud radar. The four campaigns took place between December 2013 and October 2016 out of Barbados and Iceland. Measured situations cover a wide range of conditions including the dry and wet season over the tropical Atlantic and the cold and warm sectors of midlatitude cyclones. The data set we present here contains measurements of the radar reflectivity factor and linear depolarization ratio from cloud radar, brightness temperatures from microwave radiometers and atmospheric profiles from dropsondes. It represents a unique combination of active and passive microwave remote sensing measurements and 525 in situ-measured dropsonde profiles. The data from these different instruments are quality controlled and unified into one common format for easy combination of data and joint analysis. The data are available from the CERA database for the four campaigns individually (https://doi.org/10.1594/WDCC/HALO_measurements_1, https://doi.org/10.1594/WDCC/HALO_measurements_2, https://doi.org/10.1594/WDCC/HALO_measurements_3, https://doi.org/10.1594/WDCC/HALO_measurements_4). This data set allows for analyses to gain insight into cloud properties and the atmospheric state in remote regions over the tropical and midlatitude Atlantic. In this paper, we describe the four campaigns, the data and the quality control applied to the data.


Clouds in the planetary boundary layer over oceans have been identified as one of the largest contributors to intermodel spread in climate sensitivity (Sherwood et al., 2014), and more detailed observations are needed for model improvement (Bony et al., 2015). Modern satellites provide detailed insights into cloud structures and their microphysical characteristics with almost full coverage of the Earth. In contrast to solar and infrared remote sensing, which are mainly limited to thin clouds and cloud top regions, microwave frequencies are especially suited for cloud and precipitation remote sensing, depending on the individual frequencies. However, most microwave satellite products are limited in resolution, coverage and sensitivity. Passive microwave satellite instruments have footprints of several tens of kilometers (Elsaesser et al., 2017), while active microwave instruments are confined to narrow scan regions, limited vertical resolution and sensitivity. For example the Global Precipitation Mission (GPM) 35 GHz radar has a minimum detectable signal of 12 dBZ (Skofronick-Jackson et al., 2013), which is more suited for the detection of heavier precipitation and less so for characterizing shallow convection. Therefore, the synergy of airborne active and passive microwave remote sensing has mostly been used for liquid and solid precipitation in the preparation and validation phase of the Global Precipitation Mission (e.g., Houze et al., 2017; Skofronick-Jackson et al., 2013). A better sensitivity with respect to nonprecipitating clouds is achieved by the CloudSat radar, which has a minimum detectable signal of about −27 dBZ (Stephens et al., 2002). However, the vertical pulse resolution of about 500 m becomes problematic for boundary layer clouds.
Ground-based remote sensing stations can provide measurements with high temporal and vertical resolution but are limited to few locations that are almost exclusively on land. Airborne remote sensing bridges this gap between coarse satellite observations and stationary ground-based measurements. The HALO aircraft (High Altitude Long Range Research Aircraft, Krautstrunk and Giez, 2012; Wendisch et al., 2016) with its long range, high ceiling and the possibility for carrying a heavy payload is a great platform to explore clouds in maritime conditions over the ocean with highly resolved measurements. The HALO Microwave Package (HAMP, Mech et al., 2014) has been developed to allow for in-depth remote sensing of clouds and their microphysical properties. It consists of a 35 GHz cloud radar and a 26-channel microwave radiometer covering a spectral range from 20 to 183 GHz.
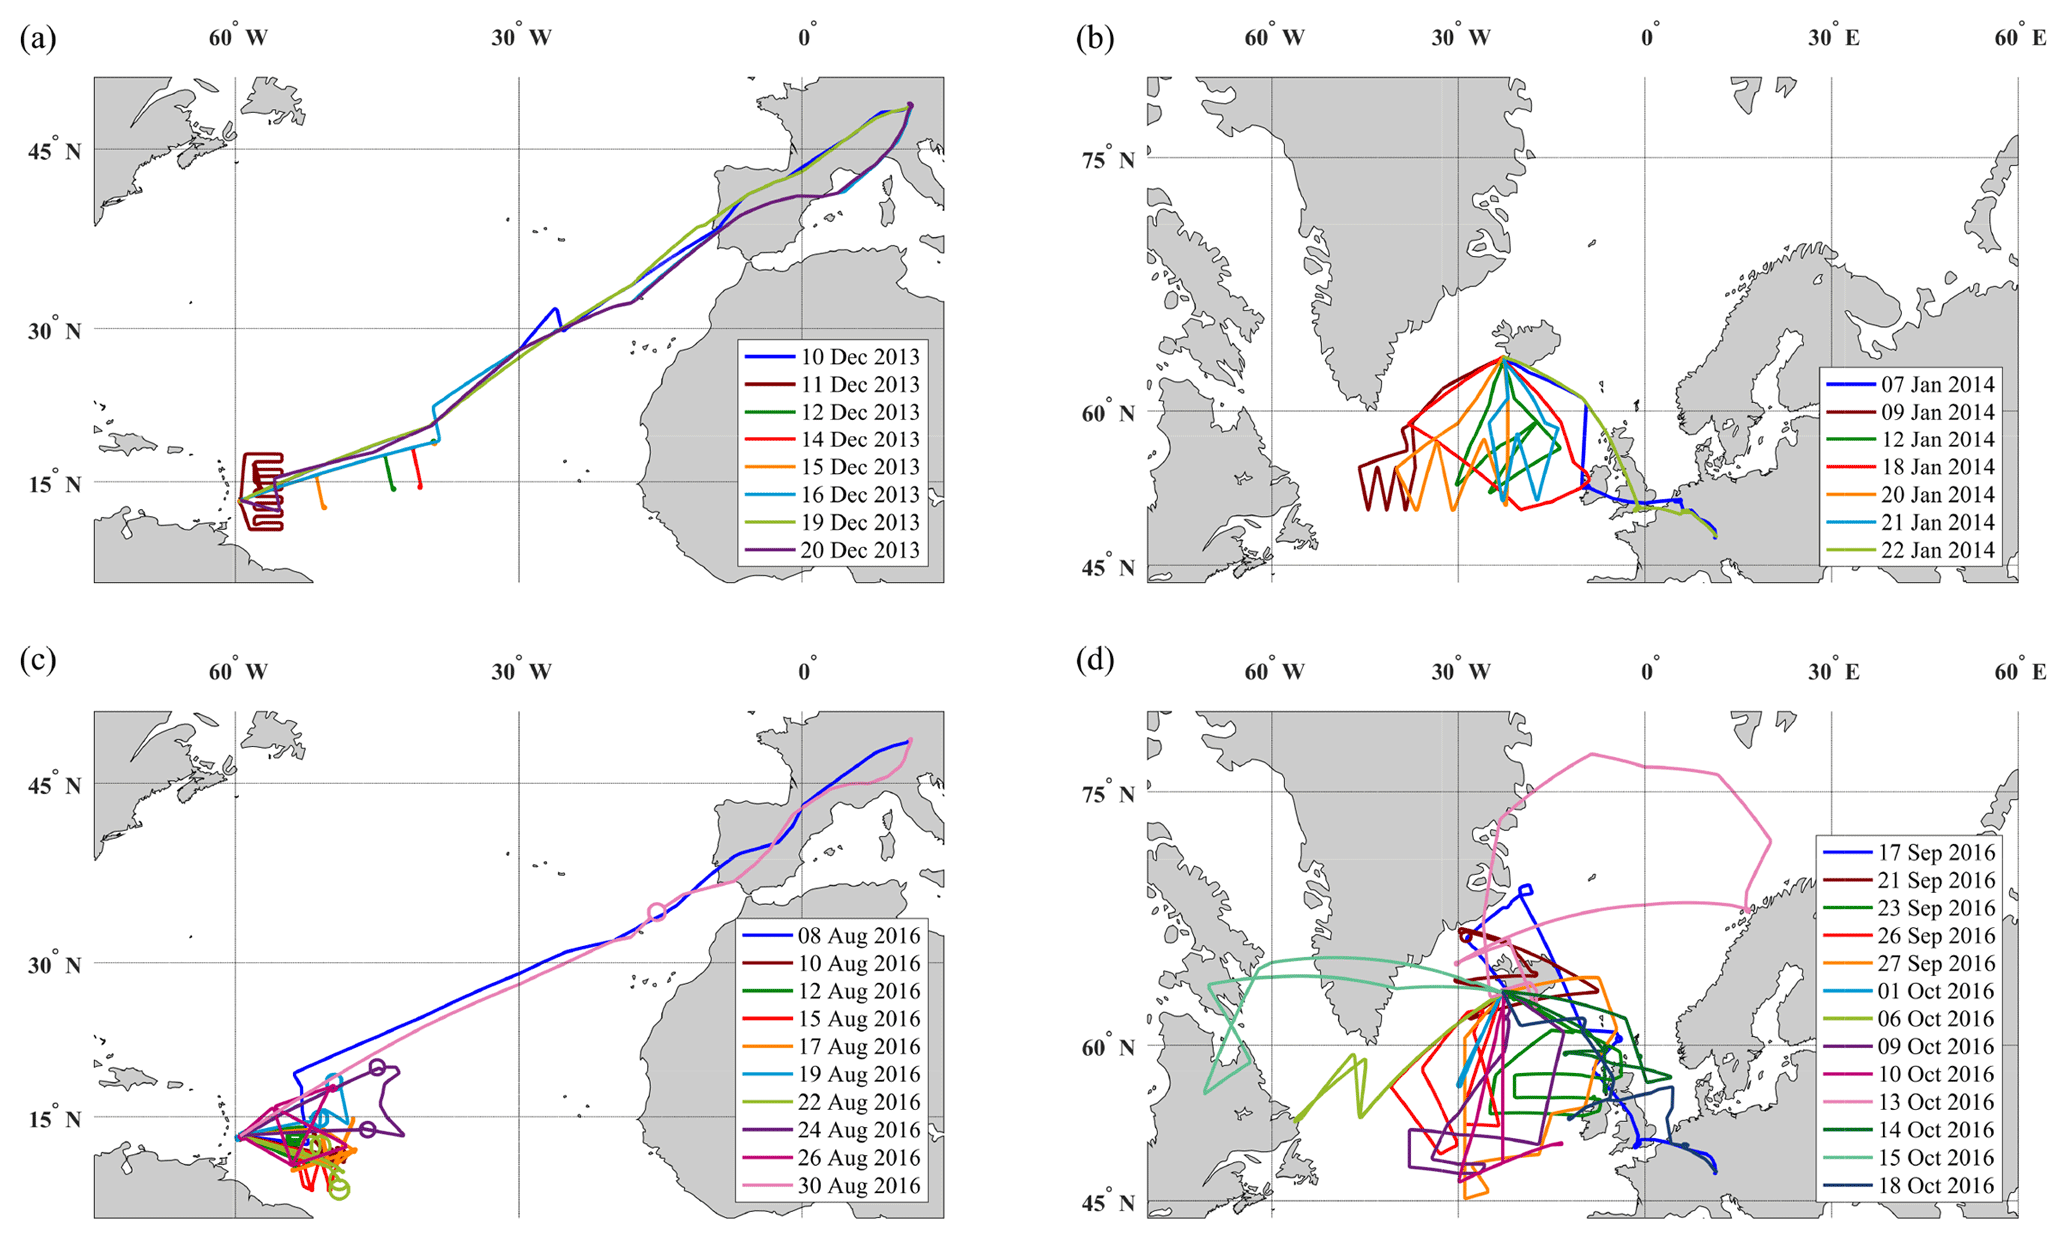
Figure 1Flight tracks from all four campaigns: NARVAL-South (a), NARVAL-North (b), NARVAL2 (c), and NAWDEX (d).
In this article, data sets from four campaigns performed in different climate regimes are presented. The first campaign, NARVAL1 (Next-Generation Aircraft Remote Sensing for Validation Studies), consisted of two subcampaigns: NARVAL-South and NARVAL-North. In December 2013, NARVAL-South focused on observations of shallow convection in the trade wind region of the eastern tropical Atlantic during the dry season and consisted of eight research flights out of Barbados (Fig. 1a). During NARVAL-North in January 2014, postfrontal regimes over the extratropical North Atlantic were observed with seven research flights. The center of operations was Keflavik, Iceland (Fig. 1b). An overview of all NARVAL1 flights and measurements is provided by Klepp et al. (2014). NARVAL2 succeeded this first demonstrator mission in August 2016. During this campaign, HALO was again deployed to Barbados (Fig. 1c). NARVAL2 measurements complement the NARVAL-South measurements with observations of the atmosphere over the tropical Atlantic during the wet season (Stevens et al., 2019). Directly following the NARVAL2 mission, the same HALO payload was flown during the NAWDEX (North Atlantic Waveguide and Downstream Impact Experiment) campaign (Schäfler et al., 2018). Here, HALO was again deployed to Keflavik, Iceland, for 5 weeks in September and October 2016 (Fig. 1d). HAMP observations from NAWDEX give insight into convective clouds and their surroundings in the frontal regions and warm sector of midlatitude cyclones. In this paper, a unified data set comprising HAMP measurement data from the four campaigns described above is presented and made available.
The measurements were rigorously quality controlled to ensure temporal collocation of all instruments and to remove erroneous measurements. Additionally, a quality flag was added to the data sets to communicate the quality of each data point. The data were regridded onto a unified grid for easily combined analyses of the measurements. The HAMP data, together with dropsonde measurements, provide insights into cloud geometry, hydrometeors, vertically integrated humidity and thermodynamic profiles.
Section 2 gives specific information about the four campaigns. A detailed description of the aircraft and instruments is given in Sect. 3. The data set is described in Sect. 4, and the quality control is outlined in Sect. 5. Information about how the data can be accessed is given in Sect. 6.
So far, the HAMP instrument suite has been part of the HALO payload (referred to as the NARVAL payload) during four campaigns: NARVAL1 (with subcampaigns NARVAL-South and NARVAL-North), NARVAL2 and NAWDEX. Two campaigns focused on the observation of clouds and convection over the tropical Atlantic during the dry season (NARVAL-South) and wet season (NARVAL2). The goals of the other two campaigns were the observation of clouds and convection associated with the cold sector (NARVAL-North) and warm sector (NAWDEX) of midlatitude cyclones. During all campaigns, all transfer flights were also research flights with full measurements. The individual campaigns are described in more detail below.
2.1 NARVAL-South
The first NARVAL campaign (NARVAL-South) took place between 10 December 2013 and 22 December 2013. This campaign and the campaign that followed directly after, NARVAL-North, were first and foremost planned as a demonstrator mission to assess the capabilities of HALO and HAMP to work as an airborne cloud remote sensing platform. Additionally, the focus of this campaign was to assess the representativeness of ground-based measurements on Barbados (Stevens et al., 2016) for a broader trade wind region over the tropical Atlantic and to evaluate satellite observations on collocated tracks (Klepp et al., 2014; Stevens et al., 2016). This was done by flying underneath the satellite, along the projected satellite track near the satellite overpass time. In total, eight flights amounting to about 67 flight hours were conducted. Of the eight flights, four flights were cross-Atlantic transects during transfers between Oberpfaffenhofen, Germany (OBF), and Grantley Adams International Airport, Barbados (BGI), and four were local flights over the tropical North Atlantic east (and upwind) of Barbados. The overall flight time for individual flights was around 10 h for transatlantic flights and around 7 h for local flights. Target areas of this campaign were the trade wind region east of Barbados as well as cross-Atlantic transects. The synoptic situation was relatively constant from flight to flight. Therefore, flight planning was done mainly in the interest of gathering statistically sound data and to compare with satellite data. A-Train collocations were achieved during seven flights. All flights and their aims are listed in Table 1, and flight tracks are shown in Fig. 1a.
Table 1List of NARVAL-South flights. All flights include observations of shallow trade wind convection. Additional flight characteristics are listed in the last column.
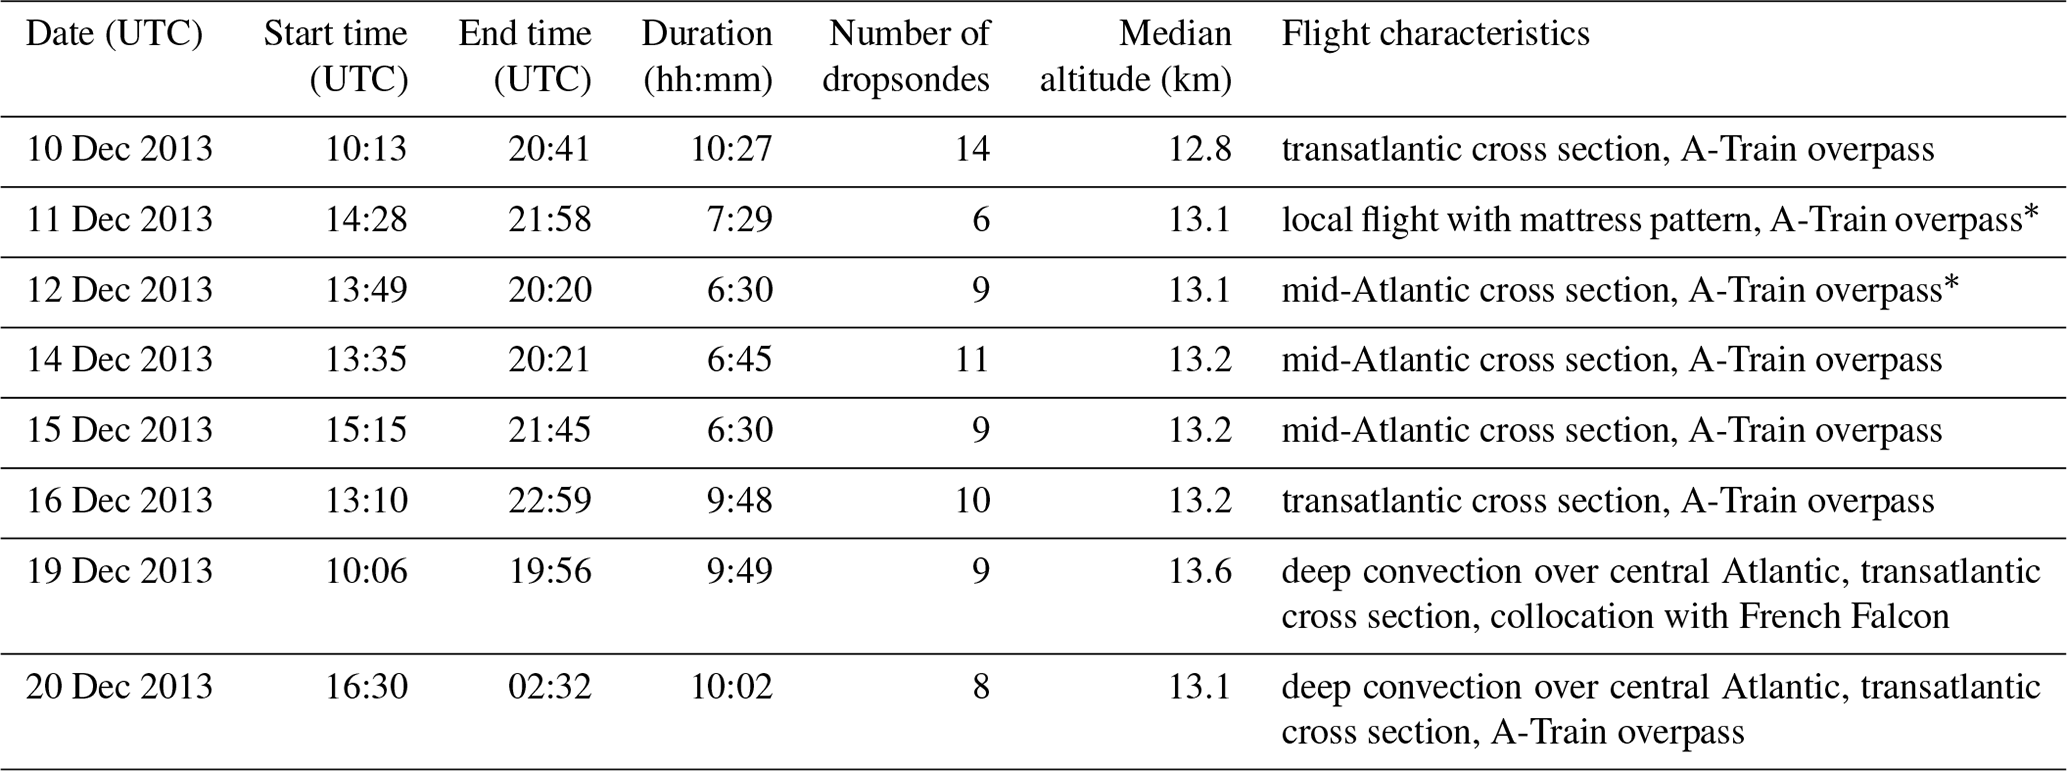
∗ 183 GHz radiometer module working only part of the time.
2.2 NARVAL-North
Following directly after the first campaign, NARVAL-North took place from 7 to 22 January 2014. The center of operation was at Keflavik International Airport, Iceland (KEF). During this campaign, seven flights were conducted, overall amounting to 46 flight hours. The target area was the extratropical North Atlantic south and southwest of Iceland. The aim of NARVAL-North was to analyze postfrontal convective regimes of midlatitude cyclones over the extratropical North Atlantic and to investigate the accuracy of existing satellite precipitation climatologies (Klepp et al., 2014). Flight planning was done taking into account current synoptic situations. The flights mainly sampled the cold sector of midlatitude cyclones as well as some occlusions. A-Train collocations were achieved during four flights. Figure 1b shows the flight tracks of NARVAL-North, and in Table 2 all flights and their aims are listed.

2.3 NARVAL2
NARVAL2 followed up on NARVAL-South with a stronger focus on the local region around Barbados and over the tropical Atlantic between 8 and 30 August 2016. Ten research flights were flown for a total of about 84 flight hours (Table 3) with different flight tracks (Fig. 1c). The center of operation was again BGI on Barbados. A-Train collocations were achieved during five flights as well as collocations with the satellites GPM (Global Precipitation Measurement) and Megha-Tropiques. The aim of the campaign was to assess the interaction between large-scale dynamics and the evolution of convective systems over the tropical Atlantic (Stevens et al., 2019). Of the 10 flights during this campaign, 2 flights were transfers to and from Barbados. The remaining flights took place over the tropical North Atlantic east and southeast of Barbados. Three of these flights focused on clouds in and associated with the Intertropical Convergence Zone (ITCZ). The other five flights took place further north and mainly over shallow convection. Two flights focused on the surrounding atmosphere of Hurricane Gaston (2016). However, due to instrument failure, no radar measurements are available from these two flights. A special flight pattern, i.e., circles with a radius of about 110 km with frequent dropsonde launches, was performed in order to measure the large-scale vertical motion (Bony and Stevens, 2019) on six flights.
Table 3List of NARVAL2 flights.

a 183 GHz radiometer module working only part of the time. b No radar measurements.
2.4 NAWDEX
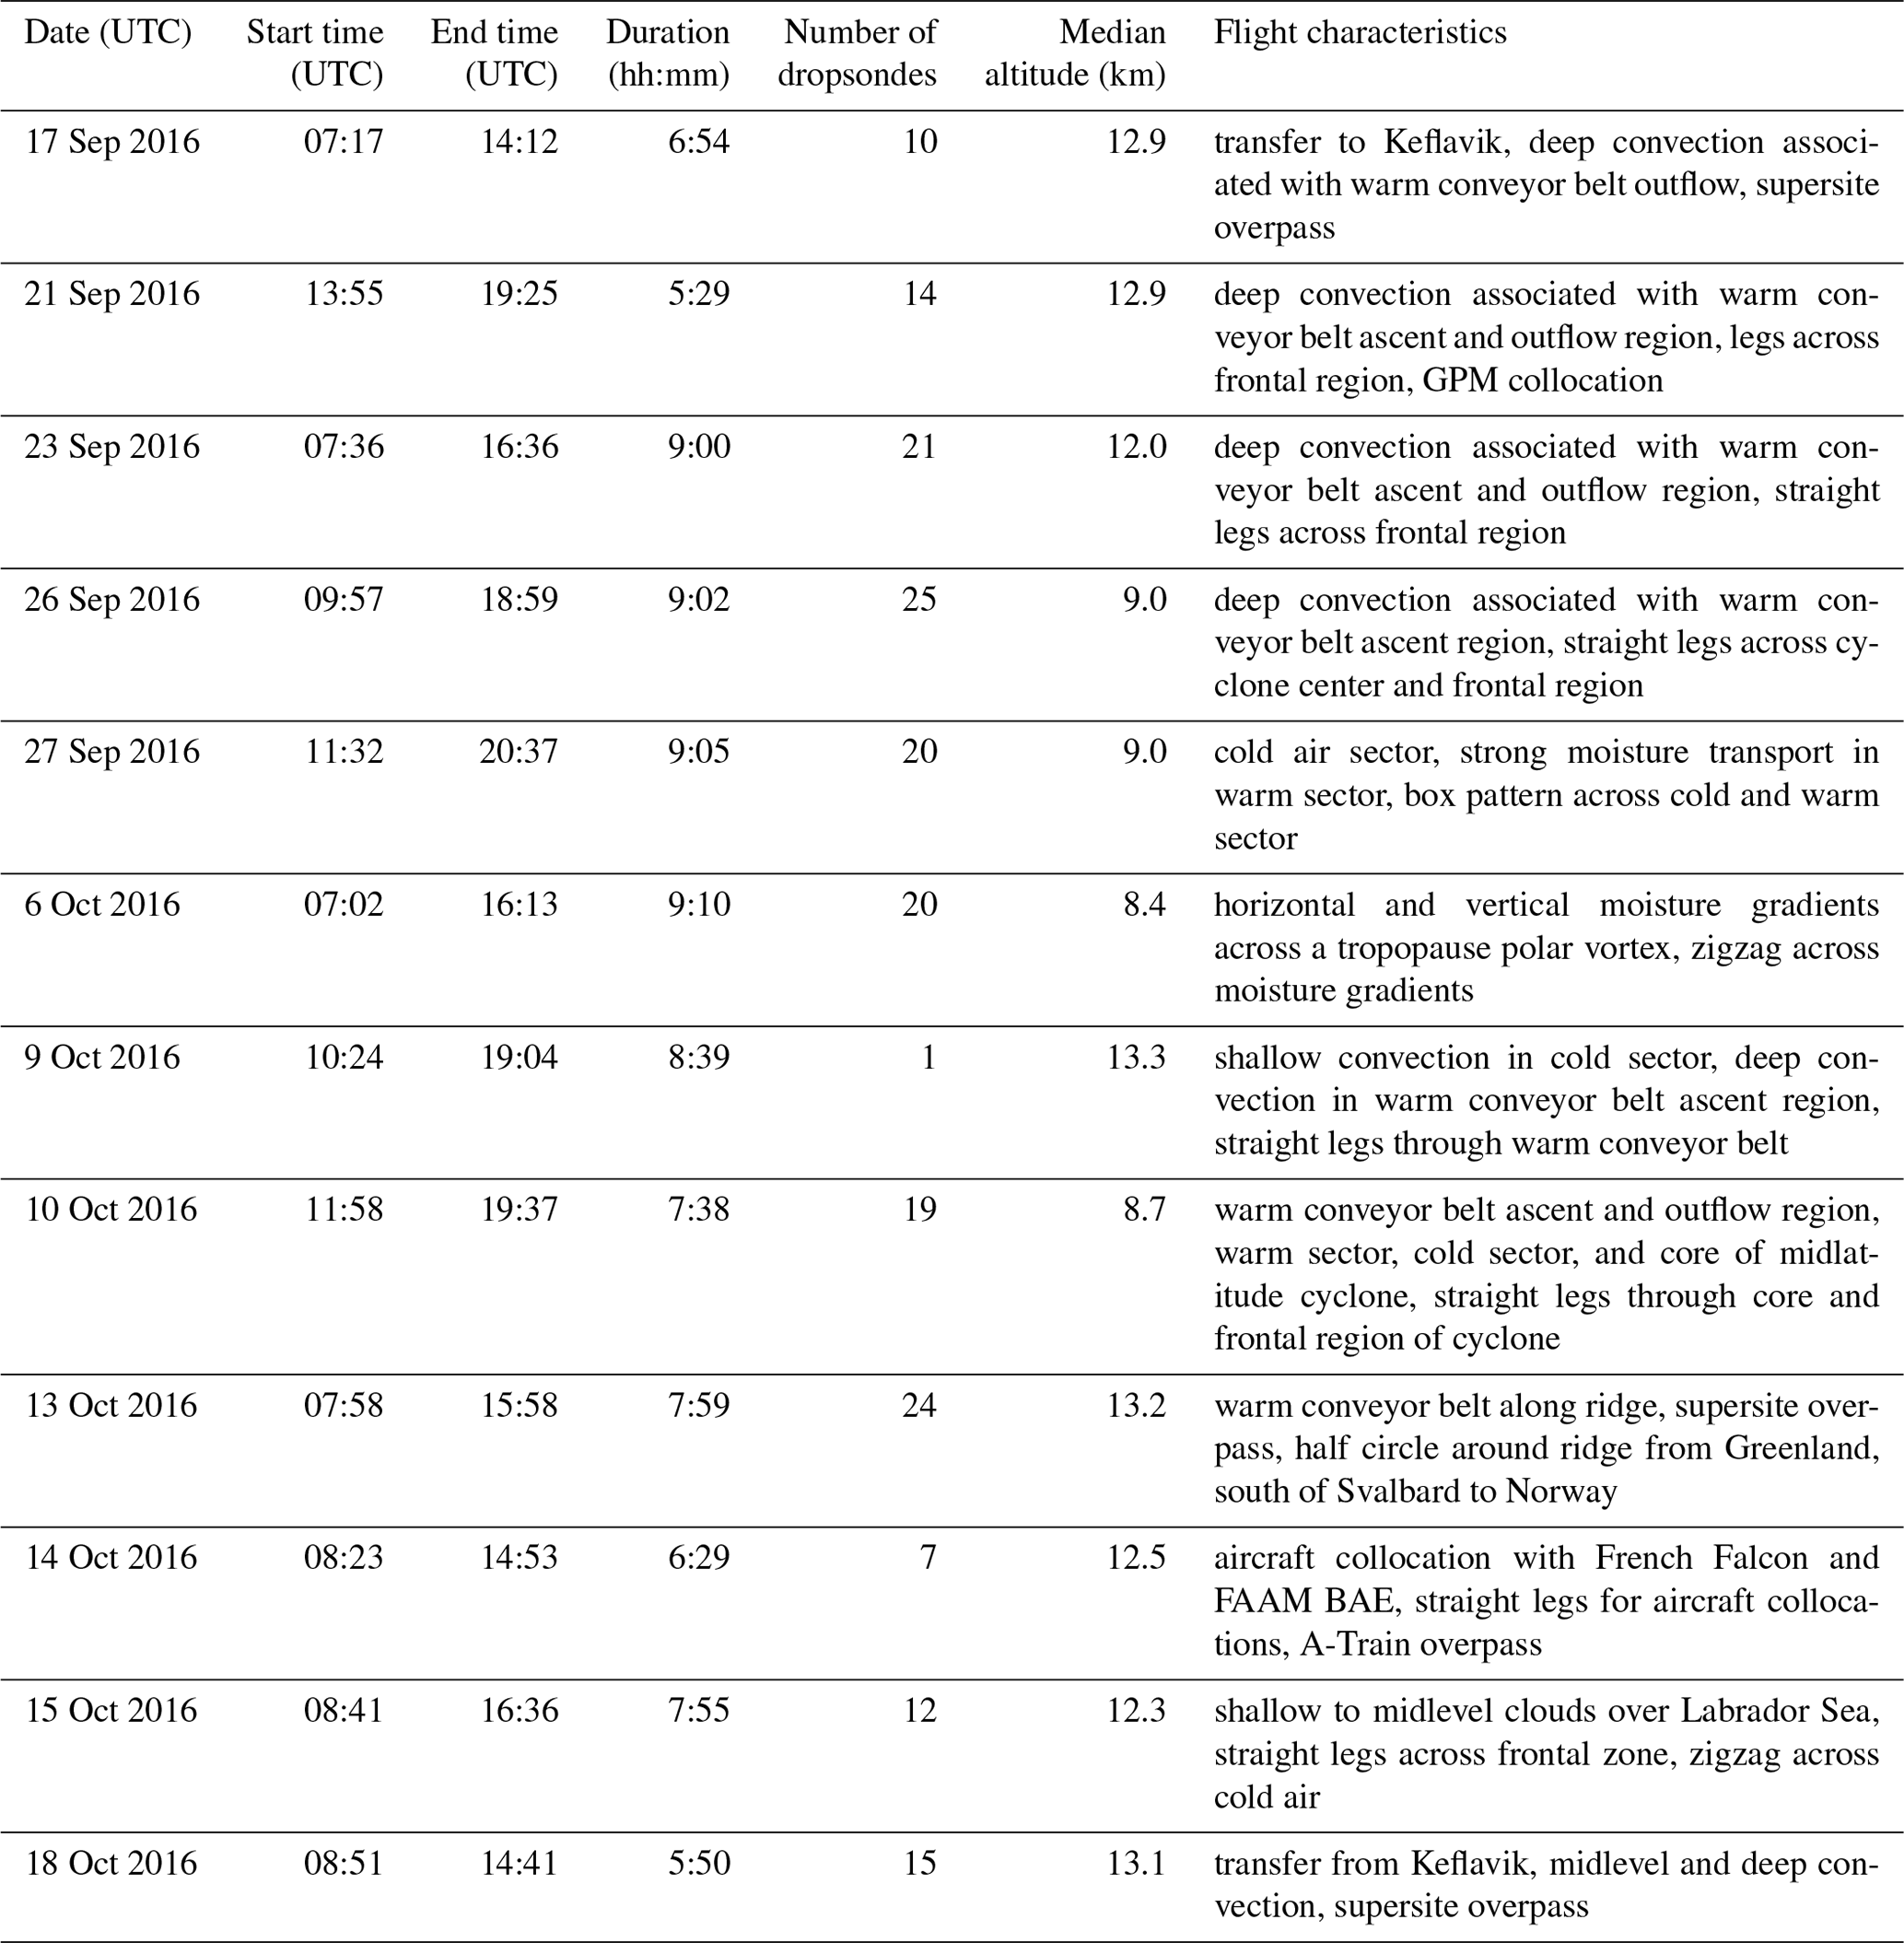
The fourth campaign of this set, NAWDEX, took place from 17 September until 18 October 2016. Thirteen flights amounted to about 96 flight hours. During this campaign, HALO, along with other research aircraft, was stationed at KEF on Iceland. Figure 1d shows the flight tracks of NAWDEX. A-Train collocation was achieved during one flight. Of the 13 flights during this campaign, two were transfers to and from Keflavik. The main target of the flights during this campaign was the clouds associated with the warm conveyor belt of midlatitude cyclones (Schäfler et al., 2018). Flight planning was done taking into account current synoptic situations. In Table 4, all flights and their aims are listed. The flights mainly sampled the warm sector and frontal systems of midlatitude cyclones.
Instruments described in this paper were part of the NARVAL payload on board the German research aircraft HALO (High Altitude Long Range Research Aircraft). The aircraft, the HAMP instruments and the dropsondes are described in the following sections.
3.1 The HALO aircraft
The HALO aircraft is a Gulfstream G550 with a ceiling altitude up to 15 km and long endurance of up to 10 h (Krautstrunk and Giez, 2012; Wendisch et al., 2016). HALO's capabilities of high ceiling and long range enable researchers to cover a wide variety of atmospheric conditions during a single flight and to fly above the main airline traffic and most cloud systems. Thus, measurements on board HALO often provide a view of at least a large part of or even the entire troposphere through measurements. The median flight altitude was 13.1 km for the NARVAL-South campaign and 7.8 km during NARVAL-North, taking into account the lower tropopause height of the target region in winter and flight restrictions. During NARVAL2, the median flight altitude was 9.7 km, and during NAWDEX it was 12.4 km. The lower altitudes during NARVAL2 were flown to accommodate for the fact that dropsondes were launched in quick succession during some of these flights (see Sect. 3.2.3).
The HALO aircraft is equipped with the Basic HALO Measurement and Sensor System (BAHAMAS). This instrument system provides data about the aircraft's location and attitude (position, altitude, heading, roll and pitch angle) and atmospheric measurements at aircraft level (e.g., temperature, humidity, pressure) (Krautstrunk and Giez, 2012). During the first two campaigns, data were sampled at 1 Hz, while, in 2016, 100 Hz data were also available. In this data set, however, the 1 Hz data are provided for all flights, since these correspond best to the sampling rates of the other instruments. Measurements of aircraft location (latitude, longitude, altitude above WGS84 ellipsoid) and attitude (angles of roll, pitch and heading) are provided in this data set. Note that most measurements were performed in straight legs or large circles with only 6.72 % of the measurements having a roll angle of more than 5∘.
The median speed above ground was 224 m s−1, and therefore measurements with a resolution of 1 s roughly represent a distance of about 200 m. Typically, it took 35 min to reach flight level after takeoff and 30 min for the final descent.
3.2 Instrument description
The HALO Microwave Package (HAMP, Mech et al., 2014) comprises microwave radiometers with 26 channels in the range between 20 and 183 GHz and a 35 GHz cloud radar. The radiometer modules and radar antenna are mounted below the fuselage inside the belly pod (see Fig. 1 of Mech et al., 2014) with a nadir viewing direction. Mech et al. (2014) illustrate the sensitivity of the different measurements with respect to hydrometeors. Besides the HAMP data, profiles from dropsonde measurements and auxiliary data from the aircraft's basic data system are also included in the published data set described here. The specifications of these instruments are listed in Table 5 and are described in the following sections.
Table 5Instruments used all four campaigns that provided measurements for this data set.
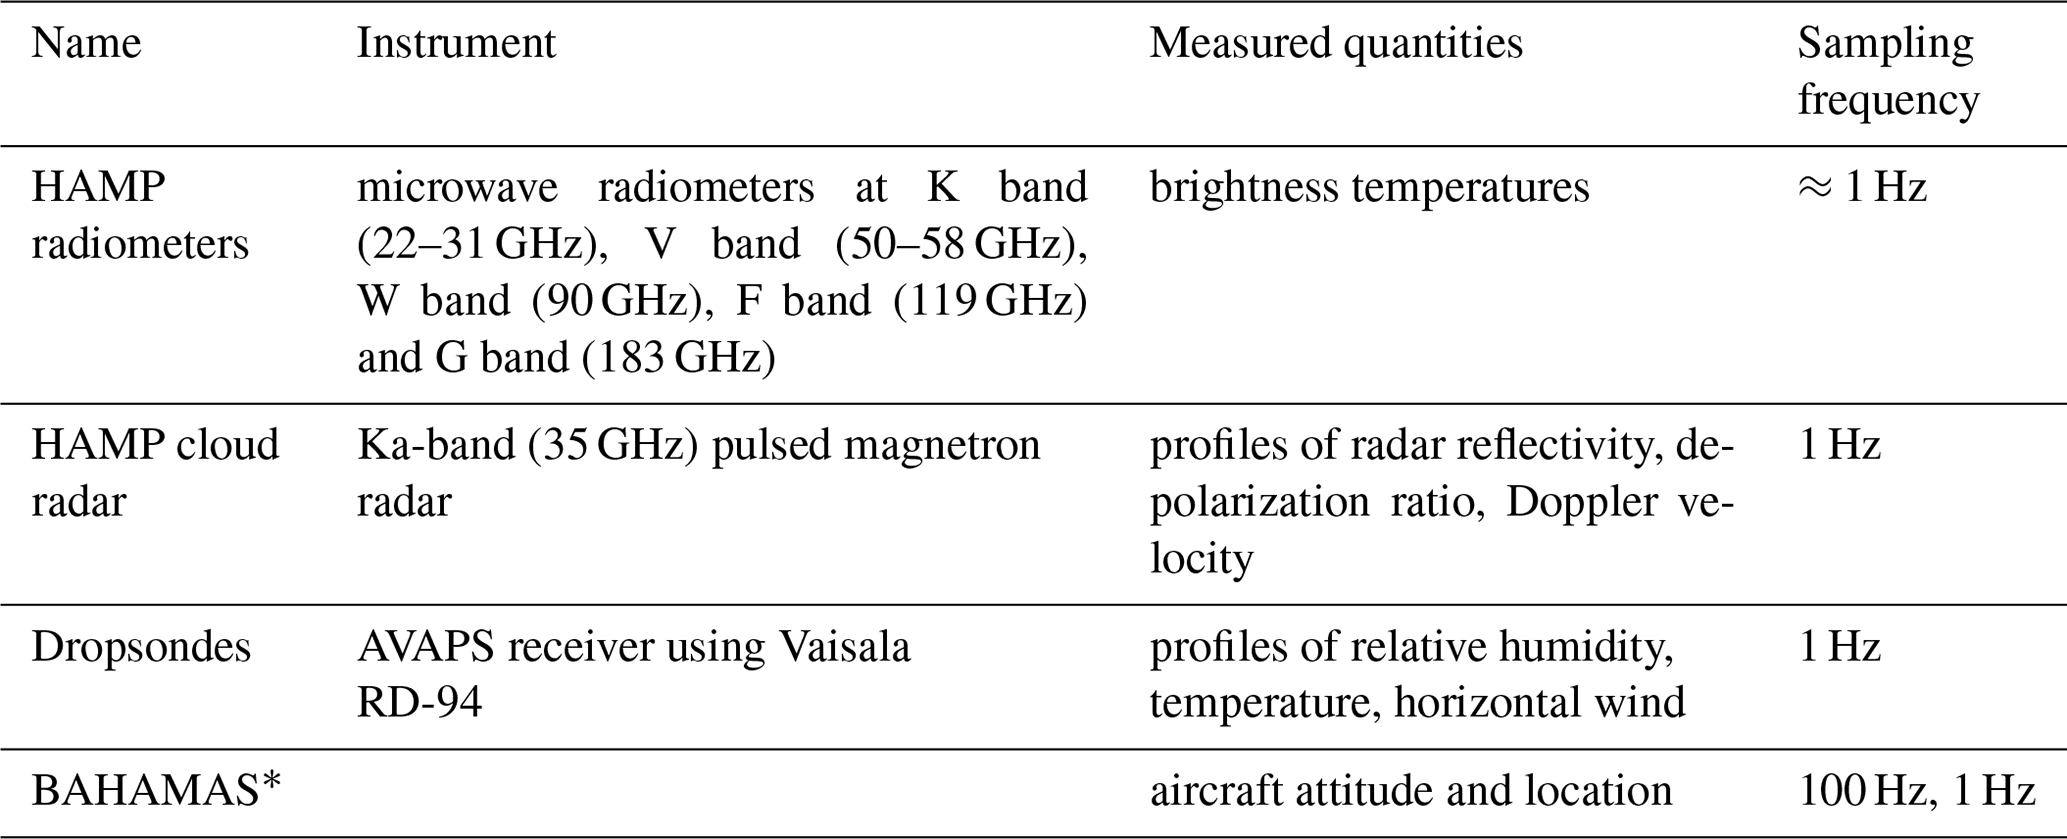
∗ BAHAMAS: Basic HALO Measurement and Sensor System.
3.2.1 Microwave radiometers
The HAMP microwave radiometers were custom-manufactured by Radiometer Physics GmbH (RPG, Meckenheim, Germany). They comprise five modules that measure time series of brightness temperatures at 26 frequencies with a sampling rate of approximately 1 Hz. The 22 GHz and the 183 GHz rotational water vapor lines are probed with seven channels each along the line. In contrast to the 22 GHz module, the 183 GHz one hosts a double-sideband receiver, and therefore the signal is a composite from passbands on both sides of the line. The oxygen absorption complex at 60 GHz is measured with seven single-sideband channels while the double-sideband receiver of the 118 GHz oxygen line has four channels. In addition, a window channel at 90 GHz is highly sensitive to liquid water emission. The noise-equivalent delta temperature (NeDT) has been determined for in-flight scenes and is best for the lowest frequencies (below 0.3 K) and worst for the 90 GHz channel and 183 GHz bank (below 0.6 K). Mech et al. (2014) provide more details on instrument specifications. The receivers undergo frequent relative calibration during flight, and therefore the most critical feature of the microwave radiometer measurements is the absolute calibration (cf. Küchler et al., 2016), which is discussed further in Sect. 5.1.
3.2.2 Cloud radar
The MIRA35 cloud radar was manufactured by METEK GmbH (Elmshorn, Germany). It operates in the Ka band at 35 GHz and is a monostatic, pulsed, magnetron, Doppler radar (Mech et al., 2014). An advantage of this frequency over the often used W band is that it is less affected by attenuation due to condensate. Measured variables are mainly profiles of reflectivity, linear depolarization ratio, Doppler spectra and Doppler velocity. In case of the HAMP radar, measurement of Doppler velocity was strongly affected by aircraft motion and is therefore not provided. In this data set, the reflectivity and linear depolarization ratio are provided. The data sampling rate is 1 Hz. At 13 km flight altitude, sensitivity is dBZ and footprint size is ≈130 m. The vertical resolution of the measurements is 28.8 m. Only measurements above approximately 6 km flight altitude were conducted to avoid a too-strong return from the surface into the receiver at lower levels. After some initial analyses, an offset was discovered and quantified (Ewald et al., 2019). This correction is discussed further in Sect. 5.3.
3.2.3 Dropsondes
Vaisala RD94 dropsondes (Busen, 2012) were deployed in all campaigns using the Airborne Vertical Atmospheric Profiling System (AVAPS, Hock and Franklin, 1999). Wang et al. (2015) and Vaisala (2017) report that the measurement accuracy of these sondes for pressure is 0.4 hPa, temperature is 0.2 ∘C and relative humidity is 2 %. The accuracy of horizontal wind speed measurements is estimated to be 0.1 m s−1. Overall, 525 dropsondes were released. These sondes took measurements of profiles of temperature, humidity, pressure, wind speed, wind direction and location while falling to the surface. The data sampling rate of these sondes was usually 2 Hz. The locations for releasing the dropsondes were chosen based on the atmospheric conditions. We attempted to deploy at least one sonde in clear-sky conditions to have as a reference for radiometer retrievals. For most of the flights, at least one dropsonde per flight was released. The length of the horizontal drift distance varied substantially from drop to drop. The median of the horizontal drift distances for all dropsonde measurements was 3.8 km, while the upper and lower quartile of horizontal drift distances was 10.8 and 2.3 km, respectively.
Operational constraints limited where sondes could be released. Air traffic control had to clear every release in advance. This request was only granted if the airspace below the research aircraft was empty. Therefore, it was not always possible to release the sondes where it was most meaningful from a meteorological point of view. During the northern campaigns, we often had to decide to either fly below the transatlantic air traffic where the sondes could be released or above the traffic to get a more comprehensive profile of the entire troposphere without releasing sondes.
Another constraint for dropsondes was that the receiving unit on board the aircraft could record measurements from up to four dropsondes simultaneously. So, to launch sondes in quick succession, as was necessary for some of the NARVAL2 flights, and still record the entire lower tropospheric profile, the decision was made to fly at lower altitudes of about 8 km during flights where this was needed.
A combined snapshot of radar and radiometer measurements is shown in Fig. 2. Figure 2a–d with time series of brightness temperatures Tb from different radiometer modules show integrated information of the atmosphere below the aircraft at each time step. Over the radiatively cold ocean, the emission by liquid water can be seen as an increase in Tb. The strength of the emission increases with frequency and can be best seen in the window channels, at 31.4, 90 and 118±8.5 GHz (Fig. 2a, c), that are less affected by emission from water vapor and oxygen. In combination with channels sensitive to water vapor, e.g., 22 GHz (Fig. 2a), the liquid water path can be derived using statistical algorithms (cf. Schnitt et al., 2017). Scattering of microwave radiation on ice particles increases in strength considerably with increasing frequency. The strong Tb depressions in channels around 183 GHz (Fig. 2d) result from scattering by larger ice particles and can be used to infer ice content. Channels along the 60 GHz oxygen complex (Fig. 2b) can better penetrate the atmosphere the further away they are from the absorption maximum and can therefore give information on the temperature profile. In summary, the combination of measurements from different channels can be used to derive the integrated water vapor and liquid water path (Schnitt et al., 2017; Jacob et al., 2019), coarse-resolution temperature and moisture profiles, and information on ice and snow occurrence. An example of retrieved liquid water path and rain water path is shown in Fig. 3 to demonstrate the potential of the HAMP measurements. This scene from the NARVAL1 campaign shows the time series of the retrieved quantities together with radar reflectivity measurements. The retrieval algorithm is described in depth in Jacob et al. (2019).
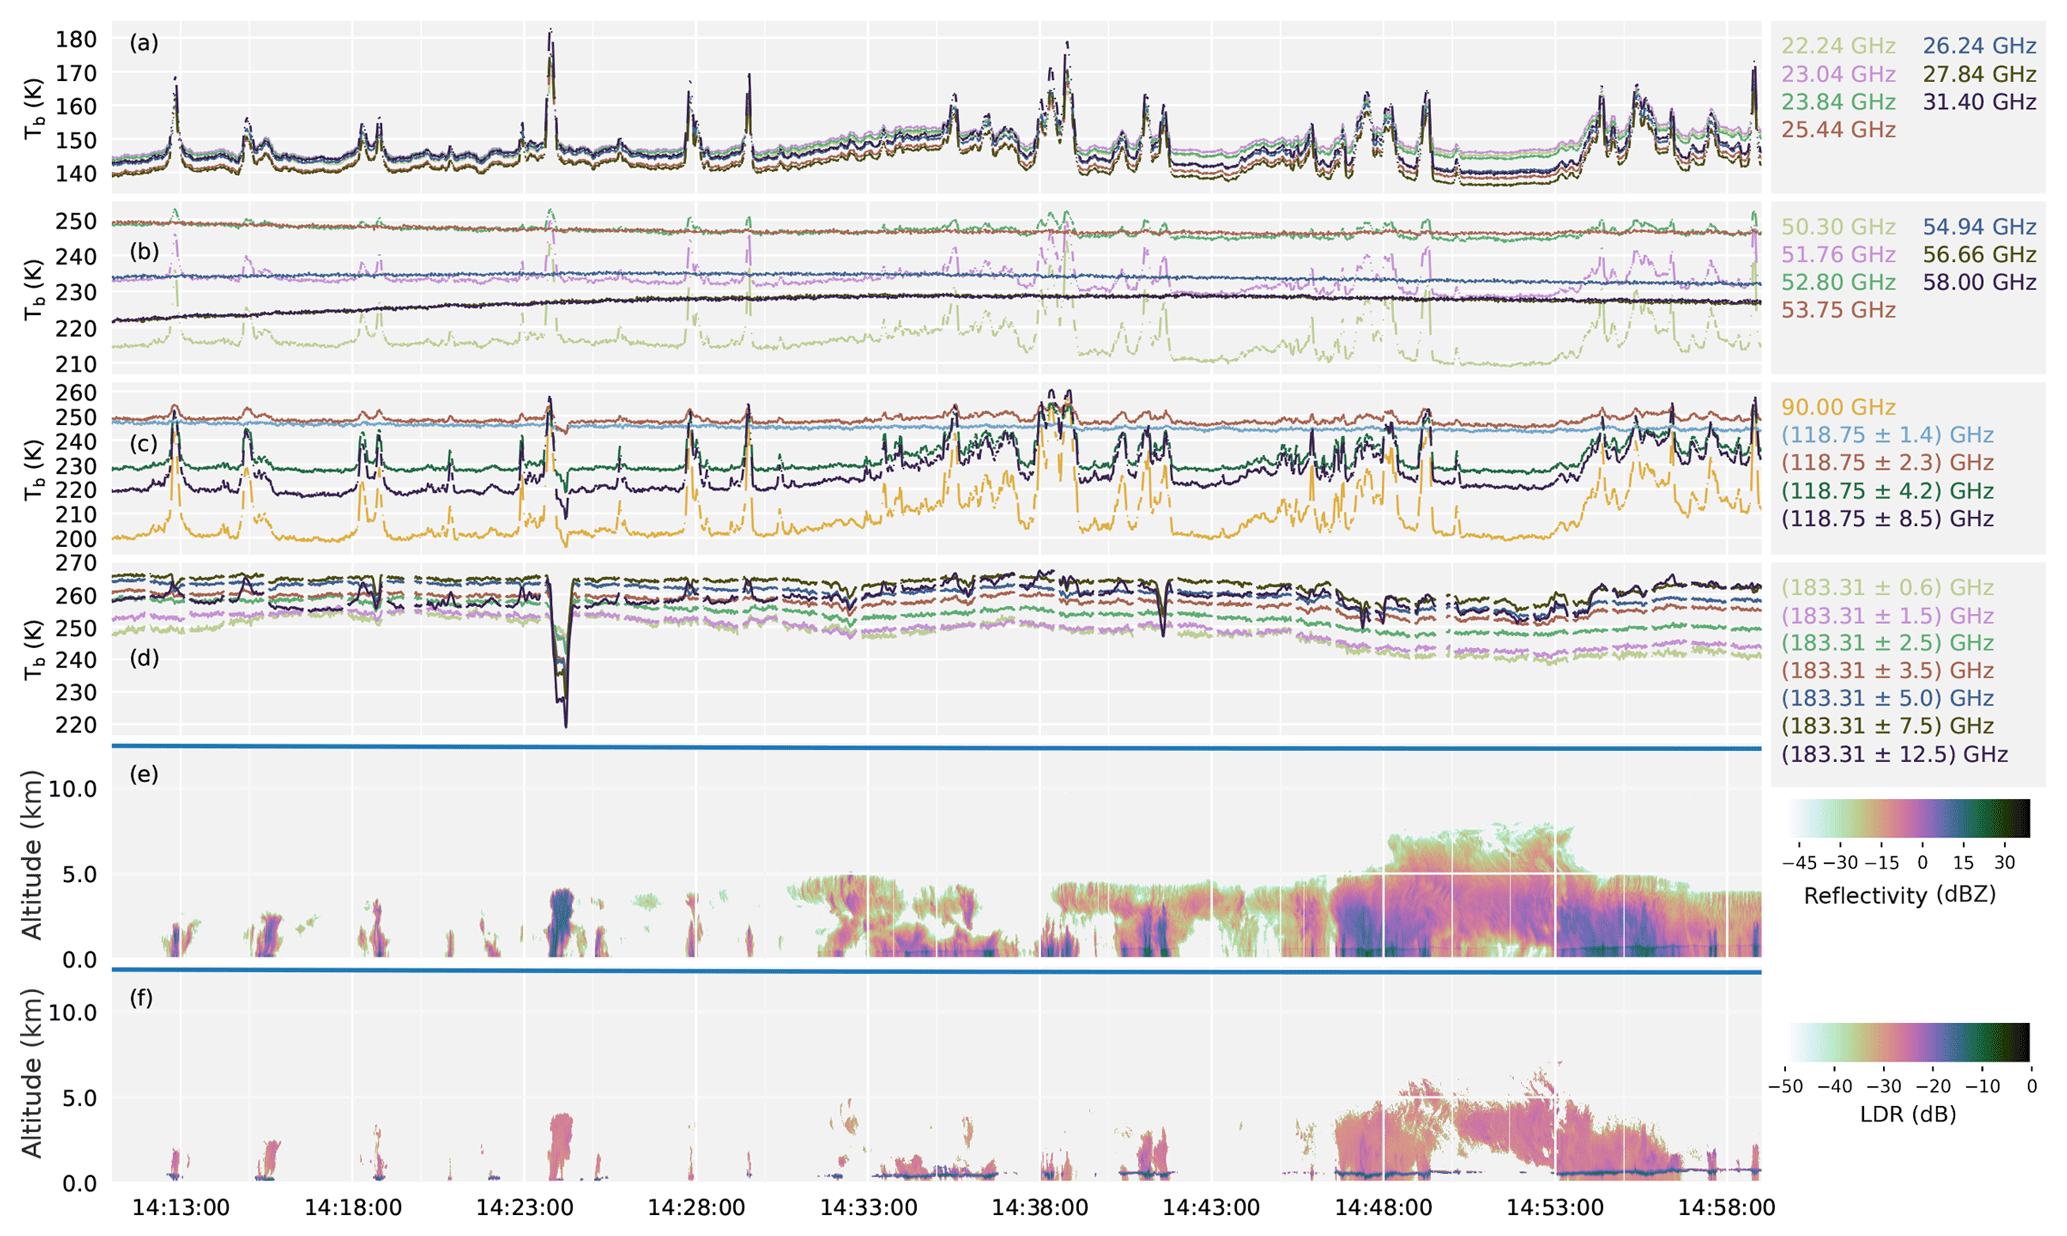
Figure 2Quick look of HAMP measurements during the NAWDEX flight on 6 October 2016. (a–d) Time series of brightness temperatures (lines) for individual radiometer modules. (e) Profiles of radar reflectivity (shaded) and HALO's flight altitude (solid line). (f) Profiles of radar linear depolarization ratio and HALO's flight altitude (solid line). The distance traveled by the aircraft during this time is roughly 710 km.
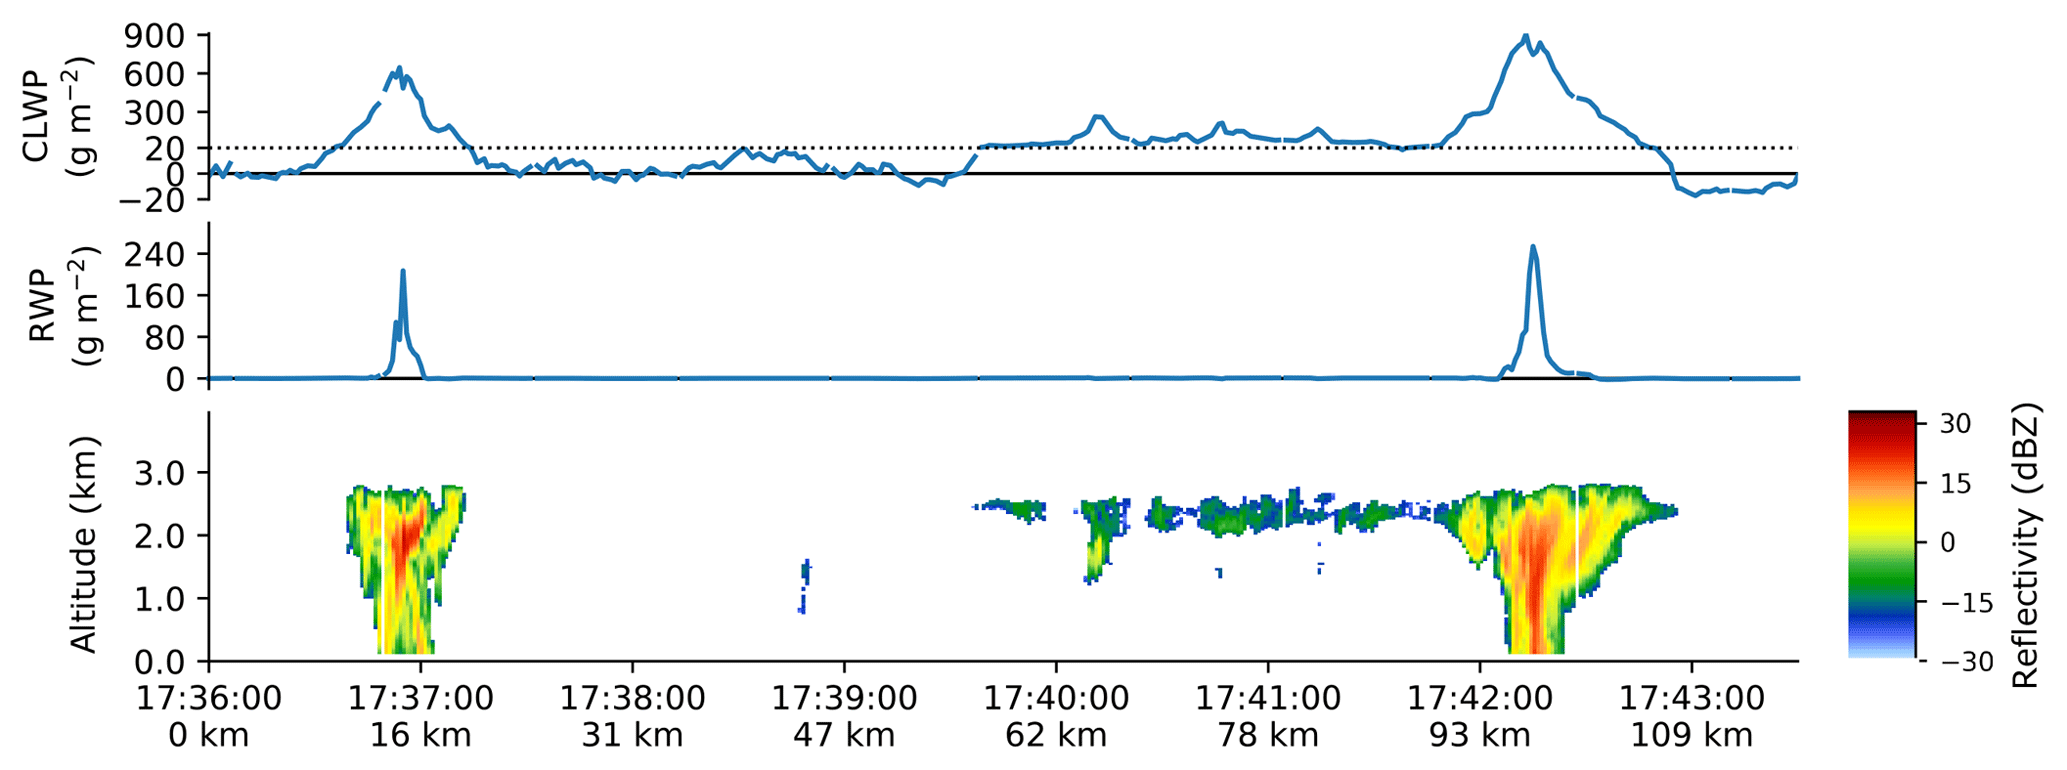
Figure 3Example of retrieved quantities from active and passive HAMP measurements from NARVAL1 research flight 8 on 20 December 2013. Top: cloud liquid water path; middle: rain water path; bottom: radar reflectivity. Note the scale change in the top panel at 20 g m−2. For more information on the retrieval methods, see Jacob et al. (2019). (Figure adapted from Jacob et al., 2019.)
The radar reflectivity (Fig. 2e) shows a cross section of the clouds the aircraft passed over. Reflectivity of the cloud radar at 35 GHz is a measure of size and number of cloud droplets. The linear depolarization the ratio (LDR, Fig. 2f) is defined as the ratio of the cross-polarized reflectivity factor to the copolarized reflectivity factor. For a perfectly spherical particle, the backscattering in the cross-polarized reflectivity factor is zero in linear units and −∞ in logarithmic dB units, and thus the ratio also is zero or −∞, respectively. The LDR increases the more the shape of the scattering particle deviates from perfect symmetry (Oue et al., 2015). In Fig. 2e and f, the melting layer is visible as a horizontal line of high reflectivity together with high LDR values just below 1 km.
Data processing was done to convert the measured data into an easily usable format and to ensure good quality of the data. The data were inspected and flagged accordingly. Finally, all data were transformed onto a unified grid with a temporal resolution of 1 s. For cloud radar and dropsondes the vertical resolution is 30 m. These steps will be briefly discussed below.
5.1 Radiometer calibration
The radiometers were calibrated on the ground before almost every flight using the manufacturer's warm and cold load calibration method. In this method, each radiometer was pointed successively on a warm black-body target at ambient temperature and on a cold black-body target cooled down to the boiling point of liquid nitrogen (LN2). Targets with an open air–LN2 interface were used during the NARVAL1 campaigns. Later, these were exchanged with targets embedded in a foam box that is transparent to microwaves, avoiding reflections at the LN2 interface. The new targets were vertically oriented, and a metal mirror was used to redirect the view from nadir to horizontal. During flight, the radiometers were continuously calibrated using two reference loads. More details are given by Mech et al. (2014).
The quality of the original brightness temperature measurements was evaluated by comparing them with synthetic ones simulated from dropsonde profiles of clear sky. For this comparison, the sondes were filtered for clear-sky conditions with low atmospheric variability, and their thermodynamic profiles were fed into the Passive and Active Microwave TRAnsfer model (PAMTRA). Random discrepancies between both can be attributed to the matching of HAMP nadir measurements and the drifting sondes. The systematic differences could be identified and cannot be explained by systematic errors of the drop sonde measurement nor the microwave absorption model. Most likely they result from changes within the belly pod during takeoff. Because some differences in the biases between different flights could be found, a bias correction based on the mean differences between synthetic and measured brightness temperatures was performed. However, for some flights only very few or no drop sondes are available. In order to arrive at a robust correction, those flights having three or less dropsondes were corrected using the campaign mean. For further information, the offset corrections used for each channel are included in the data files.
5.2 Removal of erroneous radiometer measurements
Some obvious errors in radiometer measurements occurred during the campaigns. During the NARVAL-South and NARVAL2 campaigns, the 183 GHz radiometer module suffered from instabilities during the initial phase of some flights. Because of strong drifts, the regular gain calibration (performed approximately every 5 min) caused a sawtooth pattern whose amplitude decreased with time as the module became more stable. After NARVAL2, a broken dielectric resonator oscillator (DRO) was replaced. Furthermore, in some instances, unreasonably high or low values were recorded by different modules likely due to instabilities in data transfer. This is also thought to be the reason that time stamps sometimes did not increase continuously but jumped ahead or backwards in time.
All data were inspected thoroughly by eye, and errors of brightness temperature from sawtooth patterns or spikes in data were not corrected but removed from the data set. The erroneous time stamps were reconstructed where possible. If the interval with faulty time stamps was too long and reconstruction was not possible, the data were removed. Additionally, measurements during turns (roll angle >5∘) or when the aircraft was below 6 km altitude were removed.
5.3 Reflectivity bias correction
By comparison with airborne and spaceborne radar measurements at 95 GHz, it has been observed that HAMP radar reflectivity was too low by 8–10 dBZ. To assess the exact value of this offset, Ewald et al. (2019) derived a calibration value for the HAMP cloud radar reflectivity. To this end, calibration maneuvers with constant bank angles were flown during NARVAL2 and NAWDEX while the radar emitting power was reduced to use the returned sea surface signal. Additionally, individual instrument components were measured to calibrate the cloud radar. This calibration was validated with other airborne and spaceborne measurements. Ewald et al. (2019) concluded that the resulting bias of 7.6 dBZ originated from differences in software configuration and instrument calibration. This value is constant over the entire measurement range and was added to all reflectivity measurements in this data set.
5.4 Radar data quality flag
The radar data include some features that might not be desirable to use: in the beginning of flights and sometimes also around measurement interruptions when data were recorded but no radiation was emitted, the data include noise. Further, on a couple of flights, calibration maneuvers for the radar were executed (Sect. 5.3). During these maneuvers, the transmitting power of the radar was changed and thus the received signal also changed. Additionally, especially when the aircraft overflew land, the unified radar data contain pixels that are at or below the surface. All of these cases – surface and subsurface, sea surface, noise, intervals with calibration maneuvers – were marked in an additional data flag variable indicating the state of the radar data: data ok (0), noise (1), surface or subsurface (2), sea surface (3), radar calibration (4). For additional information, a variable that indicates a turning of the aircraft (roll angle >5∘) was added to the data set.
5.5 Temporal collocation
To ensure comparability of measurements of a certain time interval, a good temporal collocation of the instruments is needed. Temporal collocation of HAMP measurements with HALO's onboard instrumentation (BAHAMAS) was performed independently for radar and microwave radiometers. A good synchronization with BAHAMAS lets us then assume that also radar and radiometer measurements are synchronized well.
Temporal collocation between the cloud radar and BAHAMAS was checked by using the aircraft attitude data from BAHAMAS to correct the radar data for this attitude. The idea is that, if time stamps between both systems match perfectly, the surface return signal from the ocean surface should be a straight line, even during turns of the aircraft. To test for the time difference, the time series were shifted and the quality of attitude correction was assessed by looking at the variance of the height of the surface (taken as the maximum signal in each profile). The accuracy of this procedure is estimated to be 2 s. The analyzed temporal differences mainly ranged between 0 and 2 s. The maximum difference was 19 s. Measurements were corrected with these found offsets.
Temporal collocation between radiometer modules and BAHAMAS was investigated by looking at the transition between land and sea. This happens shortly after takeoff or before landing since both airports, Barbados Grantley Adams Airport and Keflavik Airport, are located close to the coast. This becomes possible since the microwave emissivity at low frequencies strongly differs between ocean (about 0.5) and land (about 0.9). The NAVO/GHRSST global 1 km land–sea mask (https://www.ghrsst.org/ghrsst-data-services/tools/, last access: 8 June 2018) was used to identify locations where the aircraft passed the shore. The footprint of the radiometers at an altitude of 900 m during takeoff is approximately 70 m long, which corresponds to 0.7 s at a groundspeed of 105 m s−1. The aircraft flies with a pitch of about 11∘, and therefore the instruments look ahead of the aircraft position. Due to this looking ahead and the calculated footprint at this altitude, the accuracy of the estimated land–sea transition is about 2.5 s. The land–sea mask resolution is approximately 0.0083∘. Using this, the crossing of the shore can be determined within 3 to 12 s, depending on position (0.0083∘ longitude is less distance in the midlatitudes than it is in the tropics) and aircraft speed. After a review of the measurements, all time series stayed in this interval and are therefore deemed correct.
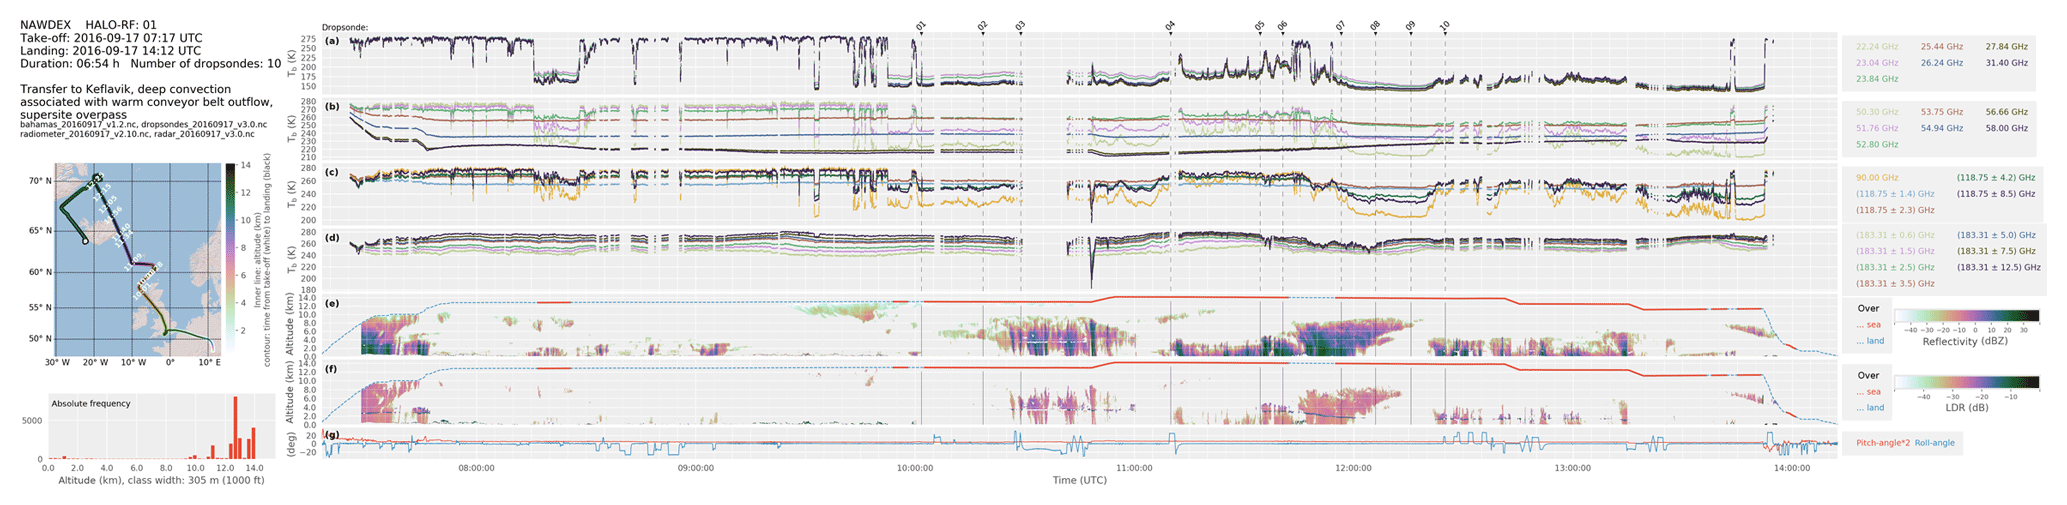
Figure 4Example of quick look of HAMP measurements that are available along with the data set in the CERA database. Left panel (top to bottom): flight information, flight track and altitude histogram. (a–d) (lines) Microwave radiometer brightness temperatures. (e) (colors) Cloud radar reflectivity. (f) (colors) Cloud radar linear depolarization ratio. (g) (lines) Aircraft attitude. Vertical lines in (a–g) denote times of dropsonde release.
5.6 Regridding
As mentioned in Sect. 3 and Table 5, the instruments have different sampling rates, and, in the case of radar and dropsondes, also different vertical resolutions. To create a self-contained data set where variables from different instruments are easily comparable in time and height, the data were transformed onto a uniform grid for each flight.
Radar measurements have additionally been corrected for aircraft attitude. After this correction, the vertical coordinate no longer corresponds to the range from an instrument but instead to height above the surface. This makes the vertical profiles of radar data from different flights comparable with each other. After that, all data were interpolated to the new grid with 30 m vertical and 1 s temporal resolution using the nearest-neighbor value. The resulting data set consists of radar data with 1 s temporal and 30 m vertical resolution, radiometer data with 1 s temporal resolution and dropsonde data with 30 m vertical resolution.
5.7 Filtering and gap filling
In addition to the quality control described in Sect. 5.2, spikes in dropsonde and BAHAMAS data were filtered out. Spikes in dropsonde profiles were identified if data between two measurements jumped by more than half of the data range of the entire profile. Spikes in BAHAMAS data were identified by eye. Data gaps in dropsonde profiles were interpolated if the gap was shorter than 10 s. With an average falling velocity of about 12 m s−1, this corresponds to roughly 120 m. BAHAMAS and radiometer time series were interpolated if the gap was not longer than 3000 s (BAHAMAS) and 30 s (radiometers), which at an average aircraft velocity of 200 m s−1 corresponds to 6000 and 6 km respectively. The reasoning behind these different thresholds is that BAHAMAS data fluctuate very little in the upper troposphere and lower stratosphere. Therefore, it is reasonable to interpolate longer intervals than for radiometer data. A flag was added to radiometer data indicating which values were interpolated.
The data for all flights described here have been submitted to the CERA database (https://cera-www.dkrz.de/WDCC/ui/cerasearch/, last access: 26 September 2018). The data have been released under Creative Commons Attribution-NonCommercial-ShareAlike 4.0 (CC BY-NC-SA 4.0). The data are saved as separate files for radiometer, radar and dropsonde measurements. Radiometer and radar data sets contain auxiliary data (aircraft location and attitude). Data from each flight are saved into individual files. The data format is NetCDF (version 4).
Along with the data, quick looks for all flights have been uploaded to the CERA database as auxiliary data. Figure 4 shows an example for one entire flight. These figures include time series of radar reflectivity, microwave radiometer brightness temperatures, aircraft attitude and the flight track and give a quick overview of the measurements from each flight.
The data are structured into four sets according to the four campaigns. Each set is associated with one digital object identifier: NARVAL-South (https://doi.org/10.1594/WDCC/HALO_measurements_2; Konow et al., 2018b), NARVAL-North (https://doi.org/10.1594/WDCC/HALO_measurements_1; Konow et al., 2018a), NARVAL2 (https://doi.org/10.1594/WDCC/HALO_measurements_3; Konow et al., 2018c) and NAWDEX (https://doi.org/10.1594/WDCC/HALO_measurements_4; Konow et al., 2018d).
The HALO Microwave Package (HAMP) was deployed on the German research aircraft HALO (High Altitude Long Range Research Aircraft) during four campaigns. The four campaigns took place between December 2013 and October 2016 out of Barbados and Iceland. Measured situations cover the dry and wet season over the tropical Atlantic and the cold and warm sector of midlatitude cyclones. HAMP comprises microwave radiometers with 26 channels in the range between 20 and 183 GHz and a 35 GHz cloud radar. In sum, measurements were recorded during 295 flight hours. The flights collected data over a variety of atmospheric conditions but similar enough conditions to ensure statistically representative samples. Measurements of cloud radar reflectivity and linear depolarization ratio at 35 GHz, radiometer brightness temperatures between 20 and 183 GHz, and dropsonde atmospheric profiles are provided in the data set described here. Quality control was performed to remove outliers and ensure temporal collocation of the instruments. The data have been regridded onto a uniform grid for easy combined analyses. The data set has been submitted to the CERA database (https://cera-www.dkrz.de/WDCC/ui/cerasearch/, https://doi.org/10.1594/WDCC/HALO_measurements_1, https://doi.org/10.1594/WDCC/HALO_measurements_2, https://doi.org/10.1594/WDCC/HALO_measurements_3, https://doi.org/10.1594/WDCC/HALO_measurements_4) for free access. This data set adds to the relatively sparse observations of maritime clouds in the tropics and midlatitudes. The data allow for analyses to gain insight into cloud properties and atmospheric state.
Further flights with HAMP will be performed in January 2020 as part of the EUREC4A campaign (Bony et al., 2017) and in March 2021 as part of the HALO-(AC)3 campaign.
FA, SC and BS were initiators of the HAMP project. LH, FJ, MH and MM carried out initial planning and installation of the HAMP instrument suite. FE, LH and MH recalibrated the radar reflectivity data. SC, MJ and MM derived the calibration for radiometer brightness temperatures. HK carried out quality control of the data, developed the unified data set of the different instruments, and wrote the paper with support and input from all coauthors.
The authors declare that they have no conflict of interest.
Thanks to the entire NAWDEX community for the great collaboration. Operating the HAMP instruments during four campaigns was a team effort. The authors would like to thank all additional operators who helped in calibrating and running the instruments during the campaigns: Stephan Bakan, Björn Brüggmann, Lisa Dirks, Akio Hansen, David Hellmann, Christian Klepp, Marcus Klingebiel and Emiliano Orlandi. Katharina Bayer is thanked for her great help in preparing the data for publication.
This work was supported by the German Research Foundation (Deutsche Forschungsgemeinschaft, DFG Priority Program SPP 1294) and by the Max Planck Society. The NAWDEX campaign was additionally funded within SFB/TRR165 Waves to Weather.
This paper was edited by Ge Peng and reviewed by John Bates and one anonymous referee.
Bony, S. and Stevens, B.: Measuring Area-Averaged Vertical Motions with Dropsondes, J. Atmos. Sci., 76, 767–783, https://doi.org/10.1175/jas-d-18-0141.1, 2019. a
Bony, S., Stevens, B., Frierson, D. M. W., Jakob, C., Kageyama, M., Pincus, R., Shepherd, T. G., Sherwood, S. C., Siebesma, A. P., Sobel, A. H., Watanabe, M., and Webb, M. J.: Clouds, circulation and climate sensitivity, Nat. Geosci., 8, 261–268, https://doi.org/10.1038/ngeo2398, 2015. a
Bony, S., Stevens, B., Ament, F., Bigorre, S., Chazette, P., Crewell, S., Delanoë, J., Emanuel, K., Farrell, D., Flamant, C., Gross, S., Hirsch, L., Karstensen, J., Mayer, B., Nuijens, L., Ruppert, J. H., Sandu, I., Siebesma, P., Speich, S., Szczap, F., Totems, J., Vogel, R., Wendisch, M., and Wirth, M.: EUREC4A: A Field Campaign to Elucidate the Couplings Between Clouds, Convection and Circulation, Surv. Geophys., 38, 1529–1568, https://doi.org/10.1007/s10712-017-9428-0, 2017. a
Busen, R.: Dropsondes and Radiosondes for Atmospheric Measurements, Springer Berlin Heidelberg, Berlin, Heidelberg, 317–329, https://doi.org/10.1007/978-3-642-30183-4_19, 2012. a
Elsaesser, G. S., O’Dell, C. W., Lebsock, M. D., Bennartz, R., Greenwald, T. J., and Wentz, F. J.: The Multisensor Advanced Climatology of Liquid Water Path (MAC-LWP), J. Climate, 30, 10193–10210, https://doi.org/10.1175/JCLI-D-16-0902.1, 2017. a
Ewald, F., Groß, S., Hagen, M., Hirsch, L., Delanoë, J., and Bauer-Pfundstein, M.: Calibration of a 35 GHz airborne cloud radar: lessons learned and intercomparisons with 94 GHz cloud radars, Atmos. Meas. Tech., 12, 1815–1839, https://doi.org/10.5194/amt-12-1815-2019, 2019. a, b, c
Hock, T. F. and Franklin, J. L.: The NCAR GPS dropwindesonde, B. Am. Meteorol. Soc., 80, 407–420, https://doi.org/10.1175/1520-0477(1999)080<0407:TNGD>2.0.CO;2, 1999. a
Houze, R. A., McMurdie, L. A., Petersen, W. A., Schwaller, M. R., Baccus, W., Lundquist, J. D., Mass, C. F., Nijssen, B., Rutledge, S. A., Hudak, D. R., Tanelli, S., Mace, G. G., Poellot, M. R., Lettenmaier, D. P., Zagrodnik, J. P., Rowe, A. K., DeHart, J. C., Madaus, L. E., Barnes, H. C., and Chandrasekar, V.: The Olympic Mountains Experiment (OLYMPEX), B. Am. Meteorol. Soc., 98, 2167–2188, https://doi.org/10.1175/BAMS-D-16-0182.1, 2017. a
Jacob, M., Ament, F., Gutleben, M., Konow, H., Mech, M., Wirth, M., and Crewell, S.: Investigating the liquid water path over the tropical Atlantic with synergistic airborne measurements, Atmos. Meas. Tech., 12, 3237–3254, https://doi.org/10.5194/amt-12-3237-2019, 2019. a, b, c, d
Klepp, C., Ament, F., Bakan, S., Hirsch, L., and Stevens, B.: NARVAL Campaign Report, Tech. rep., Max-Planck-Institut für Meteorologie, Hamburg, Germany, 2014. a, b, c
Konow, H., Jacob, M., Ament, F., Crewell, S., Ewald, F., Hagen, M., Hirsch, L., Jansen, F., Mech, M., and Stevens, B.: HALO Microwave Package measurements during Next-generation Remote sensing for VALidation Studies – North (NARVAL-North), World Data Center for Climate (WDCC) at DKRZ, https://doi.org/10.1594/WDCC/HALO_measurements_1, 2018a. a
Konow, H., Jacob, M., Ament, F., Crewell, S., Ewald, F., Hagen, M., Hirsch, L., Jansen, F., Mech, M., and Stevens, B.: HALO Microwave Package measurements during Next-generation Remote sensing for VALidation Studies – South (NARVAL-South), World Data Center for Climate (WDCC) at DKRZ, https://doi.org/10.1594/WDCC/HALO_measurements_2, 2018b. a
Konow, H., Jacob, M., Ament, F., Crewell, S., Ewald, F., Hagen, M., Hirsch, L., Jansen, F., Mech, M., and Stevens, B.: HALO Microwave Package measurements during Next-generation Remote sensing for VALidation Studies 2 (NARVAL2), World Data Center for Climate (WDCC) at DKRZ, https://doi.org/10.1594/WDCC/HALO_measurements_3, 2018c. a
Konow, H., Jacob, M., Ament, F., Crewell, S., Ewald, F., Hagen, M., Hirsch, L., Jansen, F., Mech, M., and Stevens, B.: HALO Microwave Package measurements during North Atlantic Waveguide and Downstream impact EXperiment (NAWDEX), World Data Center for Climate (WDCC) at DKRZ, https://doi.org/10.1594/WDCC/HALO_measurements_4, 2018d. a
Krautstrunk, M. and Giez, A.: The Transition From FALCON to HALO Era Airborne Atmospheric Research, Springer Berlin Heidelberg, Berlin, Heidelberg, 609–624, https://doi.org/10.1007/978-3-642-30183-4_37, 2012. a, b, c
Küchler, N., Turner, D. D., Löhnert, U., and Crewell, S.: Calibrating ground-based microwave radiometers: Uncertainty and drifts, Radio Sci., 51, 311–327, https://doi.org/10.1002/2015RS005826, 2016. a
Mech, M., Orlandi, E., Crewell, S., Ament, F., Hirsch, L., Hagen, M., Peters, G., and Stevens, B.: HAMP – the microwave package on the High Altitude and LOng range research aircraft (HALO), Atmos. Meas. Tech., 7, 4539–4553, https://doi.org/10.5194/amt-7-4539-2014, 2014. a, b, c, d, e, f, g
Oue, M., Kumjian, M. R., Lu, Y., Verlinde, J., Aydin, K., and Clothiaux, E. E.: Linear Depolarization Ratios of Columnar Ice Crystals in a Deep Precipitating System over the Arctic Observed by Zenith-Pointing Ka-Band Doppler Radar, J. Appl. Meteorol. Clim., 54, 1060–1068, https://doi.org/10.1175/JAMC-D-15-0012.1, 2015. a
Schäfler, A., Craig, G., Wernli, H., Arbogast, P., Doyle, J. D., McTaggart-Cowan, R., Methven, J., Rivière, G., Ament, F., Boettcher, M., Bramberger, M., Cazenave, Q., Cotton, R., Crewell, S., Delanoë, J., Dörnbrack, A., Ehrlich, A., Ewald, F., Fix, A., Grams, C. M., Gray, S. L., Grob, H., Groß, S., Hagen, M., Harvey, B., Hirsch, L., Jacob, M., Kölling, T., Konow, H., Lemmerz, C., Lux, O., Magnusson, L., Mayer, B., Mech, M., Moore, R., Pelon, J., Quinting, J., Rahm, S., Rapp, M., Rautenhaus, M., Reitebuch, O., Reynolds, C. A., Sodemann, H., Spengler, T., Vaughan, G., Wendisch, M., Wirth, M., Witschas, B., Wolf, K., and Zinner, T.: The North Atlantic Waveguide and Downstream Impact Experiment, B. Am. Meteorol. Soc., 99, 1607–1637, https://doi.org/10.1175/BAMS-D-17-0003.1, 2018. a, b
Schnitt, S., Orlandi, E., Mech, M., Ehrlich, A., and Crewell, S.: Characterization of Water Vapor and Clouds During the Next-Generation Aircraft Remote Sensing for Validation (NARVAL) South Studies, IEEE J. Sel. Top. Appl., 10, 3114–3124, https://doi.org/10.1109/JSTARS.2017.2687943, 2017. a, b
Sherwood, S. C., Bony, S., and Dufresne, J. L.: Spread in model climate sensitivity traced to atmospheric convective mixing, Nature, 505, 37–42, https://doi.org/10.1038/nature12829, 2014. a
Skofronick-Jackson, G. M., Johnson, B. T., and Munchak, S. J.: Detection Thresholds of Falling Snow From Satellite-Borne Active and Passive Sensors, IEEE T. Geosci. Remote, 51, 4177–4189, https://doi.org/10.1109/TGRS.2012.2227763, 2013. a, b
Stevens, B., Farrell, D., Hirsch, L., Jansen, F., Nuijens, L., Serikov, I., Brügmann, B., Forde, M., Linne, H., Lonitz, K., and Prospero, J. M.: The Barbados cloud observatory: Anchoring investigations of clouds and circulation on the edge of the itcz, B. Am. Meteorol. Soc., 97, 735–754, https://doi.org/10.1175/BAMS-D-14-00247.1, 2016. a, b
Stevens, B., Ament, F., Bony, S., Crewell, S., Ewald, F., Gross, S., Hansen, A., Hirsch, L., Jacob, M., Kölling, T., Konow, H., Mayer, B., Wendisch, M., Wirth, M., Wolf, K., Bakan, S., Bauer-Pfundstein, M., Brueck, M., Delanoë, J., Ehrlich, A., Farrell, D., Forde, M., Gödde, F., Grob, H., Hagen, M., Jäkel, E., Jansen, F., Klepp, C., Klingebiel, M., Mech, M., Peters, G., Rapp, M., Wing, A. A., and Zinner, T.: A high-altitude long-range aircraft configured as a cloud observatory–the NARVAL expeditions, B. Am. Meteorol. Soc., 100, 1061–1077, https://doi.org/10.1175/BAMS-D-18-0198.1, 2019. a, b
Vaisala: Vaisala dropsonde RD94, Tech. rep., Vaisala Oyj, available at: https://www.vaisala.com/sites/default/files/documents/RD94-Datasheet-B210936EN-B.pdf (last access: 24 May 2019), 2017. a
Wang, J., Young, K., Hock, T., Lauritsen, D., Behringer, D., Black, M., Black, P. G., Franklin, J., Halverson, J., Molinari, J., Nguyen, L., Reale, T., Smith, J., Sun, B., Wang, Q., and Zhang, J. A.: A long-term, high-quality, high-vertical-resolution GPS Dropsonde dataset for hurricane and other studies, B. Am. Meteorol. Soc., 96, 961–973, https://doi.org/10.1175/BAMS-D-13-00203.1, 2015. a
Wendisch, M., Poschl, U., Andreae, M. O., MacHado, L. A., Albrecht, R., Schlager, H., Rosenfeld, D., Martin, S. T., Abdelmonem, A., Afchine, A., Araujo, A. C., Artaxo, P., Aufmhoff, H., Barbosa, H. M., Borrmann, S., Braga, R., Buchholz, B., Cecchini, M. A., Costa, A., Curtius, J., Dollner, M., Dorf, M., Dreiling, V., Ebert, V., Ehrlich, A., Ewald, F., Fisch, G., Fix, A., Frank, F., Futterer, D., Heckl, C., Heidelberg, F., Huneke, T., Jakel, E., Jarvinen, E., Jurkat, T., Kanter, S., Kastner, U., Kenntner, M., Kesselmeier, J., Klimach, T., Knecht, M., Kohl, R., Kolling, T., Kramer, M., Kruger, M., Krisna, T. C., Lavric, J. V., Longo, K., Mahnke, C., Manzi, A. O., Mayer, B., Mertes, S., Minikin, A., Molleker, S., Munch, S., Nillius, B., Pfeilsticker, K., Pohlker, C., Roiger, A., Rose, D., Rosenow, D., Sauer, D., Schnaiter, M., Schneider, J., Schulz, C., De Souza, R. A., Spanu, A., Stock, P., Vila, D., Voigt, C., Walser, A., Walter, D., Weigel, R., Weinzierl, B., Werner, F., Yamasoe, M. A., Ziereis, H., Zinner, T., and Zoger, M.: Acridicon-chuva campaign: Studying tropical deep convective clouds and precipitation over Amazonia using the New German research aircraft HALO, B. Am. Meteorol. Soc., 97, 1885–1908, https://doi.org/10.1175/BAMS-D-14-00255.1, 2016. a, b