the Creative Commons Attribution 4.0 License.
the Creative Commons Attribution 4.0 License.
 | 20 May 2020
Spatio-temporal assessment of the polychlorinated biphenyl (PCB) sediment contamination in four major French river corridors (1945–2018)
André-Marie Dendievel
Alexandra Coynel
Olivier Evrard
Pierre Labadie
Sophie Ayrault
Maxime Debret
Florence Koltalo
Yoann Copard
Quentin Faivre
Thomas Gardes
Sophia Vauclin
Hélène Budzinski
Cécile Grosbois
Thierry Winiarski
Marc Desmet
Environmental pollution by polychlorinated biphenyls (PCBs) is a key cause for concern about river quality because of their low degradation rates leading to their accumulation in sediments and living organisms. An original interdisciplinary work was conducted along the four main French rivers (Seine, Rhône, Loire and Garonne rivers), which flow into major European seas. We completed a dataset based on sediment analyses provided by monitoring agencies, port authorities and research teams on different solid matrices (sediment cores, bed and flood deposits, suspended particulate matter and dredged sediments). This dataset focused on the seven indicator PCBs and their sum (ΣPCBi) from 1945 to 2018 (nΣPCBi =1416). Special effort was put into the quality control to provide robust spatio-temporal information. Taking into account hydrological and human drivers, we outlined two main pollution trends: (1) from 1945 to 1975, a quick increase in ΣPCBi (up to 4 mg kg−1 dry weight, dw) and a sharp decrease in the 1980s on the Seine and Loire rivers and (2) increasing but moderate ΣPCBi levels (50 to 150 µg kg−1 dw) followed by a decline after the 1990s on the Rhône and Garonne rivers. In addition to these patterns, PCB emissions from urban and industrial areas or accidental events were significant in each river. Finally, when calculating specific flux, the Rhône exhibited the uppermost ΣPCBi load (up to 12 in 1977–1987), at least 25 % higher than those of the Seine and Loire rivers, while the Garonne showed a very low flux. In western Europe, we confirmed that the Rhône, Seine and Loire rivers contribute significantly to the PCB contamination of the seas, while French specific ΣPCBi fluxes are 2 orders of magnitude lower than those found in American or Asian rivers. The dataset is available at https://doi.org/10.1594/PANGAEA.904277 (Dendievel et al., 2019).
- Article
(6134 KB) -
Supplement
(3353 KB) - BibTeX
- EndNote


The environmental pollution of river sediments due to polychlorinated biphenyls (PCBs) became a concern as early as in the 1970s (Dennis, 1976; Müller, 1986). Indeed, PCBs were widely used as heat transfer fluids and insulating fluids for transformers and capacitors, and they had been utilised as wood, paper, plastic or ink additive since 1930 worldwide (Breivik et al., 2002a; De Voogt and Brinkman, 1997). Due to their high toxicity and their long persistence in the environment, the use of PCBs was banned in the USA (Toxic Substances Control Act of 1976) as well as in the Organisation for Economic Co-operation and Development (OECD) member countries. In France, the use of PCBs was progressively restricted to closed systems, i.e. capacitors and transformers, by the order of 8 July 1975. Then, it was prohibited by decree in 1987 (no. 87-59). Old devices using PCBs are currently being dismantled after European guidelines (national decrees 2001-63 and 2013-301). To support these provisions, a global survey of PCBs in surface waters, sediments, fishes and bryophytes started in the 1990s in France on behalf of the Survey and Control Network (RCS), jointly managed by the Water Agencies (WAs) and the Regional Directorate for Environment, Development and Housing (DREAL). In charge of the local sampling and analyses, the WAs focused on seven PCB congeners (PCB-28, PCB-52, PCB-101, PCB-118, PCB-138, PCB-153, PCB-180) and their sum, referred to as ΣPCBi in the remainder of the text. These PCB indicators are generally found in high concentrations in the environment (e.g. sediment and biota), as well as in human food (IARC, 2016). Such provisions, taken at the worldwide scale, have led to a significant reduction in the quantity of PCBs found in the environment (Breivik et al., 2007; Wania and Su, 2004).
However, PCBs stored in the atmosphere, in soils and in hydrosystems still remain a major issue as revealed by recent studies on marine mammals and ice sheet contamination (Desforges et al., 2018; Hauptmann et al., 2017). Moreover, high PCB levels found in estuarine and riverine fauna – mussels, oysters, eels or fishes – are directly attributed to upstream sediment contamination (Blanchet-Letrouvé et al., 2014; Olenycz et al., 2015). In Europe and around the Mediterranean Basin, several studies have focused on both sediment and biota concentrations in order to assess the relationships between particle pollution and accumulation in zooplankton, key invertebrates or bivalves, and fishes (Adda, Italy, Bettinetti et al., 2016; Seine, France, Chevreuil et al., 2009; Rhône, France, Lopes et al., 2012; Thames, UK, Lu et al., 2017; Elbe, Germany, Schäfer et al., 2015; Nile, Egypt, Yahia and Elsharkawy, 2014). Nevertheless, in most of these cases, understanding the PCB contamination transfer remains complex. Indeed, PCBs are stored in sediments from oxbow lakes, dams, soils and dumping areas along rivers and coasts. This contaminated material is known to move through the system as suspended particulate matter (SPM) and could be submitted to successive deposition and remobilisation stages (floods, flushing, tidal effect, etc.). Diverse regulatory assessment and quality scales across countries (sampling frequencies and stations, analytical methods, limits of quantification, studied PCB congeners) complicate the estimation of PCB stocks in rivers at global scales. As for other pollutants, a more integrative research framework combining long-term data (i.e. sediment cores) and continuous or frequent monitoring of the various reservoirs (solid fraction, waters and biota), is needed to capture the spatial and temporal variability in the contamination by PCBs and to identify the drivers of this variability (Meybeck et al., 2018).
The current research aims to compare PCB contamination in sediments along four major rivers with hydrological and human drivers over the period 1945–2018. In order to evaluate the magnitude of the PCB flux transiting from the rivers to the seas at a nationwide scale, we focused on the French rivers that flow into several major seas of the Northern Hemisphere (Loire and Garonne rivers into the Atlantic Ocean; Rhône into the Mediterranean Sea; Seine into the English Channel). These rivers are also known to have been strongly modified by anthropogenic activities since the 19th century to facilitate fluvial transport and, later on, for hydroelectricity and nuclear power purposes through the construction of dams, weirs and diversion canals (Tricart and Bravard, 1991; Parrot, 2015; Lestel et al., 2019). The occurrence of lateral structures narrowing and straightening the river stems (embankments on the Garonne, Lalanne-Berdouticq, 1989; dikes and épis de Loire on the Loire, Barraud et al., 2013; Girardon structures on the Rhône, Tricart and Bravard, 1991; etc.) also induced the storage of fine sediments with variable contents of organic pollutants in the floodplains (Vauclin et al., 2019).
To intercompare pollution trends between rivers while taking into account data heterogeneity, we compiled a dataset focusing on the sum of the seven indicator PCBs (ΣPCBi = PCB-28 + PCB-52 + PCB-101 + PCB-118 + PCB-138 + PCB-153 + PCB-180). ΣPCBi data were acquired on sediment cores, fresh bed and flood sediments and SPM, or during dredging operation on the French rivers (Dendievel et al., 2019). We controlled data quality and spatio-temporal coverage to support our interpretation of the dataset and to maximise its robustness. This research also investigated how spatio-temporal contamination trends may be related to population, riverside land use (urban and industrial areas) and accidental PCB releases along each river. Finally, specific fluxes in ΣPCBi ( ) were calculated in kilometres upstream of estuarine areas (km UEA). The results were compared to worldwide data in order to propose an integrative estimation of the mass contribution of the main French rivers to the global PCB pollution transferred to the neighbouring seas.
2.1 Data collection on the studied rivers
Sediment contamination was assessed by collecting PCBi analysis results and associated ancillary data (total organic carbon content, grain size) at gauging stations located on the main stream and monitored for regulatory or scientific purposes. Significant effort was made to collect high-quality information from multiple sources (harbour and navigation authorities, WAs, DREAL, public research labs, etc.) at a national scale for the 1945–2018 period (initial total number of samples ∼2300). The data came from four main sediment matrices:
-
Bed and flood sediments are assumed to be deposited sediments (monitoring by DREAL, WAs and ROCCHSED programme of the IFREMER – French Institute for Ocean Science). Sampling has been performed by field operators since 1991–1995 at 135 stations distributed along the main rivers (see Fig. 1 and Supplement, Table S1). Sampling frequencies ranged from once or twice a year to a unique sample in 30 years. All data – including sampling locations, dates, results and techniques if mentioned – were aggregated from three open databases and checked to avoid potential duplicates. The databases are (a) Naïades, supplied by the WAs (http://www.naiades.eaufrance.fr; last access: 15 October 2018); (b) the National Actions Plan on PCB (http://www.pollutions.eaufrance.fr/pcb/resultats.html; last access: 15 January 2019); and (c) Surval, powered by the IFREMER (https://wwz.ifremer.fr/surval; last access: 15 January 2019). Academic studies on flood deposits were also included (e.g. Lauzent, 2017).
-
Suspended particulate matter (SPM) is considered as mobile sediments. SPM concentrations have been monitored in the Rhône by the OSR (Rhône Sediment Observatory) since 2011 at two stations, Jons and Arles, which are located upstream of Lyon and just upstream of the delta, respectively (https://bdoh.irstea.fr/OBSERVATOIRE-DES-SEDIMENTS-DU-RHONE/; last access: 12 May 2020). DREAL and the WAs have been in charge of the SPM monitoring since 1993 on the Garonne (the three stations are upstream at Verdun-sur-Garonne, in the middle section before the Lot confluence and downstream at Cadillac) and on the Loire (the four stations are upstream at Veauchette and downstream at La Possonnière, Montjean and Sainte-Luce). We did not include SPM data from the Seine because results were available only for bulk water (g L−1) rather than for sediment. SPM was measured monthly to quarterly, sometimes bimonthly, on the studied rivers.
-
Mobile dredged sediments were collected and analysed by harbour and navigation authorities. ΣPCBi data were provided by the Port of Rouen for the lower and estuarine sections of the Seine, with five stations having been monitored since 1992, and by the CNR (Rhône National Company) on the Rhône with 81 sampling locations, mostly distributed next to hydraulic infrastructures or at river confluences.
-
Sediment cores deposited in reservoirs, oxbow lakes or channel banks were extracted by research teams of the INTERPOL consortium. Among French rivers, the Rhône was intensively investigated with 13 cores analysed for PCB contents along the river (Fig. 1). These studies provided vertical profiles of historical contamination on each river section since at least 1945 (Desmet et al., 2012; Mourier et al., 2014). On the other rivers, most analyses focused on lower sections to estimate the pollution trends at the river mouth. Three cores were extracted downstream of Paris on the Seine, providing records since 1945 (Boust et al., 2012; Lorgeoux et al., 2016; Vrel et al., 2013); one core was extracted from the Garonne, downstream of Bordeaux, dating back to 1954 (Hélène Budzinski, Pierre Labadie and Alexandra Coynel, personal communication, 2019; Morelli et al., 2016; Adapt'eau project); and one core was extracted from the Loire, near Nantes (Desmet, personal communication; Metorg project) covering the period since the late 1970s. On the Loire, a second core was analysed for persistent organic pollutants downstream of the industrial basin of Saint-Étienne (Fig. 1; Bertrand et al., 2015; Cécile Grosbois, personal communication, 2018; Metorg project).
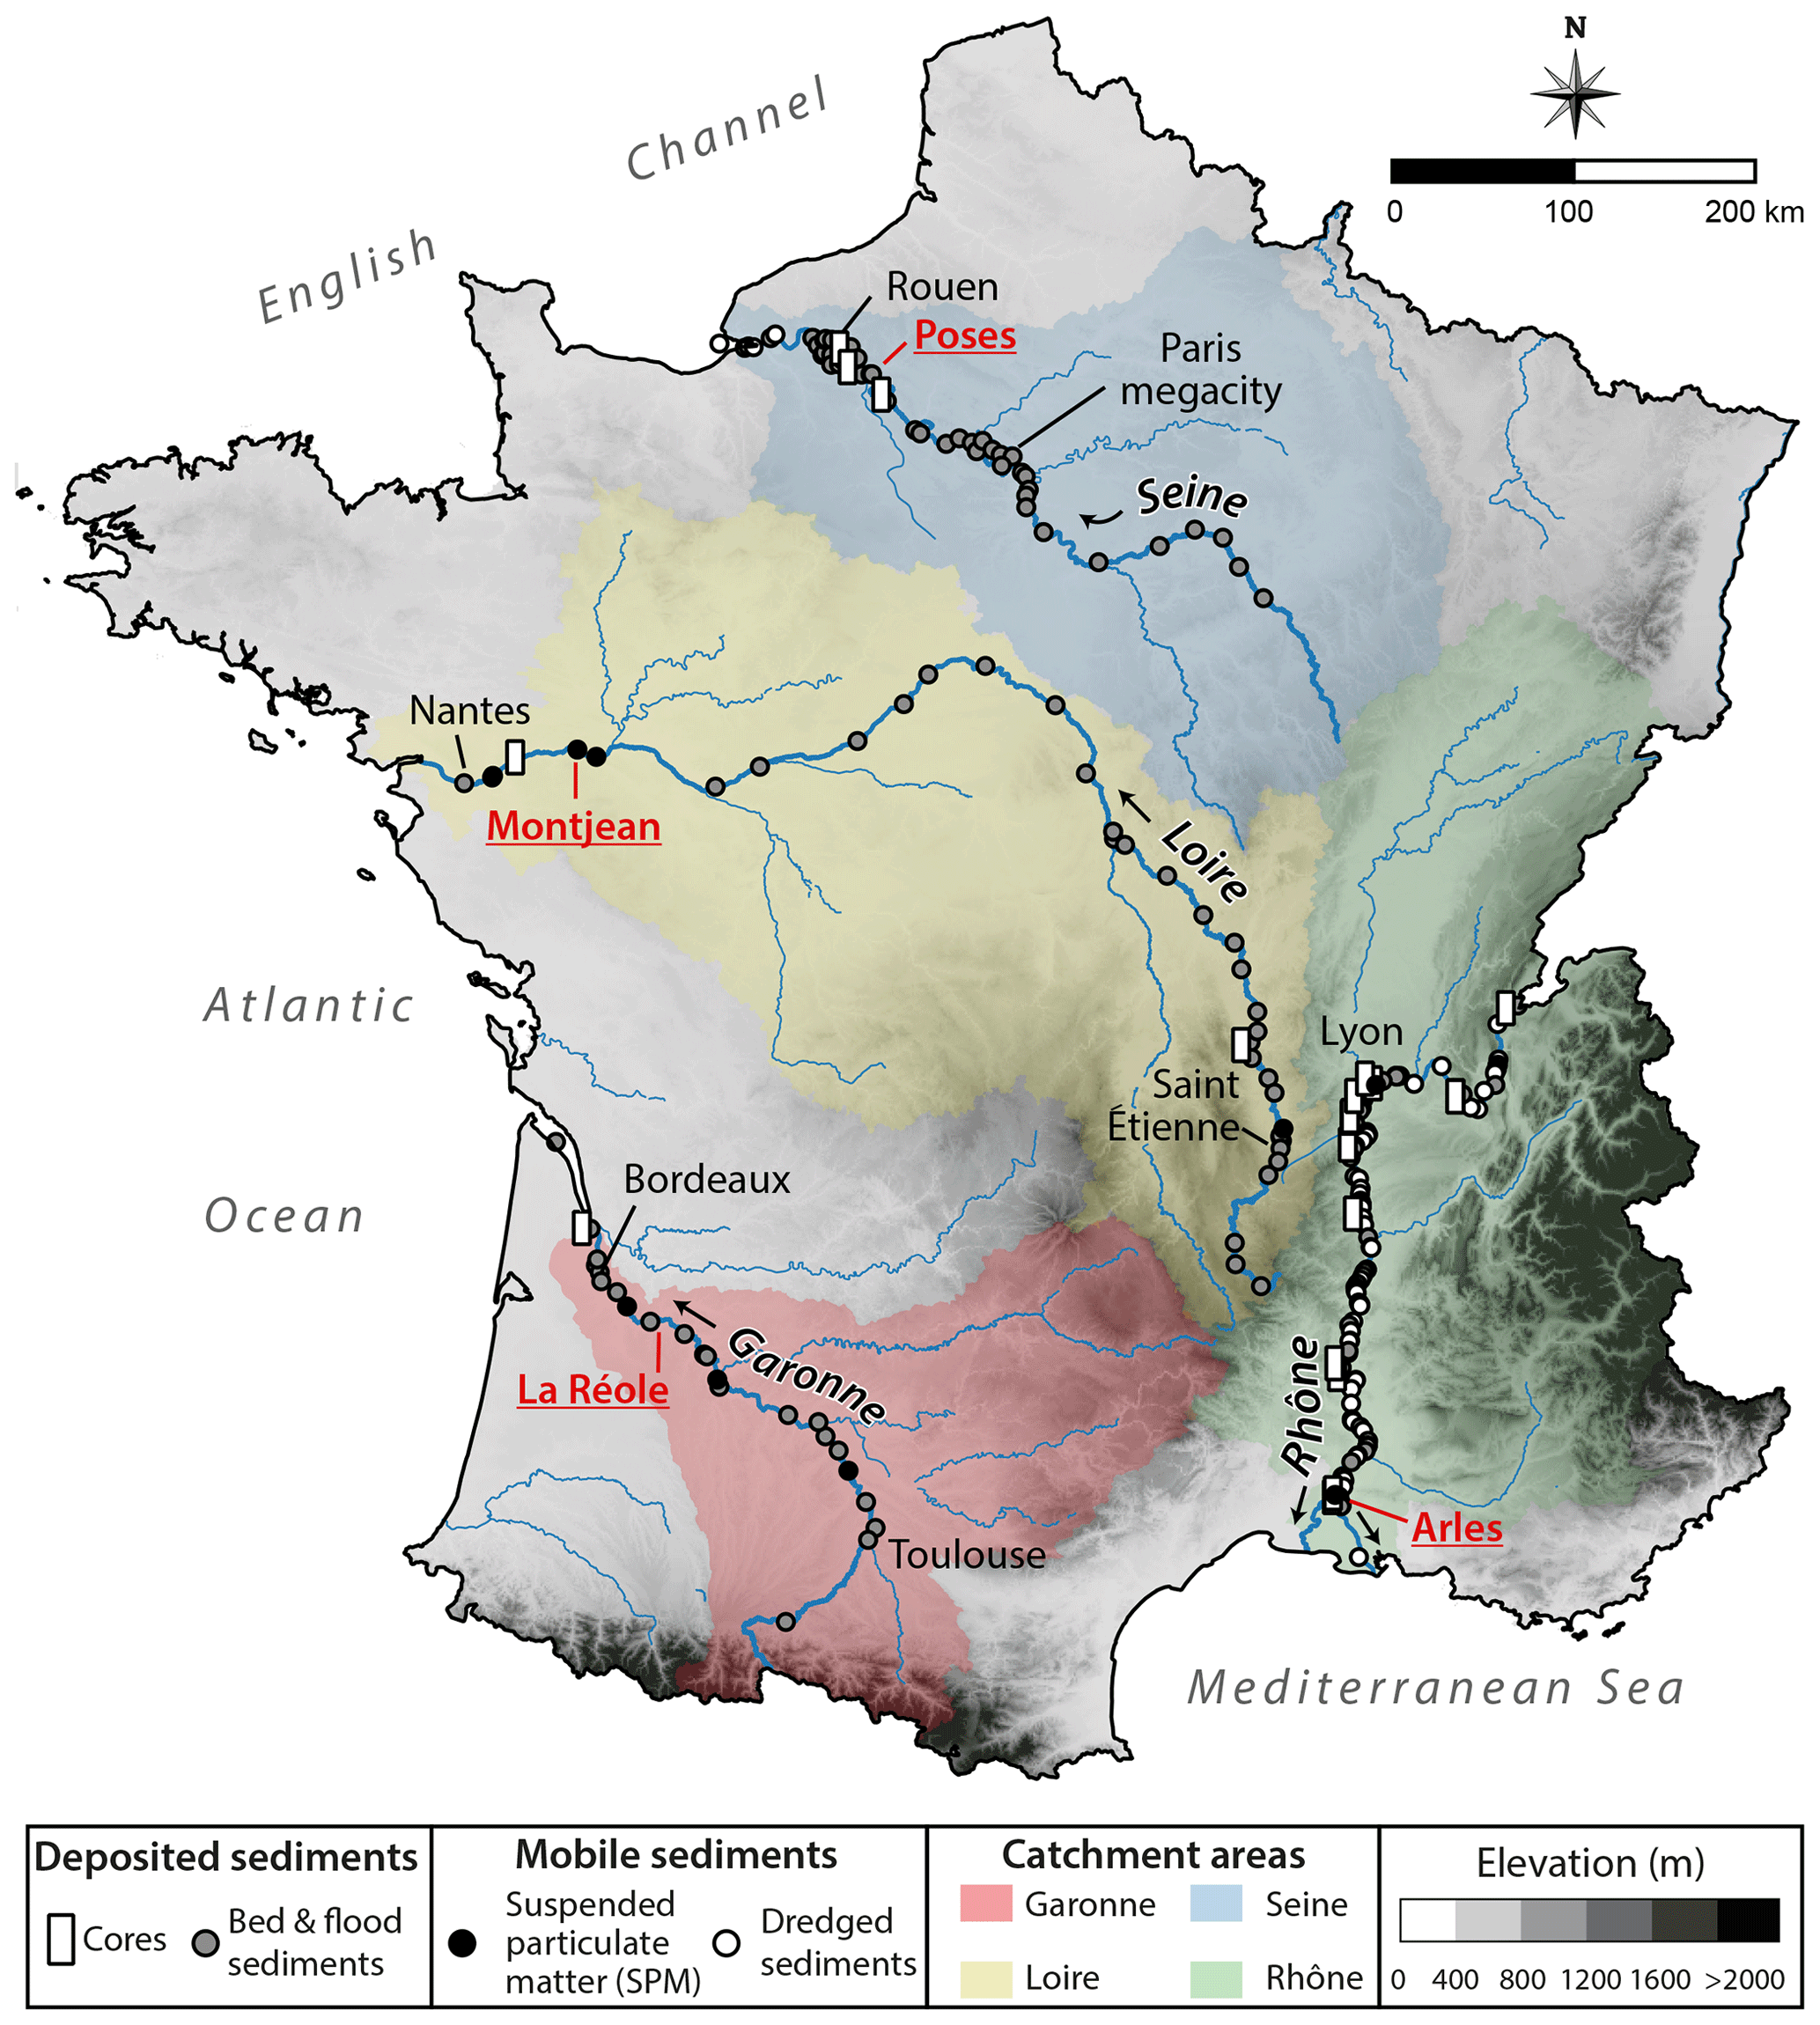
Figure 1Location of sampling stations along the four main French rivers (Garonne, Loire, Rhône, Seine). Main cities are denoted in black, whereas locations mentioned in red and underlined correspond to the four stations where specific flux was estimated.
2.2 Analysis and quality control
PCB-congener analyses in riverine sediments were performed according to several methods depending on stakeholders and research laboratories. They generally followed several steps. (1) Sampling was achieved by using Ekman grabs for bed and flood deposits, fluvial decanters for SPM, and hydraulic excavators for dredging. Cores at onshore and immersed sites were collected with percussion or piston corers (Cobra TT and UWITEC devices, respectively). Then, the samples were extracted in the laboratory and freeze-dried for conservation. Sieving was conducted when coarse sediment was collected (sieving to 2 mm or 63 µm). (2) According to our review, the extraction was usually achieved with a Soxhlet extractor or microwave-assisted before (3) a purification via adsorption chromatography with sorbents such as silica, aluminium oxide, Florisil and activated carbon. (4) PCBs congeners were quantified by gas chromatography coupled with mass spectrometry (GC–MS) in selected ion monitoring (SIM) mode (for details, please refer to the related papers and sources cited in Table 1).
Table 1Sources and quality of the data. Sediment matrices are divided into deposited sediments (cores and bed and flood deposits) and mobile particles (SPM and dredged sediments). PCBi analyses (initial) represent the number of analyses initially collected from monitoring data, whereas 7 PCBi > LOQ and Imputed ΣPCBi represent only the data discussed in this article. The number of sites corresponds to the sites where validated analyses (i.e. 7 PCBi > LOQ or imputed ΣPCBi) are available. WA denotes water agency.

The quality control of monitoring data was one of the major challenges given the heterogeneity of data collected. Indeed, PCB results from bed and flood deposits, SPM, and dredged sediment included frequent undetected values, outliers, and variable limits of detection (LODs) or limits of quantification (LOQs). The LOQ for each PCB congener ranged from 0.01 to 20 µg kg−1 dw (the highest LOQ observed among all congeners), depending on the analytical methods at the time of the analysis. For instance, a high LOQ of 20 µg kg−1 dw for each PCB congener was used for samples collected from the Garonne over the 1994–2006 period. In addition, the low-chlorinated compounds (PCB-LC; PCB-28, PCB-52, PCB-101 and PCB-118) were rarely detected due to a higher LOQ or lower concentrations. The highly chlorinated PCB congeners (PCB-HC; PCB-138, PCB-153 and PCB-180) were quantified at higher frequencies.
To process the original dataset (more than 12 700 analyses on ca. 2300 samples), we considered two cases: (1) we integrated the results with all seven PCB congeners > LOQ and (2), when only PCB-HC were quantified, a reconstruction was performed. For the latter, we estimated the ΣPCBi of each sample by using the original PCB-HC values and relating it to the average percentage of PCB-HC in samples for which all PCB congeners were quantified from the same river and time. Such an imputation-based method is more efficient than arbitrary substitution (e.g. half of the LOQ), especially when undetected data dominate (Baccarelli et al., 2005; Helsel, 2006), which is a common case on the Loire and Garonne rivers. For this correction, ΣPCBi was calculated according to the following Eq. (1):
where ΣPCB–HC is the sum of high-chlorinated PCB congeners measured in the sample (PCB-HC), i.e. PCB-138 + PCB-153 + PCB-180 (µg kg−1 dw), and MP PCB-HC is the mean percentage of the three PCB-HC in well-quantified samples on each river (i.e. MP PCB-HC %; MP PCB-HC %; MP PCB-HC %; MP PCB-HC %).
As shown in Table 1, this step increased the proportion of validated monitoring data from 6 % to ca. 18 % for the Garonne (48 samples), from 21 % to 36 % for the Loire (147 samples), from 32 % to 44 % for the Rhône (294 samples) and from 58 % to 76 % for the Seine (343 samples). Table 1 also presents total organic carbon (TOC) and fine-fraction content (percentage of clays and silts) in sediment. These additional data could not be used for normalisation because they were not systematically available for each sediment matrix or sample and also because each basin has specific geochemical background signatures.
2.3 River system characterisation
River profiles, catchment surfaces, population in the drainage area and distances in kilometres upstream of estuarine areas (km UEA) were collected by using geographic information system (GIS) data, as well as IGN (French National Institute of Geographic and Forest Information) tools and services: Géoportail (https://www.geoportail.gouv.fr; last access: 30 November 2018), BD ALTI®, GEOFLA® and BD Carthage® (http://professionnels.ign.fr; last access: 30 November 2018). The annual average of water discharges (m3 s−1) along each river was computed according to the national databank of hydrological information (Banque Hydro; http://www.hydro.eaufrance.fr; last access: 19 May 2019). Other characteristics were collected from the European CORINE Land Cover inventory (2012) for urban and industrial areas (v.20b2; https://land.copernicus.eu/pan-european/corine-land-cover; last access: 19 May 2019), from BASOL (https://basol.developpement-durable.gouv.fr/home.htm; last access: 11 February 2019) and BASIAS (http://www.georisques.gouv.fr/dossiers/basias/donnees{#}/; last access: 4 May 2019) databases for the location of the sites where PCB pollution was referenced after accidental spillage or after the deposit of contaminated sludge. The QGIS software (v.2.18.28) was used to merge and intersect all the data in a buffer zone of 1 km on both sides of each river.
2.4 Time series analysis and specific flux
The 1416 validated ΣPCBi data points (Dendievel et al., 2019) were analysed as a whole and as representative of temporal trends since 1945 in R (v3.5.1, R Core Team, 2018) with the package ggplot2 (v.3.1.1, Wickham et al., 2019). We used general additive models (GAMs) within the stat_smooth function to draw robust non-parametric models, little influenced by outliers and not truncated at the end. The basis dimension k was adjusted by using the gam.check function, available in the mgcv package (Wood, 2019). Chronological control was based on the date of sampling for regulatory monitoring data (bed and flood sediments, dredging and SPM) and on published chronological models for core data (e.g. Desmet et al., 2012; Lorgeoux et al., 2016; Mourier et al., 2014).
For the calculation of specific ΣPCBi flux, we estimated sediment flux according to water discharge (m3 s−1; available at http://www.hydro.eaufrance.fr, last access: 14 January 2020) and reconstructed SPM concentrations using rating curves (relationships between water discharge and measured SPM concentrations). Specific rating curves were used for each river according to the existing literature and based on previously published data (Garonne – Coynel et al., 2004; Loire – Moatar and Dupont, 2016; Rhône – Poulier et al., 2019; Seine – GIP Seine Aval, 2008). This calculation was achieved at the gauging stations located just upstream of tidal influence zones (see locations in Fig. 1). The timescale was based on the monitoring network chronicles and divided into four periods according to the data available: 1977–1987, 1987–1997, 1997–2007 and 2007–2017. Then, we used the average ΣPCBi concentration (cores and monitored sediments) from each lower river section during these periods to calculate the yearly ΣPCBi load (t yr−1). Finally, in order to compare with the international literature, we normalised this load to the drainage area at each gauging station to obtain the specific flux in ΣPCBi ().
3.1 Comparability of the results from different sediment matrices
The ΣPCBi distributions in each solid matrix were distinguished into two groups characterised by different hydro-sedimentary settings: (1) “deposited sediments” including bed or flood deposits and core sediments and (2) “mobile particles” including SPM and dredged sediments. ΣPCBi distributions between both groups in each river were tested (for details see Supplement, Fig. S1). For the Rhône, this comparison was achieved at the scale of the whole river during the period 2011–2018 because mobile particles were only available after 2011. In a similar way, we tested the distribution of ΣPCBi data from deposited and mobile sediments on the estuarine Seine (lower 50 km) and on the upper Loire (1012 to 750 km) since 1992 and 1991, respectively, because analyses on mobile sediments were available earlier (see Supplement, Fig. S1). Regarding the Garonne, we compiled all the available data since 1954 on the lower section (last 100 km). Wilcoxon tests demonstrated that the ΣPCBi distributions were not significantly different between the two groups (p>0.1) and could therefore be suitable to supporting the discussion of the spatio-temporal contamination trends.
3.2 River and environmental settings
Physical settings and river modifications for navigation, flood control and electricity production could be considered as key factors influencing the sedimentation and the transport of polluted sediment. Accordingly, the studied rivers were divided into two groups based on the degree of water engineering disturbances and on flow rate trends (Table 2).
Table 2River characteristics. Lengths are given following the Sandre baseline datasets (http://id.eaufrance.fr/, last access: 12 December 2019). The water engineering column refers to groups defined in the text. SPM – suspended particulate matter – discharges were based on existing literature (Copard et al., 2018; Coynel et al., 2004; GIP Seine Aval, 2008; Moatar and Dupont, 2016; Poulier et al., 2019).

a For the Rhône, the length is representative of its French course. b Watershed surfaces are given upstream of the gauging stations where specific flux was estimated.
The first group is characterised by step-like longitudinal profiles due to heavy engineering caused by the installation of multiple hydroelectric plants and dams, changing the natural geomorphologic dynamics. It comprises the Seine and the Rhône rivers.
The Seine valley is adapted for fluvial transport from and to Paris. It is equipped with 23 small dams and weirs currently managed by the Seine Navigation Service. The main hydraulic structure between Paris and Rouen is the Poses dam, which regulates the stream and stops tidal waters. Major tributaries flow into the Seine halfway between the source and the estuary, in urban areas around Paris megacity. The junction with the Yonne, Marne and Oise rivers occurs in this area (Fig. 2a to c). On the lower Seine, the Eure is the main tributary (annual discharge Q=26 m3 s−1). At the estuary, the Seine has a current discharge of ca. 600 m3 s−1 (Supplement, Table S2).
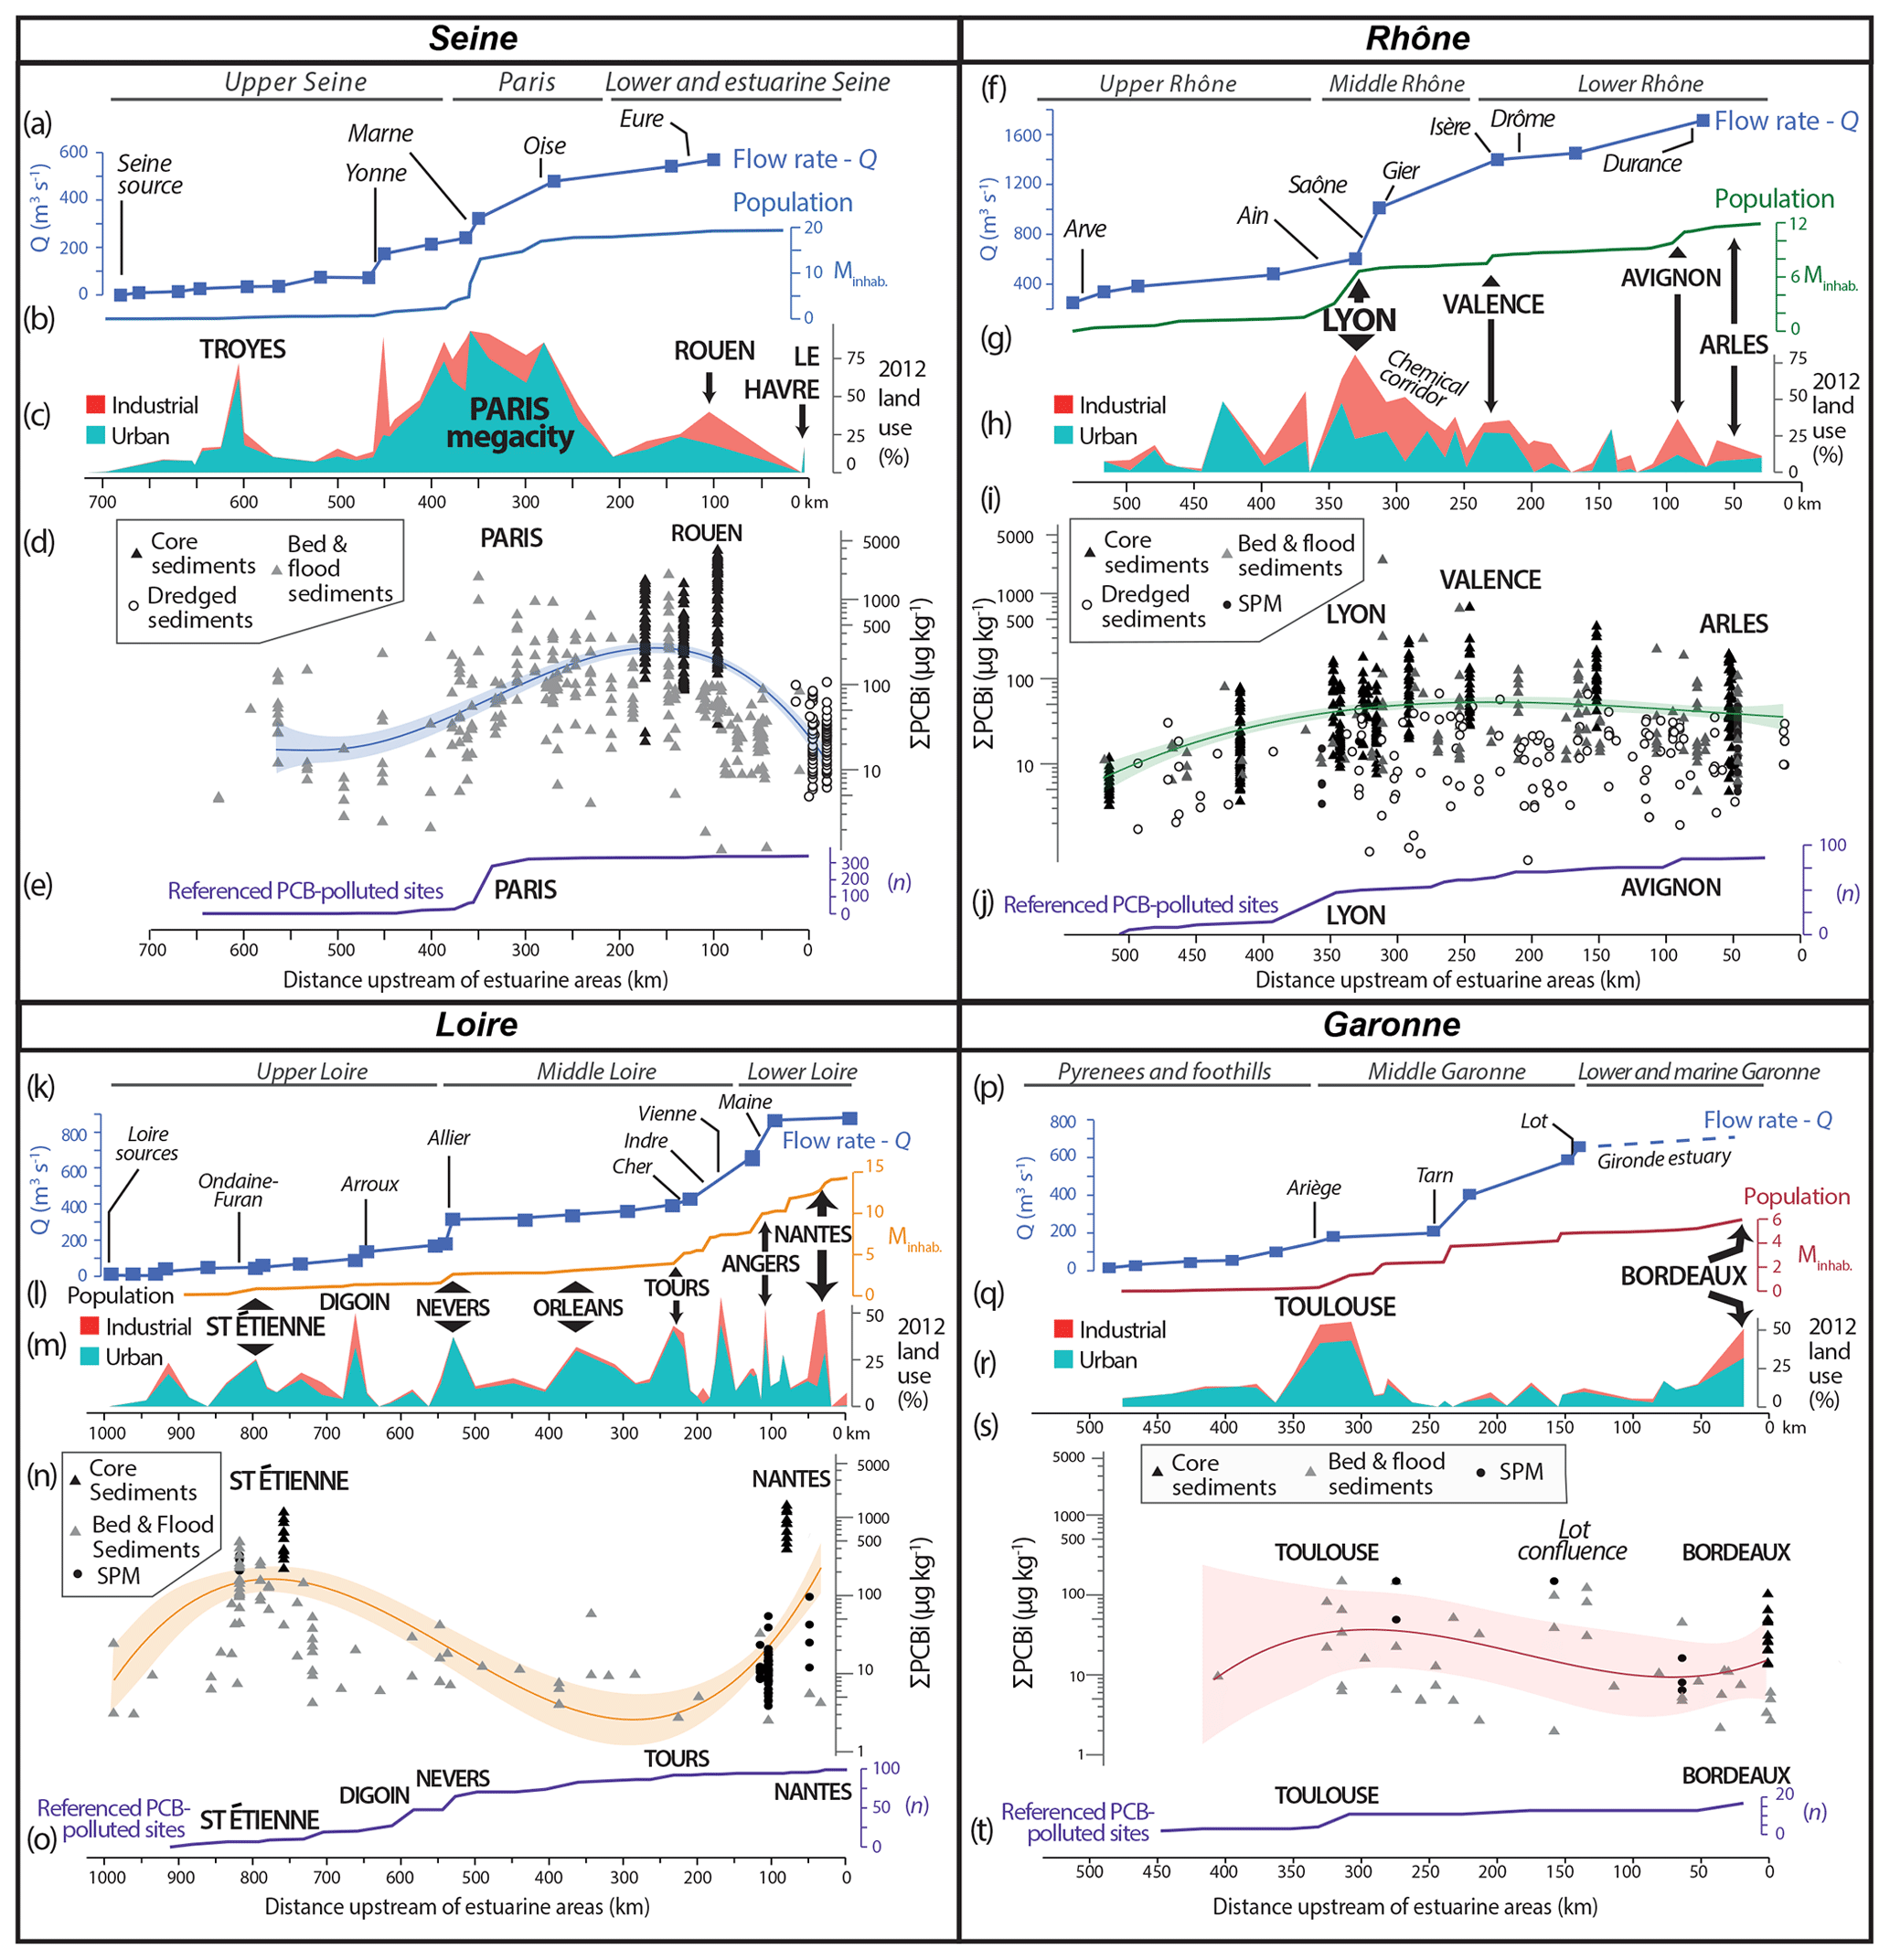
Figure 2Main physical and socio-environmental information computed along each river corridor: (a–e) Seine, (f–j) Rhône, (k–o) Loire and (p–t) Garonne. River discharges and their main tributaries are plotted in (a), (f), (k) and (p). Cumulative population in the watershed (expressed in millions of inhabitants – Minhab.) is represented in (b), (g), (l) and (q). The main urban and industrial areas within 1 km of the riverbed are shown with stacked area charts in (c), (h), (m) and (r). ΣPCBi in solid matrices are plotted all together according to a GAM to represent the spatial variability in the PCB stocks during the period 1945–2018 (d, i, n and s). PCB-polluted sites referenced by the BASIAS and BASOL databases are represented by a curve cumulating the number of sites in the downstream direction (e, j, o and t). The distance scale is expressed in kilometres upstream of estuarine areas (km UEA).
The Rhône corridor has also been substantially modified for navigation purposes and hydroelectricity production. Several hundreds of Girardon infrastructures (dykes and groynes systems) were built to reduce the stream width, and secondary channels were partly disconnected. Nowadays, 19 dams are managed by the CNR. The upper Rhône is mainly supplied by Alpine rivers. The other main tributaries come in the medium and lower sections, in densely urbanised areas including Lyon at the Saône confluence (Q=410 m3 s−1) and Valence and Avignon at the Isère and Durance confluences, respectively (Q=333 and 180 m3 s−1). At the mouth (Rhône delta), the water flux culminates at ca. 1700 m3 s−1 with a high solid transport of 4–8 Mt of sediments each year (Fig. 2f).
The second group is composed of the Garonne and Loire rivers which could be considered as less structure-impacted than those of the first group, although they are not devoid of hydraulic structures.
The Loire is the longest French river (1012 km) and one of the main rivers flowing into the Atlantic Ocean (Bay of Biscay) in western Europe. Its main stem is equipped with three major dams at La Palisse, Grangent and Villerest, which are managed for hydroelectricity and flood protection. Other significant hydraulic infrastructures are located in the middle and lower Loire stretches (weirs, groynes, embankments and small reservoirs for navigation and nuclear plant management). Major confluences delineate each fluvial section: the Allier (Q=140 m3 s−1) is the downstream boundary of the upper Loire, while the Cher, Vienne and Maine rivers are at the transition between the middle and lower Loire sections (Q=104, 203 and 127 m3 s−1, respectively). The water flux reaches ca. 870 m3 s−1 in the lower section (Fig. 2k).
The Garonne is equipped with high dams on its upper section (Pyrenees foothills), while only one section bypasses the main stream on the middle Garonne, near the Golfech nuclear power plant. Water flux increases due to the contribution of successive tributaries from upstream (Ariège) to downstream (Tarn and Lot rivers; Fig. 2p). In the lower Garonne, associated dikes and groynes channel the river, which has a discharge of ca. 650 m3 s−1, into the Gironde estuary. Sediment flux ranges from 0.9 to 3 Mt yr−1 in relation to hydrological conditions.
3.3 Land use and population
To decipher the spatio-temporal drivers of the ΣPCBi contamination trends in the studied rivers, we also acquired population and land use data for each river corridor (Fig. 2; see also Supplement, Table S2).
The first group (Seine and Rhône rivers) is highly populated halfway between the source and the estuary. This tipping point is also associated with the occurrence of major urban and industrial areas near the river. On the Seine, a major increase in population and a concentration of industries occur in Paris megacity, the largest urban centre in France (10.6 million inhabitants; Fig. 2b and c). Other urban and industrial areas may be found in the upper Seine (Troyes and the Yonne confluence area) and in the lower section (Rouen conurbation), although they remain small compared to Paris (Fig. 2b). Similarly, the Rhône is characterised by increasing population densities with a demographic upsurge at Lyon (330 km from the sea). Near the Lyon metropolis (2.3 million inhabitants), urban areas occupy up to 57 % of the river corridor and industrial areas cover 16 % to 22 % of the surface area (Fig. 2h), in particular in the so-called chemical corridor, south of Lyon.
The second group (Loire and Garonne rivers) shows more gradually increasing population densities along the river due to the regular presence of cities and towns (Fig. 2l and q). In the Loire basin, urban (25 % to 50 %) and related industrial areas (ca. 5 %), such as Nevers, Orléans, Tours and Angers, follow one another (Fig. 2m). However, two main historical industrial basins are also found: St-Étienne metropolis (404 000 inhabitants) in the upper Loire (31 % urban and 19 % industries) and the Nantes valley next to the Loire estuary (20 % urban and 30 % industries; 640 000 inhabitants). In the Garonne watershed, there are also two main cities and industrial areas (Fig. 2r): Toulouse, 370–280 km from the Gironde (32 % urban, 12 % industries; 760 000 inhabitants), and Bordeaux metropolis (32 % urban, 19 % industries; 780 000 inhabitants), 50–25 km from the Gironde.
3.4 PCB pollution along the studied rivers
The spatial distribution of physical settings, land use and polluted sites is compared with the ΣPCBi spatial patterns in sediments along the rivers in Fig. 2d and e (Seine), Fig. 2i and j (Rhône), Fig. 2n and o (Loire), and Fig. 2s and t (Garonne). Overall, maximum values which could be considered as hotspots (see Supplement, Fig. S2) were recorded on the lower Seine in the 1970s from Paris to Rouen (up to 5 mg kg−1 in the Darse des Docks record in the Rouen harbour; Vrel et al., 2013). On the Rhône, the highest ΣPCBi values found downstream of Lyon in 1995–1996 were somewhat lower (up to 2.4 mg kg−1). In the Loire Valley, ΣPCBi was highest in the St-Étienne basin (upper Loire) from 1966 to 2006 (up to 1.1 mg kg−1) and in the Nantes valley (lower Loire) from 1973 to 1989 (0.6 to 1.2 mg kg−1) and also sporadically in 2003–2008 (up to 1.4 mg kg−1). ΣPCBi values in the Garonne sediments are generally low, and the maximum concentrations were recorded near the city of Toulouse in 1998 (only 145 µg kg−1; see Supplement, Fig. S2).
Regarding the spatial patterns, the Seine shows an increasing ΣPCBi trend in the downstream direction (Fig. 2d). Low ΣPCBi concentrations are measured upstream of Paris (median 28±20 µg kg−1), while an increase is obvious from Paris (median 103±79 µg kg−1) to Rouen (median 318±348 µg kg−1). This increase might be due to the co-occurrence of historical industries along the Seine (such as smelters and papermaking industries of Vernon, ca. 200 km UEA) and in the lower Eure valley (ca. 140 km UEA), with the long-term release of fine sediments from Paris and the upper catchment areas (Fisson et al., 2017; Gardes et al., 2020; Tubergue and Arthus-Bertrand, 2009). Maximum ΣPCBi concentrations range from 0.5 to ca. 5 mg kg−1 in this area. A decline is observed in the lower 80 km, between Rouen and Le Havre, where ΣPCBi values decrease to ca. 25±12 µg kg−1 in estuarine zones. On the Rhône, based on 13 historical cores along the river, we highlight an increasing ΣPCBi trend from the upper Rhône (median 15±10 µg kg−1) to the middle Rhône section (median 32±24 µg kg−1). In addition, samples collected in the chemical corridor and near the Gier confluence (middle Rhône) show very high contamination levels (ca 2 mg kg−1). Then, according to the GAM modelling, the lower Rhône section presents a slight decrease in the PCB contamination (median 24±18 µg kg−1).
The global distribution of ΣPCBi in the Loire seems driven by two major areas (Fig. 2n): the industrial basin of St-Étienne (upper Loire; median µg kg−1) and the Nantes valley (lower Loire; up to 1.4 mg kg−1). Between these two sectors (i.e. middle Loire), reduced ΣPCBi concentrations are recorded although the low density of observations is not sufficient to draw firm conclusions (see Supplement, Fig. S2). The same applies to the whole of the Garonne. Indeed, continental sections of the Garonne lack enough accurate monitoring of or historical data about persistent organic pollutants to propose a clear link between land use and pollution levels (Fig. 2q, r and s).
According to the BASIAS and BASOL databases, a variable number of PCB-contaminated sites are reported along the rivers (Fig. 2e, j, o and t). These databases provide valuable insights into the main polluted sites (due to leaks or fires from electrical capacitors or transformers) that should be cleaned up as a priority. A high frequency of PCB-polluted sites is evidenced next to Paris and Rouen (Seine), Lyon (Rhône), and Toulouse and Bordeaux (Garonne) conurbations. The spatial link between these sites and major urban or industrial areas is clear, probably due to the occurrence of electrical power centres specifically established to supply these areas. On the Loire, this relationship is less obvious because numerous incidents took place along the river, from St-Étienne to Digoin and Nevers for instance (Fig. 2o). Such divergences are almost certainly due to an incomplete listing and/or survey of pollution events (Callier and Koch-Mathian, 2010).
4.1 Temporal trends of the PCB contamination in the main French rivers
ΣPCBi temporal trends provide another important aspect of the fate of contaminant concentrations in sediments. Environmental histories could be described at different timescales according to the available data on each river: since 1945 for the Seine and Rhône rivers and since 1954 and 1973 for the Garonne and Loire rivers, respectively.
Among the reconstructed trends, the Seine curve shows a close relationship with the estimated production inventory proposed by Breivik et al. (2002a; Fig. 3a and e). Thus, four main steps are highlighted for this river: (1) ΣPCBi gradually increased from 1945 to 1970, with a plateau at the end of the 1950s known at both local and global scales (Breivik et al., 2002b; Lorgeoux et al., 2016). (2) The Seine curve reached a maximum in 1975 with ca. 1800 µg kg−1 of ΣPCBi. Then, (3) it sharply decreased to ca. 300 µg kg−1 in the late 1980s and (4) to ca. 100 µg kg−1 in the 2000s (Fig. 3a). The current ΣPCBi contamination (2000–2018) on the Seine remains relatively high from Paris to the lower Seine section (Supplement, Fig. S2). Figure 2c and d suggested that the origin of the PCB pollution is located within Paris and Rouen urban and industrial areas, where accidental contamination could occur (more than 200 PCB-polluted sites listed in Paris according to the BASIAS and BASOL databases). Inputs from the lower Seine valley and from its tributary (Eure valley), upstream of Rouen, may also be considered (Fig. 2d). The decline from steps (3) to (4) seems correlated with the prohibition of the production, sale and purchase of devices using more than 500 mg kg−1 of PCB after 1987 (mainly electrical transformers) and their mandated disposal according to the 1996 European directive (transposed into the French law in 2003; Fig. 3f).

Figure 3Estimated ΣPCBi trends in fluvial sediments since 1945 in the four rivers: (a) Seine, (b) Loire, (c) Rhône and (d) Garonne. The blue curve represents the GAM modelling and the pale blue area its confidence interval. Steps 1, 2, 3 and 4 refer to the temporal trends cited in the text. (e) Comparison with estimated global emissions of ΣPCBi in tonnes for France and western Europe (after Breivik et al., 2002a, 2007). (f) Regulation timeline: 75= French restriction of PCBs in closed devices (order of 8 July 1975); 87= prohibition of production, sale and purchase of devices using PCBs >500 mg kg−1 (decree 87-59); 01&03 = removal of devices using PCBs >500 mg kg−1 (decree 2001-63 and order of 26 February 2003); 13= disposal of devices using PCBs >50 mg kg−1 (decree 2013-301). The grey bar underlines the main period of PCB production worldwide.
The Loire record is shorter and presents high ΣPCBi concentrations in river sediments between 1973 and 1978 (1200 µg kg−1), before a quick decrease to 10 µg kg−1 after 2010 (Fig. 3b). These changes are likely linked with a global increase in PCB production and emission in western Europe from 1930 to 1970 (steps 1 and 2), before a sharp drop after 1973 (step 3), linked to the national application of global regulations (OECD) prohibiting the use of PCBs in open environments, following Breivik et al. (2002a, b, 2007; Fig. 3e). Indeed, the fast decrease in ΣPCBi in sediments in the late 1970s in the Seine and Loire rivers (half-life t1∕2 ranges from 5 to 13 years) suggests a signal affected by the global reduction in PCB emissions (Rosen and Van Metre, 2010). Moreover, PCBi half-life decay values (t1∕2) in the Seine and Loire sediments are also consistent with those measured on the Rhône cores where t1∕2 is between 2 and 13 years (Desmet et al., 2012).
For the Rhône, the general additive model (GAM) suggests a smoother and complex ΣPCBi trend (Fig. 3c). Indeed, the concentrations found in the 1950s are ca. 70 µg kg−1, and they slightly increased to a plateau of ca. 80 µg kg−1 in the 1980s and 1990s. Then, a general decrease is observed after 1996. This model, based on a large number of data, confirms the first modelling attempt of Desmet et al. (2012) based on a lower number of observations (four cores). The long-term plateau effect is obviously linked to high ΣPCBi values during the 1980s and the 1990s. Maximum values ranged from 0.7 to 2.4 mg kg−1 in 1995–1996 (i.e. much higher than regulation levels). They originated from Givors and St-Vallier, two stations located downstream of Lyon's chemical corridor, and at the mouth of the Gier industrial valley, which has been known for intensive mining, smelters, forges and factories since 1870 (Gay, 1996). Within Lyon (Fig. 2j), accidental contamination of groundwater in industrial or commercial sites that are abandoned or undergoing decommissioning are recorded from the west (Vaise, 300 L of Pyralene spilled in 1995) to the north-east (Vaulx-en-Velin, 4000 L in 2008). The reduction in PCBi levels in the Rhône presents a time-lapse of about 20 years compared to the Seine and Loire trends. This could be due to accidental releases in the middle Rhône section, but it is also certainly linked with river management and hydrological settings. Indeed, the Rhône is equipped with major dams and slide structures (Girardon infrastructures) which can store contaminated sediments and release them later on. This heavy engineering also affects the continuity of sediment transport. In addition, the Rhône has the highest SPM flux (4–8 Mt yr−1) and water flux (ca. 1700 m3 s−1) in France, which has likely diluted the pollution levels measured in sediments (Olivier et al., 2009; Poulier et al., 2019). Its floods could also produce a massive remobilisation of contaminated sediments (Ollivier et al., 2006). However, similar PCB patterns to those of the Seine were found in some areas with continuous sedimentation on the Rhône, such as La Morte (MTE core), Arras-sur-Rhône (ARS core), Péage-de-Roussillon and Lake Paladru (Desmet et al., 2012; Mourier et al., 2014; Vauclin et al., 2020). The PCBi trend at these sites is consistent with the global production of PCB – i.e. major increase during the 1960s–1980s – in western Europe (Breivik et al., 2002a).
On the Garonne, only a preliminary model can be applied carefully due to the few data > LOQ (Table 1; Fig. 3d). For a first attempt, ΣPCBi increased until 1980–1990 and then progressively decreased. Figure 3d displays a curved shape, although the lack of accurate monitoring data and of sediment archives (only one core) does not allow us to distinguish local from long-distance pollution. In any case, median ΣPCBi concentrations in the Garonne sediments vary from less than 20 to ca. 70 µg kg−1 (see Supplement, Fig. S2). Low ΣPCBi concentrations could be due to high sedimentation rates upstream of the monitored sites, whereas the highest concentrations could be partly related to the reworking of polluted sediments by the 1993 and 1996 floods for instance. These generally low values explain why the monitoring efforts were lower on this river; LOQs were also too high to investigate the spatial and temporal evolution of the contamination of this river.
4.2 Spatio-temporal distribution of the PCB contamination and implications for biota
To discuss spatial and temporal variations in contamination within each corridor, ΣPCBi concentrations in sediments were presented on the river sections for three main time windows: pre-1997, 1997–2007 and 2007–2018 (Fig. 4). Despite the differences regarding the spatial distribution (Fig. 2d, i, n, s) or the temporal trends on each river (Fig. 3), a general decrease in the ΣPCBi contamination is found in each river section, with the highest values systematically observed before 1997 (except around Paris; Fig. 4). Otherwise, a major increase is observed in the downstream direction for the three time windows.

Figure 4Detailed spatio-temporal distribution of ΣPCBi (log10 scale) in the (a) Seine, (b) Rhône, (c) Loire and (d) Garonne. Colours describe pollution levels in sediments, ranked from forest green (lowest levels) to dark red (highest levels). TEC, PEC, N1 and N2 refer to the main thresholds for PCBs: TEC (threshold effect concentration) and PEC (probable effect concentration) are 59.8 and 676 µg kg−1 for total PCBs, respectively (MacDonald et al., 2000); French regulatory levels N1 and N2 refer, respectively, to 80 and 160 µg kg−1 of ΣPCBi (order of 17 July 2014).
On the Seine, this situation is the result of major contamination of the river corridor from Paris to Rouen, linked with urban and industrial activities (Fig. 2a to e). However, in 1997–2007, ΣPCBi concentrations in fluvial sediments were higher in the Parisian stretch than in the lower section (Fig. 4a). This might be explained by a release of PCBs from accidental spills or waste discharges – mainly Pyralene oils from electrical transformers – contaminating soils and aquifers for a long period. Circa 20 sites show median concentrations above the lower-effect level at which toxicity to benthic-dwelling organisms is predicted to be unlikely (threshold effect concentration (TEC) =59.8 µg kg−1 according to MacDonald et al., 2000). Among these sites, 16 are also above the approved level for dredging and relocation activities in France without further investigations (N1 =80 µg kg−1, order of 14 July 2014). Further downstream, PCB concentrations in the lower Seine section also frequently exceed the environmental assessment criteria (EAC comprised between 0.6 µg kg−1 for PCB-118 and 40 µg kg−1 for PCB-153) used for the monitoring of coastal areas (OSPAR commission, 2009a). This pollution may have been dispersed down to the estuary where PCB contents increased in mussels (Mytilus edulis) from 1995 to 2006 (Tappin and Millward, 2015). Moreover, according to the current OSPAR assessment maps (http://dome.ices.dk/osparmime/main.html; last access: 14 February 2020), PCBi concentrations in sediments, fishes, shellfishes and crustaceans along the Normandy coast (France) frequently exceed EAC for most of the PCB indicator congeners and are generally higher than those of the English coast of the English Channel.
In the Rhône sediments, low to moderate ΣPCBi concentrations were generally observed before 1997 and a gradual decrease is found from 1997 to 2015 (Fig. 4b). The middle Rhône receives especially high concentrations of these contaminants, linked to significant emissions from urban and industrial activities (Lyon conurbation, its chemical corridor and the Gier valley). In addition, several sites of PCB production and release are located near Lyon such as the PCB treatment facility of Trédi (St-Vulbas), St-Auban in the Saône basin or some local sources such as at the vicinity of the Grand Large Reservoir, as previously demonstrated by Desmet et al. (2012). The concentrations in the lower Rhône corridor are very close to the middle Rhône concentrations and suggest a long-distance diffusion of this pollution. On the lower section, ΣPCBi concentrations are expected to be diluted by the high SPM flux coming from some tributaries, such as the Durance (1 to 2 Mt yr−1; Poulier et al., 2019). Our hypothesis, based on the compilation of numerous data, clearly contrasts with the previous assumption – based on eight cores of which only one was located on the lower section – which proposed an exponential increase in PCB pollution in the downstream direction (Mourier et al., 2014).
In all the Loire sections, very high ΣPCBi levels are displayed before 1997 (Fig. 4c). In the upper Loire, a major increase occurs in the St-Étienne basin which is mainly supplied by two tributaries: the Ondaine and Furan rivers (Fig. 2k). Currently (2007–2018), PCBs continue to accumulate at relatively high concentrations in this section. This issue is critical for sediment management and for wild species conservation. As an example, Lemarchand et al. (2014) demonstrated that PCBs were detected in all the analysed species and found high contamination cases among European otters (Lutra lutra). Indeed, the upper Loire basin was historically one of the main coal extraction areas in France with a high density of urban population and industries (gas, weapons, tools, etc.) until the 1980s. As for PAHs (Bertrand et al., 2015), the Ondaine–Furan corridor was likely the main contributor to the upper Loire PCB contamination. In the middle Loire stretch, several urban and industrial zones are found (Nevers, Orléans, Tours), although the low quantity of available data does not allow us to evaluate PCB pollution trends in those areas. In the lower Loire, PCBi sums were very high before 1997 and probably induced a high toxicity level, above the French N2 level (i.e. contamination too high to discharge dredged sediments into the sea; the sediments must be treated or stored in terrestrial environments) and PEC thresholds (Fig. 4c). This local PCB pollution is related to urban, industrial, refining and harbour activities around the city of Nantes and the port of St-Nazaire.
On the Garonne, a decreasing ΣPCBi trend is highlighted in each section, from 1997 to 2017 (Fig. 4d). ΣPCBi concentrations around Toulouse (middle Garonne) were the highest and suggest significant pollutant releases from the city conurbation. Few data were available for the Pyrenees foothills before 2010, although ΣPCBi concentrations are higher compared to those from the lower sections in the same period. One hypothesis could be the presence of local pollution sources derived from electricity production. Moreover, the PCB pollution in the Pyrenees is also demonstrated by the local prohibition against fishing eel, barber, bream, carp and catfish in the upper Garonne section in place since 2011 (according to prefectural orders collected by Robin des Bois, 2013). These observations illustrate the continuing need to challenge the PCB pollution issue (Brunet et al., 2007). Thus, current research underlines the need to acquire more precise monitoring and long-term data in several river sections that are poorly documented (e.g. Pyrenees foothills and middle Loire, for the Garonne and Loire rivers, respectively).
Finally, the current ΣPCBi content in all river sediments (2007–2018) suggests a relatively low toxicity. For this period, ΣPCBi concentrations are usually under ecotoxicological thresholds (such as TEC and EAC) and under the French regulatory level N1 ruling the management of dredged sediments. This relatively low ΣPCBi content in current river sediments contrasts with high ΣPCBi concentrations found in related biota. Indeed, PCB concentrations in freshwater fishes still exceed regulatory benchmarks for consumption in the middle Rhône valley, along the lower Seine and in the upper Loire (Babut et al., 2012; Lopes et al., 2012; Vigreux-Besret et al., 2015). For instance, the Baie de la Seine mussels are inedible due to median concentrations exceeding 300 µg kg−1 of PCB-153 – only one of the PCB-HC (Claisse et al., 2006). According to the OSPAR Commission (2000), the French Atlantic coast is also contaminated by PCBs delivered by the Loire and the Garonne rivers: high concentrations in mussels, oysters and fishes were found next to their estuaries and likely originated from urban and industrial areas. Sediments frequently exceeded the EAC in the Loire estuary, especially for PCB-118 which is the most toxic PCB congener (OSPAR commission, 2017). At the western European scale, high PCB content in surface sediments and marine biota from southern England and from Spain (eastern Bay of Biscay and Catalonia as well) likely indicates that French rivers provide a significant amount of PCB, transported by sea currents, to these areas (OSPAR commission, 2009b).
4.3 Specific ΣPCBi flux and worldwide comparison
Mean annual ΣPCBi flux (kg yr−1) during 4 decades (1977–1987, 1987–1997, 1997–2007, 2007–2017) was calculated according to the mean ΣPCBi concentrations in the lower river part and the corresponding SPM and solid flux during the same decades. Then, it was normalised by respective catchment areas to obtain specific ΣPCBi flux expressed in micrograms per square metre per year. Such a process allows for an estimation of annual pollutant flux reaching the river mouths (Babut et al., 2016; Mäkelä and Meybeck, 1996).
Using this approach, we demonstrated that the ΣPCBi load was the highest on the lower Rhône, regardless of the time window (Fig. 5). Indeed, specific ΣPCBi fluxRhône reached 12±3 (more than 1 t yr−1) between 1977 and 1987. Moreover, the specific flux remained relatively high until 2007, exceeding 4 , before decreasing to be ca. 1.3 during the last decade. The Rhône could be considered as one of the main contributors to the PCB pollution in the western Mediterranean, where shelf deposits have accumulated ca. 10–30 µg m−2 of PCB a year (maximum =45–65 ) from Monaco to Catalonia (Marchand et al., 1990; Salvadó et al., 2012; Tolosa et al., 1997). The specific ΣPCBi fluxRhône remains in the lowest quartile of the most polluted rivers of the world, compared to American (ΣPCBi fluxLakes Erie and Ontario=0.2–11 mg m−2 yr−1 from 1997 to 2000, Marvin et al., 2004; ΣPCBi fluxMississippi–Louisiana–Florida Bay=12–390 , Santschi et al., 2001) and to Asian rivers (e.g. ΣPCBi fluxPearl Delta=86–187 from 1980 to 1994, Mai et al., 2005).
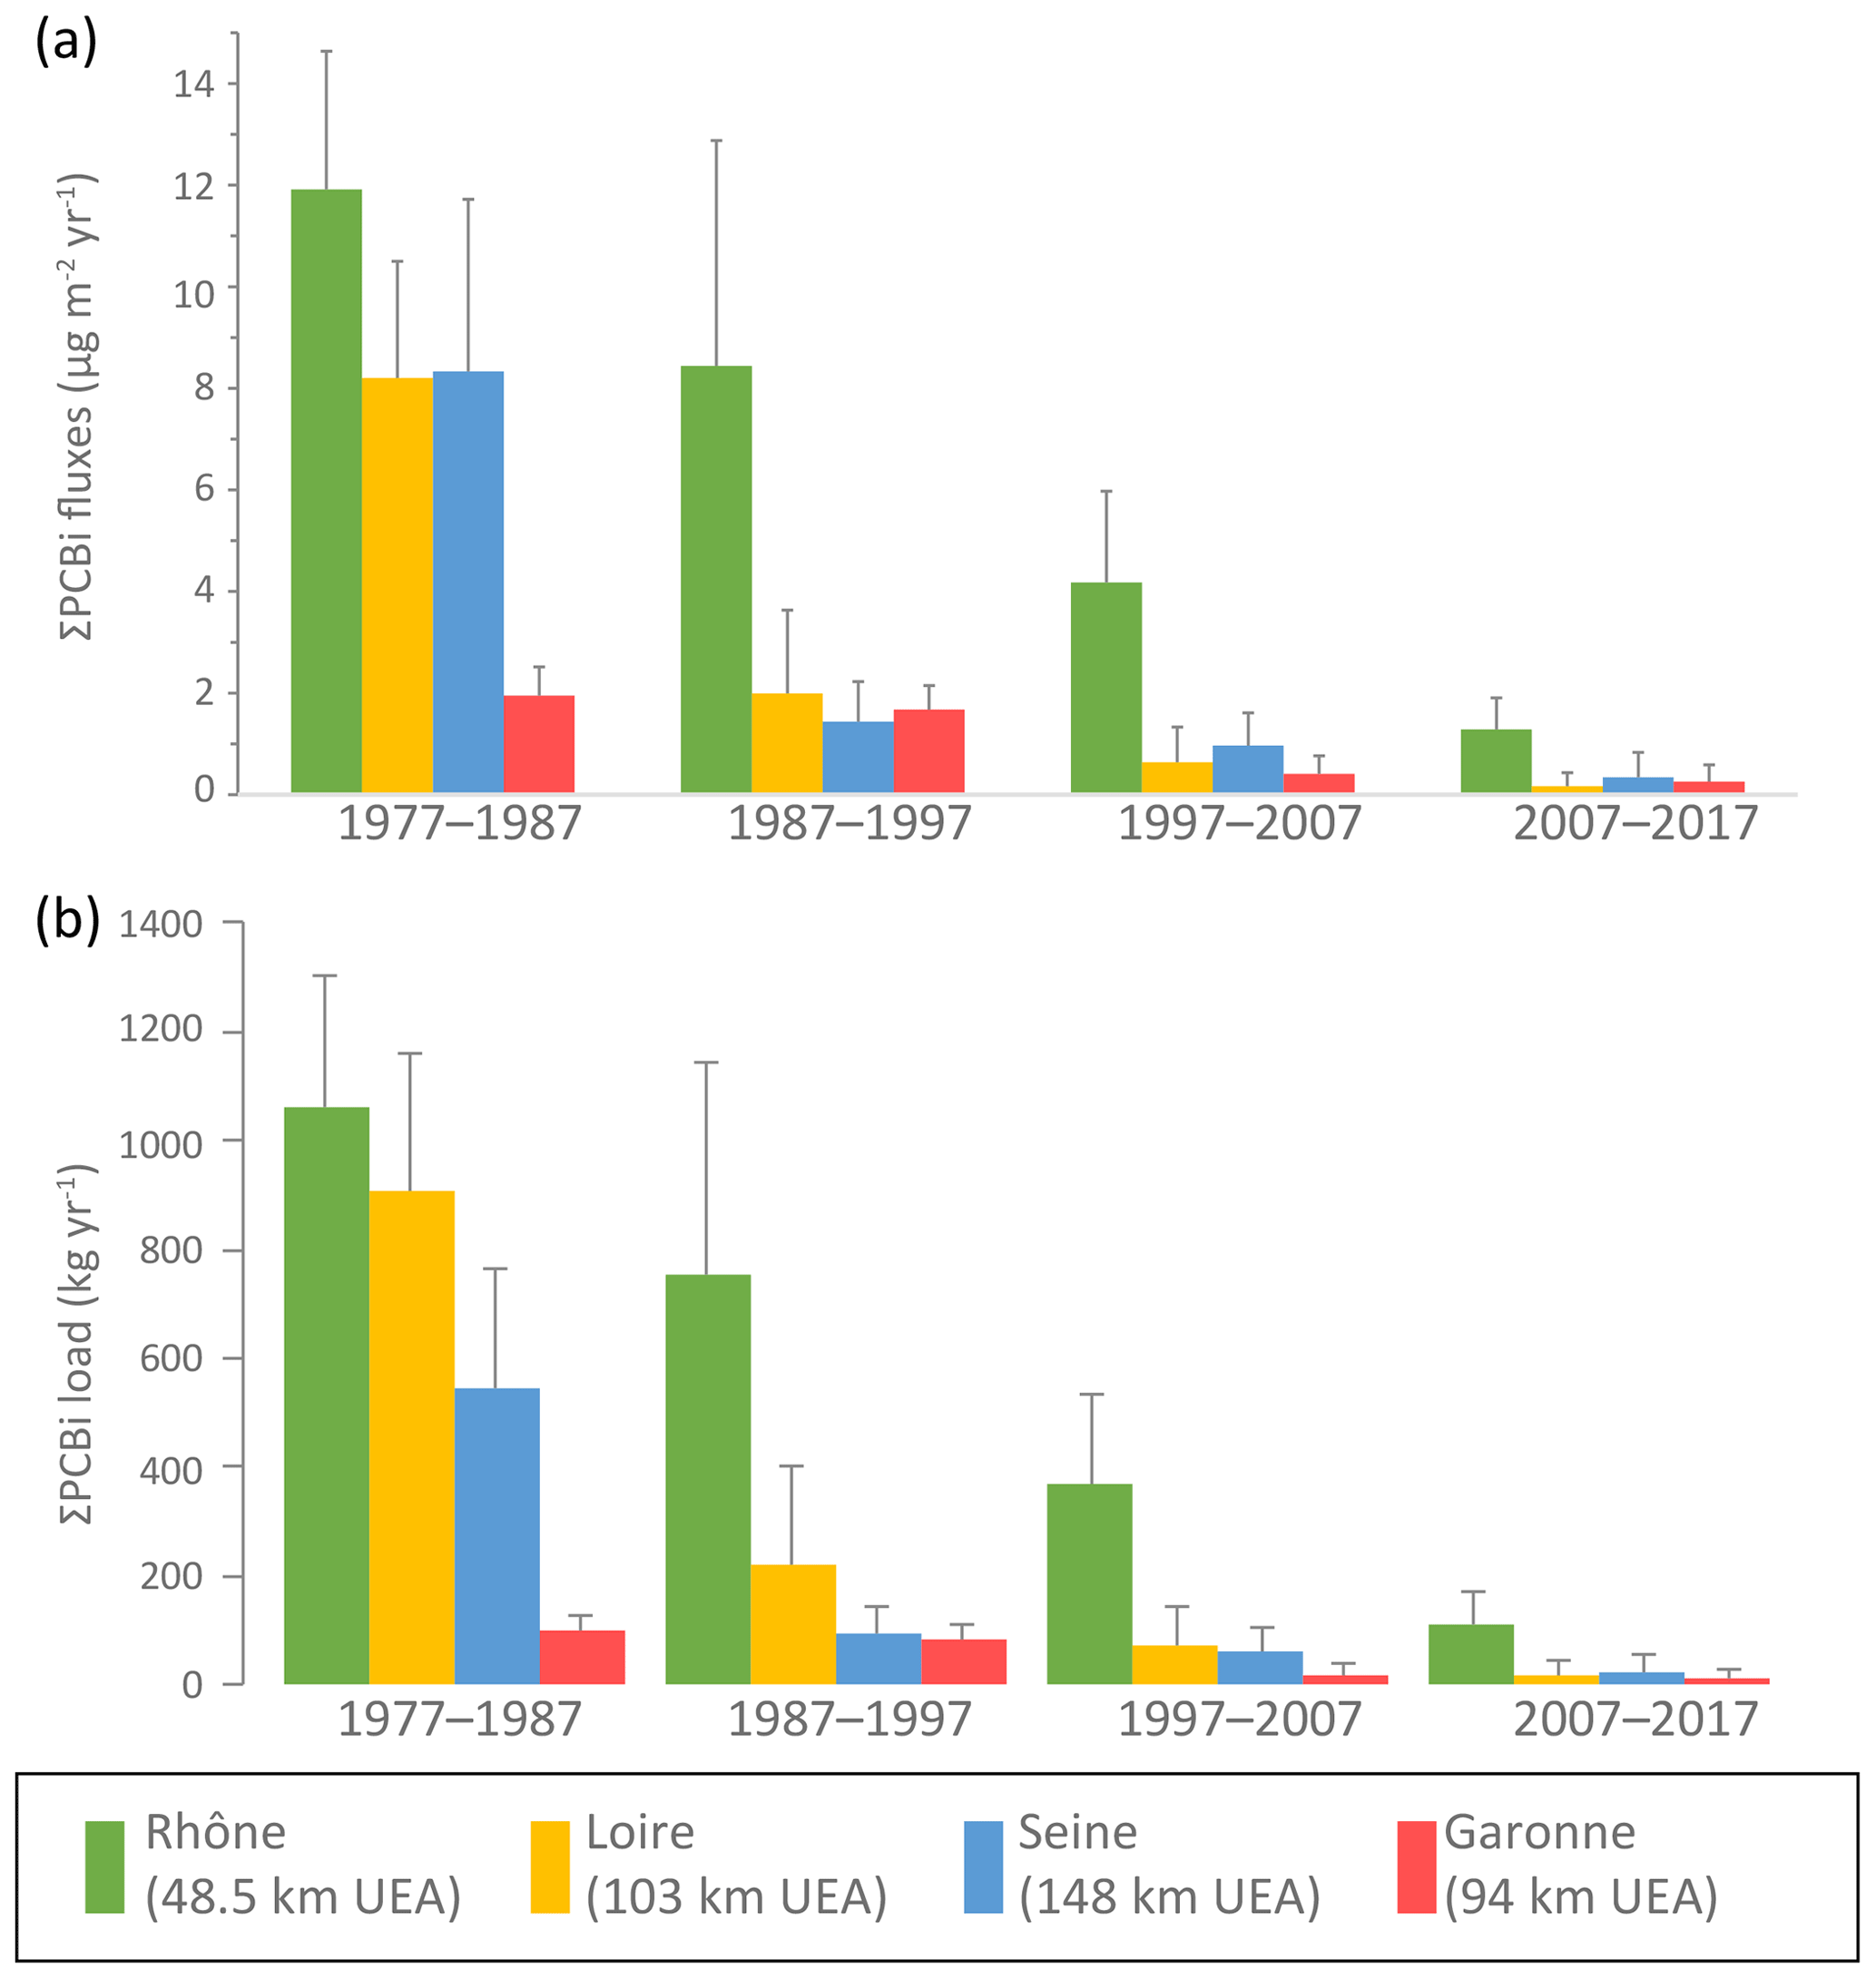
Figure 5Comparison of specific ΣPCBi flux () (a) and the mean annual load (kg yr−1) (b) on the French rivers. Fluxes and loads are estimated at the lower station upstream of the tidal influence: Arles–Beaucaire for the Rhône, Montjean for the Loire, Poses–Poissy for the Seine and La Réole–Lamagistère for the Garonne (see locations in Fig. 1). The distance of each station to the sea is expressed as kilometres upstream of estuarine areas (km UEA).
The Seine-specific ΣPCBi flux amounted to ca. 8.3 in 1977–1987, although it rapidly decreased to below 1.5 after 1987 (Fig. 5a). Current specific ΣPCBi fluxSeine can be estimated at ca. 0.35 , i.e. close to atmospheric flux measured by Chevreuil et al. (2009). According to Tappin and Millward (2015), the Seine could be considered as a major source of micro-pollutants in the English Channel, supplying half of the PCB flux (ΣPCBi fluxEnglish Channel=7.6 in the 1980s). The Seine very likely contributed, together with the Thames and Rhine rivers, to the North Sea PCB pollution. Some recent works also showed that more local pollution, derived from small coastal rivers, apparently drives the PCB influx nowadays (Everaert et al., 2014; Nicolaus et al., 2015; Vandermarken et al., 2018).
The Loire exhibited a ΣPCBi load as high as that in the Seine. Indeed, specific ΣPCBi fluxLoire culminated at ca. 8.2±2 in the 1970s and 1980s, before a sharp decrease to under 2 after 1987 (Fig. 5a). Its load exceeded the Seine load until 1997: 220–900 kg yr−1 versus 90–550 kg yr−1 (Fig. 5b). In the Loire basin, a high ΣPCBi flux originates from the upper Loire and is mainly exported by the Furan and Ondaine tributaries in the St-Étienne basin (ca. 59–41 kg yr−1 until 2007), due to high sediment loads (Gay et al., 2014). Finally, the Garonne transported relatively stable amounts of PCBi from 1977 to 1997 (2 to 1.7 ), before decreasing to less than 0.5 after 2007. All ΣPCBi fluxes display an asymptotic behaviour from 1977 to nowadays (Fig. 5), which reveals the persistence of non-null values of PCB in fluvial sediments in the future.
The dataset presented in this study is freely available on the Pangaea portal at https://doi.org/10.1594/PANGAEA.904277 (Dendievel et al., 2019).
In this research, we provided an original intercomparison of PCB pollution trends along four major rivers – i.e. from source to estuary – of Europe (the Seine, Rhône, Loire and Garonne rivers). The dataset targeted the sum of the seven regulatory indicator PCBs (ΣPCBi) through the collection of bed and flood sediments, SPM, dredged sediments, and cores that came from both monitoring data and research projects. The quality of the data varied according to the studied hydrosystem: the Seine and Rhône rivers were well documented, whereas a rather low number of suitable ΣPCBi data were available on the Garonne and Loire rivers. After using a correction factor on low-quality data, long-term ΣPCBi concentrations and flux were reconstructed over the last 80 years (1945–2018).
Our results identified some major industrial and urban areas as PCBi sources, diffusing the pollution from the upper and middle river sections to downstream areas. Two major temporal trends were found, depending on the river: (1) major and highly concentrated ΣPCBi releases (up to 4 mg kg−1) until 1975, followed by a sharp decrease until today, occurred on the Seine and Loire rivers and could be related to the implementation of environmental regulation. (2) Moderate ΣPCBi concentrations with diffusion taking place over the long term until the 1990s are found on the Rhône and Garonne rivers. Sporadic increases (up to 2 mg kg−1) due to urban or industrial releases and accidental discharges (old transformers and capacitors) also reduced the resilience of the studied hydrosystems.
Specific ΣPCBi fluxes and loads since 1977 show that the Rhône provides an important quantity of ΣPCBi to the sea, followed by the Seine and the Loire rivers. In contrast, low exports from the Garonne were found. Despite the lack of a global evaluation of PCBs delivered by rivers to the seas across the world (Lohmann and Dachs, 2019), we highlight the important role played by French rivers in the PCB contamination (sediments and biota) of the seas (western Mediterranean Sea, English Channel, Atlantic Ocean). For the future, it is important to insist on the necessity (1) to improve analytical performances for the acquisition of more reliable monitoring data on organic pollutants from river sediments and (2) to collect sediment cores at long-term accumulation sites in order to perform robust trend analyses and to better integrate the spatial and temporal contributions of pollution heritage.
Two supplementary tables are provided with (1) the list of the sampling locations, including the geographic coordinates, the survey period and the number of samples used (Supplement, Table S1) and (2) hydrological and human settings in a buffer zone of 1 km on both sides of each river, including the flow rates, population distribution, land use (urban and industrial areas) and number of PCB-polluted sites (Supplement, Table S2). Two supplementary figures are also provided to detail the ΣPCBi distribution within the matrix groups on each river (Supplement, Fig. S1) and to compare the historical (1945–2018) distribution of ΣPCBi hotspots (maxima) along the rivers with the current situation (2000–2018; Supplement, Fig. S2). The supplement related to this article is available online at: https://doi.org/10.5194/essd-12-1153-2020-supplement.
AMD and BM were in charge of collecting, formatting, cleaning and analysing data. Hydrological and land use data were acquired by AMD and QF. AC, BM, CG, FK, HB, MaxD, MarD, OE, PL, SA, SV, TG, TW and YC provided the sediment core data. Spatial analysis was performed by AMD. AMD and BM carried out the statistical analysis, designed the spatial figures and managed discussions with the help of SV and TW. All authors participated in the discussion and reviewed the draft manuscript.
The authors declare that they have no conflict of interest.
We are grateful to all INTERPOL consortium members in charge of the INTERcomparison of sediment POLlution on the main French rivers: the LEHNA IPE team (CNRS UMR 5023) on the Rhône, the EPOC laboratory on the Garonne basin (CNRS UMR 5805), the GEHCO laboratory on the Loire basin (EA 6293), and the LSCE team (CEA CNRS UVSQ UMR 8212) and the M2C team from Rouen (CNRS UMR 6143) on the Seine basin. The authors are grateful to Olivier Perceval (OFB – French Agency for Biodiversity), whose inputs greatly enhanced the project releases. We thank Marc Babut and the anonymous reviewer for their valuable comments that improved our research paper. We are also grateful to the following partners for sharing data and information: Grand Port Maritime de Rouen (HAROPA Ports), Grand Port Maritime de Nantes, Compagnie Nationale du Rhône (CNR) and the Robin des Bois association.
This work was supported by the French Agency for Biodiversity (OFB-Interpol; grant no. 171187) and coordinated by Brice Mourier. The regional directorate of CNRS (DR7 – Rhône-Auvergne) ensured the administrative and financial management of the project between all the members of the Interpol consortium.
This paper was edited by David Carlson and reviewed by Marc Babut and one anonymous referee.
Babut, M., Lopes, C., Pradelle, S., Persat, H., and Badot, P.-M.: BSAFs for freshwater fish and derivation of a sediment quality guideline for PCBs in the Rhône basin, France, J. Soil. Sediment., 12, 241–251, https://doi.org/10.1007/s11368-011-0448-y, 2012.
Babut, M., Persat, H., Desmet, M., Lopes, C., Mourier, B., and Tronczyński, J.: Les PCB dans le Rhône, in: PCB, environnement et santé, edited by: Amiard, J.-C., Meunier, T., and Babut Tec, M., Doc/Lavoisier, Paris, 473–498, 2016.
Baccarelli, A., Pfeiffer, R., Consonni, D., Pesatori, A. C., Bonzini, M., Patterson Jr., D. G., Bertazzi, P. A., and Landi, M. T.: Handling of dioxin measurement data in the presence of non-detectable values: Overview of available methods and their application in the Seveso chloracne study, Chemosphere, 60, 898–906, https://doi.org/10.1016/j.chemosphere.2005.01.055, 2005.
Barraud, R., Carcaud, N., Davodeau, H., Montembault, D., and Pordoy, C.: Groynes of the Armorican Lower Loire River, an Heritage with Uncertain Future, Norois, 228, 39–52, https://doi.org/10.4000/norois.4729, 2013.
Bertrand, O., Mondamert, L., Grosbois, C., Dhivert, E., Bourrain, X., Labanowski, J., and Desmet, M.: Storage and source of polycyclic aromatic hydrocarbons in sediments downstream of a major coal district in France, Environ. Pollut., 207, 329–340, https://doi.org/10.1016/j.envpol.2015.09.028, 2015.
Bettinetti, R., Quadroni, S., Boggio, E., and Galassi, S.: Recent DDT and PCB contamination in the sediment and biota of the Como Bay (Lake Como, Italy), Sci. Total Environ., 542, 404–410, https://doi.org/10.1016/j.scitotenv.2015.10.099, 2016.
Blanchet-Letrouvé, I., Zalouk-Vergnoux, A., Vénisseau, A., Couderc, M., Le Bizec, B., Elie, P., Herrenknecht, C., Mouneyrac, C., and Poirier, L.: Dioxin-like, non-dioxin like PCB and PCDD/F contamination in European eel (Anguilla anguilla) from the Loire estuarine continuum: Spatial and biological variabilities, Sci. Total Environ., 472, 562–571, https://doi.org/10.1016/j.scitotenv.2013.11.037, 2014.
Boust, D., Berthe, T., and Lesueur, P.: Projet Rhapsodis 2008–2011, Rapport Final, Rapport Seine Aval, 4, 1–163, 2012.
Breivik, K., Sweetman, A., Pacyna, J. M., and Jones, K. C.: Towards a global historical emission inventory for selected PCB congeners — a mass balance approach. 1. Global production and consumption, Sci. Total Environ., 290, 181–198, https://doi.org/10.1016/S0048-9697(01)01075-0, 2002a.
Breivik, K., Sweetman, A., Pacyna, J. M., and Jones, K. C.: Towards a global historical emission inventory for selected PCB congeners – a mass balance approach: 2. Emissions, Sci. Total Environ., 290, 199–224, https://doi.org/10.1016/S0048-9697(01)01076-2, 2002b.
Breivik, K., Sweetman, A., Pacyna, J. M., and Jones, K. C.: Towards a global historical emission inventory for selected PCB congeners – a mass balance approach. 3. An update, Sci. Total Environ., 377, 296–307, https://doi.org/10.1016/j.scitotenv.2007.02.026, 2007.
Brunet, J.-F., Darmendrail, D., and Roy, S.: Etat des lieux sur la pollution des fleuves par les PCB dans le monde, Actions des pouvoirs publics. Exemples de décontamination, BRGM/RP-55835-FR, BRGM, Orléans, 1–167, 2007.
Callier, L. and Koch-Mathian, J. Y.: Inventaire Historique de sites industriels (IHR/IHU) et BASIAS: Bilan des actions 2010, BRGM/RP-59335-FR, BRGM, Orléans, 1–88, 2010.
Chevreuil, M., Blanchard, M., Dargnat, C., Gasperi, J., Gourlay, C., Lorgeoux, C., Moilleron, R., Moreau-Guigon, E., Ollivon, D., Teil, M.-J., and Mouchel, J.-M.: PCB: une nuisance du passé toujours présente, in: La micropollution organique dans le bassin de la Seine, Agence de l'Eau Seine Normandie, Paris, 10–27, 2009.
Claisse, D., Le Moigne, M., Durand, G., and Beliaeff, B.: Ligne de base: Les contaminants chimiques dans les huîtres et les moules du littoral français, in: RNO, Surveillance du Milieu Marin, Travaux du Réseau National d'Observation de la qualité du milieu marin, Ifremer, MEDD, Nantes, Paris, 27–51, 2006.
Copard, Y., Eyrolle, F., Radakovitch, O., Poirel, A., Raimbault, P., Gairoard, S., and Di-Giovanni, C.: Badlands as a hot spot of petrogenic contribution to riverine particulate organic carbon to the Gulf of Lion (NW Mediterranean Sea), Earth Surf. Proc. Land., 43, 2495–2509, https://doi.org/10.1002/esp.4409, 2018.
Coynel, A., Schäfer, J., Hurtrez, J.-E., Dumas, J., Etcheber, H., and Blanc, G.: Sampling frequency and accuracy of SPM flux estimates in two contrasted drainage basins, Sci. Total Environ., 330, 233–247, https://doi.org/10.1016/j.scitotenv.2004.04.003, 2004.
Dendievel, A.-M., Mourier, B., Desmet, M., Coynel, A., Labadie, P., Ayrault, S., Budzinski, H., Debret, M., Evrard, O., Gardes, T., Vauclin, S., Grosbois, C., and Winiarski, T.: Polychlorinated Biphenyls (PCB) indicators in sediments from the main French Rivers from 1945 to 2018 (Garonne, Loire, Rhône, Seine), PANGAEA, https://doi.org/10.1594/PANGAEA.904277, 2019.
Dennis, D. S.: Polychlorinated Biphenyls in the Surface Waters and Bottom Sediments of the Major Drainage Basins of the United States, in: National Conference on Polychlorinated Biphenyls (19–21 November 1975, Chicago, Illinois), Environmental Protection Agency, Office of Toxic Substances, Washington D.C., 183–194, 1976.
Desforges, J.-P., Hall, A., McConnell, B., Rosing-Asvid, A., Barber, J. L., Brownlow, A., Guise, S. D., Eulaers, I., Jepson, P. D., Letcher, R. J., Levin, M., Ross, P. S., Samarra, F., Víkingson, G., Sonne, C., and Dietz, R.: Predicting global killer whale population collapse from PCB pollution, Science, 361, 1373–1376, https://doi.org/10.1126/science.aat1953, 2018.
Desmet, M., Mourier, B., Mahler, B. J., Van Metre, P. C., Roux, G., Persat, H., Lefèvre, I., Peretti, A., Chapron, E., Simonneau, A., Miège, C., and Babut, M.: Spatial and temporal trends in PCBs in sediment along the lower Rhône River, France, Sci. Total Environ., 433, 189–197, https://doi.org/10.1016/j.scitotenv.2012.06.044, 2012.
De Voogt, P. and Brinkman, U. A. T.: Production, properties and usage of polychlorinated biphenyls, in: Halogenated biphenyls, terphenyls, naphthalenes, dibenzodioxins and related products, edited by: Kimbrough, R. D. and Jensen, A. A., Elsevier Science Publishers B.V., Amsterdam, 3–45, 1997.
Everaert, G., De Laender, F., Deneudt, K., Roose, P., Mees, J., Goethals, P. L. M., and Janssen, C. R.: Additive modelling reveals spatiotemporal PCBs trends in marine sediments, Mar. Pollut. Bull., 79, 47–53, https://doi.org/10.1016/j.marpolbul.2014.01.002, 2014.
Fisson, C., Debret, M., Houllemare, P., and Vicquelin, L.: Industrialisation de l'estuaire de la Seine: Quel héritage pour la qualité des eaux, Fascicule Seine-Aval, 3.6, 1–52, 2017.
Gardes, T., Debret, M., Copard, Y., Patault, E., Winiarski, T., Develle, A.-L., Sabatier, P., Dendievel, A.-M., Mourier, B., Marcotte, S., Leroy, B., and Portet-Koltalo, F.: Reconstruction of anthropogenic activities in legacy sediments from the Eure River, a tributary of the Seine Estuary (France), Catena, 190, 104513, https://doi.org/10.1016/j.catena.2020.104513, 2020.
Gay, A., Cerdan, O., Delmas, M., and Desmet, M.: Variability of suspended sediment yields within the Loire river basin (France), J. Hydrol., 519, 1225–1237, https://doi.org/10.1016/j.jhydrol.2014.08.045, 2014.
Gay, G.: Mines, forges et usines dans la vallée du Gier (Loire): le patrimoine industriel comme palimpseste social, Le Monde alpin et rhodanien, Revue régionale d'ethnologie, 24, 215–229, https://doi.org/10.3406/mar.1996.1609, 1996.
GIP Seine Aval: Contextes climatique, morphologique & hydro-sédimentaire: dynamique des matériaux fins dans l'estuaire de la Seine, GIP Seine Aval, Rouen, 2008.
Hauptmann, A. L., Sicheritz-Pontén, T., Cameron, K. A., Elum, J. B., Plichta, D. R., Dalgaard, M., and Stibal, M.: Contamination of the Arctic reflected in microbial metagenomes from the Greenland ice sheet, Environ. Res. Lett., 12, 074019, https://doi.org/10.1088/1748-9326/aa7445, 2017.
Helsel, D. R.: Fabricating data: How substituting values for nondetects can ruin results, and what can be done about it, Chemosphere, 65, 2434–2439, https://doi.org/10.1016/j.chemosphere.2006.04.051, 2006.
IARC: Polychlorinated Biphenyls and Polybrominated Biphenyls, IARC Monographs, 107, Lyon, 2016.
Lalanne-Berdouticq, G.: L'aménagement de la plaine d'inondation et les grandes crues de la Garonne aval, Revue géographique des Pyrénées et du Sud-Ouest, Sud-Ouest Européen, 60, 569–578, https://doi.org/10.3406/rgpso.1989.3179, 1989.
Lauzent, M.: Etude de l'écodynamique des polluants organiques persistants et des micropolluants halogénés d'intérêt émergent dans les milieux aquatiques, PhD Thesis, University of Bordeaux, Bordeaux, 2017.
Lemarchand, C., Rosoux R., Talon, C., Berny, P.: Flagship Species Conservation and Introduced Species Invasion: Toxic Aspects Along Loire River (France), in: Pesticides, Toxic Aspects, edited by: Soloneski, S., IntechOpen, London, https://doi.org/10.5772/57176, 2014.
Lestel, L., Eschbach, D., Steinmann, R., and Gastaldi, N.: ArchiSEINE: une approche géohistorique du bassin de la Seine, Fascicule #18, PIREN-Seine, Arceau, 1–62, 2019.
Lohmann, R. and Dachs, J.: Polychlorinated Biphenyls in the Global Ocean, in: World Seas: An Environmental Evaluation: Volume III: Ecological Issues and Environmental Impacts, edited by: Sheppard, C., Academic Press, Elsevier, London, 269–282, 2019.
Lopes, C., Persat, H., and Babut, M.: Transfer of PCBs from bottom sediment to freshwater river fish: A food-web modelling approach in the Rhône River (France) in support of sediment management, Ecotox. Environ. Safe., 81, 17–26, https://doi.org/10.1016/j.ecoenv.2012.04.007, 2012.
Lorgeoux, C., Moilleron, R., Gasperi, J., Ayrault, S., Bonté, P., Lefèvre, I., and Tassin, B.: Temporal trends of persistent organic pollutants in dated sediment cores: Chemical fingerprinting of the anthropogenic impacts in the Seine River basin, Paris, Sci. Total Environ., 541, 1355–1363, https://doi.org/10.1016/j.scitotenv.2015.09.147, 2016.
Lu, Q., Jürgens, M. D., Johnson, A. C., Graf, C., Sweetman, A., Crosse, J., and Whitehead, P.: Persistent Organic Pollutants in sediment and fish in the River Thames Catchment (UK), Sci. Total Environ., 576, 78–84, https://doi.org/10.1016/j.scitotenv.2016.10.067, 2017.
MacDonald, D. D., Ingersoll, C. G., and Berger, T. A.: Development and Evaluation of Consensus-Based Sediment Quality Guidelines for Freshwater Ecosystems, Arch. Environ. Con. Tox., 39, 20–31, https://doi.org/10.1007/s002440010075, 2000.
Mai, B., Zeng, E. Y., Luo, Yang, Zhang, G., Li, X., Sheng, G., and Fu, J.: Abundances, Depositional Fluxes, and Homologue Patterns of Polychlorinated Biphenyls in Dated Sediment Cores from the Pearl River Delta, China, Environ. Sci. Technol., 39, 49–56, https://doi.org/10.1021/es049015d, 2005.
Mäkelä, A. and Meybeck, M.: Designing a monitoring program, in: Water Quality Monitoring – A Practical Guide to the Design and Implementation of Freshwater Quality Studies and Monitoring Programmes, edited by: Bartram, J. and Balance, R., E&FN Spon, London, 9–33, 1996.
Marchand, M., Abarnou, A., and Marcaillou-Lebaut, C.: Les Polychlorobiphényles (PCB) en milieu marin: biogéochimie et écotoxicologie, Rapports scientifiques et techniques de l'IFREMER, 18, 1–162, 1990.
Marvin, C. H., Sverko, E., Charlton, M. N., Lina Thiessen, P. A., and Painter, S.: Contaminants Associated with Suspended Sediments in Lakes Erie and Ontario, 1997–2000, J. Great Lakes Res., 30, 277–286, https://doi.org/10.1016/S0380-1330(04)70345-7, 2004.
Meybeck, M., Lestel, L., Carré, C., Bouleau, G., Garnier, J. and Mouchel, J. M.: Trajectories of river chemical quality issues over the Longue Durée: the Seine River (1900S–2010), Environ. Sci. Pollut. R., 25, 23468–23484, https://doi.org/10.1007/s11356-016-7124-0, 2018.
Moatar, F. and Dupont, N.: La Loire fluviale et estuarienne, Un milieu en évolution, Editions Quae, Paris, 2016.
Morelli, G., Coynel, A., Bellucci, L., Schäfer, J., Blanc, G., and Derriennic, H.: Assessment of Historical Trace Metals Contamination Along a River-Estuarine-Coastal Gradient in Sediment Cores from the Garonne-Gironde System (France), 18th International Conference on Heavy Metals in The Environment, Ghent, 12–15 September 2016.
Mourier, B., Desmet, M., Van Metre, P. C., Mahler, B. J., Perrodin, Y., Roux, G., Bedell, J.-P., Lefèvre, I., and Babut, M.: Historical records, sources, and spatial trends of PCBs along the Rhône River (France), Sci. Total Environ., 476–477, 568–576, https://doi.org/10.1016/j.scitotenv.2014.01.026, 2014.
Müller, G.: Schadstoffe in Sedimenten – Sedimente als Schadstoffe, Umweltgeologie-Band, 79, 107–126, 1986.
Nicolaus, E. E. M., Law, R. J., Wright, S. R., and Lyons, B. P.: Spatial and temporal analysis of the risks posed by polycyclic aromatic hydrocarbon, polychlorinated biphenyl and metal contaminants in sediments in UK estuaries and coastal waters, Mar. Pollut. Bull., 95, 469–479, https://doi.org/10.1016/j.marpolbul.2015.03.012, 2015.
Olenycz, M., Sokołowski, A., Niewińska, A., Wołowicz, M., Namieśnik, J., Hummel, H., and Jansen, J.: Comparison of PCBs and PAHs levels in European coastal waters using mussels from the Mytilus edulis complex as biomonitors, Oceanologia, 57, 196–211, https://doi.org/10.1016/j.oceano.2014.12.001, 2015.
Olivier, J.-M., Carrel, G., Lamouroux, N., Dole-Olivier, M.-J., Malard, F., Bravard, J.-P., and Amoros, C.: The Rhône River Basin, in: Rivers of Europe, edited by: Tockner, K., Robinson, C. T., and Uehlinger U., Academic Press, London, 247–295, 2009.
Ollivier, P., Radakovitch, O., and Hamelin, B.: Unusual variations of dissolved As, Sb and Ni in the Rhône River during flood events, J. Geochem. Explor., 88, 394–398, https://doi.org/10.1016/j.gexplo.2005.08.083, 2006.
OSPAR commission: Quality Status Report 2000, Region IV – Bay of Biscay and Iberian Coast, OSPAR Commission, London, 2000.
OSPAR commission: Background Document on CEMP assessment criteria for the QSR 2010, OSPAR Commission, London, 2009a.
OSPAR commission: Status and trend of marine chemical pollution, Hazardous Substances Series, OSPAR Commission, London, 2009b.
OSPAR commission: Levels and trends in marine contaminants and their biological effects – CEMP Assessment report 2016, OSPAR Commission, London, 2017.
Parrot, E.: Analyse spatio-temporelle de la morphologie du chenal du Rhône du Léman à la Méditerranée, PhD Thesis, University Lyon 3, Lyon, 2015.
Poulier, G., Launay, M., Le Bescond, C., Thollet, F., Coquery, M., and Le Coz, J.: Combining flux monitoring and data reconstruction to establish annual budgets of suspended particulate matter, mercury and PCB in the Rhône River from Lake Geneva to the Mediterranean Sea, Sci. Total Environ., 658, 457–473, https://doi.org/10.1016/j.scitotenv.2018.12.075, 2019.
R Core Team: R: A language and environment for statistical computing, R Foundation for Statistical Computing, Vienne (Austria), Version 3.5.1., 2018.
Robin des Bois: Atlas de sites aquatiques contaminés par les PCBs, available at: http://www.robindesbois.org/atlas-des-sites-aquatiques-contamines-par-les-pcb/ (last access: 26 October 2018), 2013.
Rosen, M. R. and Van Metre, P. C.: Assessment of multiple sources of anthropogenic and natural chemical inputs to a morphologically complex basin, Lake Mead, USA, Palaeo, 294, 30–43, https://doi.org/10.1016/j.palaeo.2009.03.017, 2010.
Salvadó, J. A., Grimalt, J. O., López, J. F., Palanques, A., Heussner, S., Pasqual, C., Sanchez-Vidal, A., and Canals, M.: Role of Dense Shelf Water Cascading in the Transfer of Organochlorine Compounds to Open Marine Waters, Environ. Sci. Technol., 46, 2624–2632, https://doi.org/10.1021/es2038189, 2012.
Santschi, P. H., Presley, B. J., Wade, T. L., Garcia-Romero, B., and Baskaran, M.: Historical contamination of PAHs, PCBs, DDTs, and heavy metals in Mississippi River Delta, Galveston Bay and Tampa Bay sediment cores, Mar. Environ. Res., 52, 51–79, https://doi.org/10.1016/S0141-1136(00)00260-9, 2001.
Schäfer, S., Antoni, C., Möhlenkamp, C., Claus, E., Reifferscheid, G., Heininger, P., and Mayer, P.: Equilibrium sampling of polychlorinated biphenyls in River Elbe sediments – Linking bioaccumulation in fish to sediment contamination, Chemosphere, 138, 856–862, https://doi.org/10.1016/j.chemosphere.2015.08.032, 2015.
Tappin, A. D. and Millward, G. E.: The English Channel: Contamination status of its transitional and coastal waters, Mar. Pollut. Bull., 95, 529–550, https://doi.org/10.1016/j.marpolbul.2014.12.0120025-326X, 2015.
Tolosa, I., Readman, J. W., Fowler, S. W., Villeneuve, J. P., Dachs, J., Bayona, J. M., and Albaiges, J.: PCBs in the western Mediterranean. Temporal trends and mass balance assessment, Deep-Sea Res. Pt. II, 44, 907–928, https://doi.org/10.1016/S0967-0645(96)00104-X, 1997.
Tricart, J. and Bravard, J.-P.: L'aménagement des trois plus grands fleuves européens: Rhin, Rhône et Danube. Problèmes et méfaits, Ann. Géogr., 100, 668–713, https://doi.org/10.3406/geo.1991.21654, 1991.
Tubergue, J.-P. and Arthus-Bertrand, Y.: La Seine vue du ciel: de Chatou à la Roche-Guyon, Italiques Edn., Triel-sur-Seine, 2009.
Vandermarken, T., Gao, Y., Baeyens, W., Denisonb, M. S., and Croes, K.: Dioxins, furans and dioxin-like PCBs in sediment samples and suspended particulate matter from the Scheldt estuary and the North Sea Coast: Comparison of CALUX concentration levels in historical and recent samples, Sci. Total Environ., 626, 109–116, 2018.
Vauclin, S., Mourier, B., Tena, A., Piégay, H., and Winiarski, T.: Effects of river infrastructures on the floodplain sedimentary environment in the Rhône River, J. Soil. Sediment., https://doi.org/10.1007/s11368-019-02449-6, online first, 2019.
Vauclin, S., Mourier, B., Dendievel, A.-M., Noclin, N., Piégay, H., Marchand, P., and Winiarski, T.: Influence of depositional environments on the contamination record of fluvial sediments: a case study from the Rhône River (France), EGU General Assembly 2020, 2020.
Vigreux-Besret, C., Rivière, G., Feidt, C., Amiard, J.-C., Babut, M., Badot, P.-M., Blanchemanche, S., Camel, V., Le Bizec, B., Narbonne, J.-F., Roudot, A., Vernoux, J.-P., Volatier, J.-L., Mahé, A., and Desvignes, V.: Consommation de poissons d'eau douce et PCB : aspects réglementaires, méthodologiques et sanitaires, Avis de l'Anses – Rapport d'expertise collective, ANSES, Maisons-Alfort, 2015.
Vrel, A., Boust, D., Lesueur, P., Deloffre, J., Dubrulle-Brunaud, C., Solier, L., Rozet, M., Thouroude, C., Cossonnet, C., and Thomas, S.: Dating of sediment record at two contrasting sites of the Seine River using radioactivity data and hydrological time series, J. Environ. Radioactiv., 126, 20–31, https://doi.org/10.1016/j.jenvrad.2013.06.005, 2013.
Wania, F. and Su, Y.: Quantifying the Global Fractionation of Polychlorinated Biphenyls, Ambio, 33, 161–168, https://doi.org/10.1579/0044-7447-33.3.161, 2004.
Wickham, H., Chang, W., Henry, L., Pedersen, T. L., Takahashi, K., Wilke, C., and Woo, K.: Package “ggplot2”, Create Elegant Data Visualisations Using the Grammar of Graphics, version 3.1.1, available at: http://cran.r-project.org/web/packages/rioja/index.html (last access: 19 June 2014), 2019.
Wood, S.: Package “mgcv”, Mixed GAM Computation Vehicle with Automatic Smoothness Estimation, version 1.8-28, available at: http://cran.r-project.org/web/packages/rioja/index.html (last access: 19 June 2014), 2019.
Yahia, D. and Elsharkawy, E. E.: Multi pesticide and PCB residues in Nile tilapia and catfish in Assiut city, Egypt, Sci. Total Environ., 466–467, 306–314, https://doi.org/10.1016/j.scitotenv.2013.07.002, 2014.