the Creative Commons Attribution 4.0 License.
the Creative Commons Attribution 4.0 License.
 | 04 Feb 2020
A long-term (1965–2015) ecological marine database from the LTER-Italy Northern Adriatic Sea site: plankton and oceanographic observations
Francesco Acri
Mauro Bastianini
Fabrizio Bernardi Aubry
Elisa Camatti
Alfredo Boldrin
Caterina Bergami
Daniele Cassin
Amelia De Lazzari
Stefania Finotto
Annalisa Minelli
Alessandro Oggioni
Marco Pansera
Alessandro Sarretta
Giorgio Socal
Alessandra Pugnetti
In this paper we describe a 50-year (1965–2015) ecological database containing data collected in the northern Adriatic Sea (NAS) at one of the 25 research parent sites belonging to the Italian Long Term Ecological Research Network (LTER-Italy, http://www.lteritalia.it, last access: February 2020). LTER-Italy is a formal member of the International (https://www.ilter.network, last access: February 2020) and European (http://www.lter-europe.net/, last access: February 2020) LTER networks. The NAS is undergoing a process, led by different research institutions and projects, of establishing a marine ecological observatory, building on the existing facilities, infrastructure, and long-term ecological data. During this process, the implementation of open-access and open-science principles has been started by creating an open-research life cycle that involves sharing ideas and results (scientific papers), data (raw and processed), metadata, methods, and software. The present data paper is framed within this wider context. The database is composed of observations on abiotic parameters and phytoplankton and zooplankton abundances, collected during 299 cruises in different sampling stations, in the Gulf of Venice in particular. Here we describe the sampling and analytical activities, the parameters, and the structure of the database. The database is available at https://doi.org/10.5281/zenodo.3516717 (Acri et al., 2019), and it was also uploaded in the DEIMS-SDR repository (Dynamic Ecological Information Management System – Site and Dataset Registry, https://deims.org/), which is the official site and data registry for the International LTER network.


In this paper, we describe a 50-year (1965–2015) ecological database containing data on plankton communities and related abiotic parameters collected in the northern Adriatic Sea (NAS). Plankton communities, which are at the base of aquatic ecosystem functioning, have a broad and diversified range of seasonal patterns, multi-annual trends, and shifts across different marine ecosystems: making long-term series of plankton and oceanographic observations available provides unique and precious tools for depicting reliable patterns of average annual cycles and for detecting significant changes and trends in response to global or local pressures and impacts.
Open data are nowadays considered a crucial issue in both scientific research and public administration and management. Wilkinson et al. (2016) conceived the “FAIR” data management principles, which states that data must be “Findable, Accessible, Interoperable, and Reusable”. The open access to data is one crucial step of open science (http://www.budapestopenaccessinitiative.org/read (last access: February 2020), European Commission, 2016), which is a wider approach embracing transparency at all stages of the research process, from research ideas to papers, open access to data, codes, and software. Open science is actually a democratic way of making research ideas, data, metadata, tools, and outcomes freely available for every researcher and stakeholder. From the researcher point of view, open practices have been reported to give advantages to open new frontiers in science first and foremost (Science|Business network's cloud consultation group, 2019) and provide solutions to urgent societal problems (Palen et al., 2015; Tai and Robinson, 2018); moreover, it allows for gaining more citations, media attention, potential collaborators, and funding opportunities (Eysenbach, 2006; McKiernan et al., 2016, Tennant et al., 2019), and it is vital for leaving a scientific heritage for future generations.
Ecology, being a multidisciplinary science, can surely benefit from the open-science approach, which has only been a matter of interest and discussion among ecologists for the last decade (Reichman et al., 2011). However, the cultural shift from “data ownership to data stewardship” is not widely accomplished and data sharing standards, both from a technical and ethical point of view, have just started to be established (Hampton et al., 2015).
The open-science approach is fostered in the data management plans of the Long Term Ecological Research (LTER) networks, at the national, European (LTER-Europe: http://www.lter-europe.net/, last access: February 2020), and global level (International LTER, ILTER: https://www.ilter.network, last access: February 2020), and is considered a crucial step towards advancing socio-ecological research and education (Mirtl et al., 2018). ILTER provides a globally distributed network of long-term research sites for multiple purposes and uses in the fields of ecosystem, biodiversity, and socio-ecological research, and it currently consists of 44 national networks, managing more than 700 sites worldwide (Haase et al., 2018; Mirtl et al., 2018). LTER-Italy (http://www.lteritalia.it/, last access: February 2020) has been a formal component of ILTER and LTER-Europe since 2006 and consists of 79 research sites, organized in 25 parent sites, which include terrestrial, freshwater, transitional, and marine ecosystems, and managed and coordinated by public research, monitoring institutions, and universities (Bergami et al., 2018).
The LTER marine component, which represents around 10 % of global ILTER sites, focuses mainly on ecosystem structure and function, in response to a wide range of environmental forcing factors, using long-term, site-based research. As a result of the wide range and the exceptional rate and intensity of human impact on the environment, the scientific value of long-term ecological observations is more crucial than ever for effective assessment, management, and prediction of the state and pressure in the marine environment. The creation and maintenance of marine ecological observatories, able to arrange and maintain integrated, harmonized, and coherent long-term ecological observations, is actually stressed as a relevant step at the European level for sustaining European marine policies (Benedetti-Cecchi et al., 2018; European marine Board, 2019).
The marine component of LTER-Italy is made up of eight parent sites, mainly representing transitional and coastal ecosystems. Among them, the NAS is a significant geographical zone for the establishment of a marine ecological observatory, due to the concomitant presence of sensitive habitats, numerous ongoing monitoring and research activities, and heavy and diversified human pressures and economic interests. For these main reasons, during the years 2017–18, the Italian national flagship project RITMARE (“Italian research for the sea”, http://www.ritmare.it/, last access: February 2020), funded by the Italian Ministry of University and Research, dedicated a line of research to the establishment of a marine ecological observatory in the NAS. Building on the existing facilities, infrastructure, and long-term ecological data, this aims to enhance marine observational capacities and activate synergies among the main conservation management questions and key ecological and oceanographic variables.
During this process, it was crucial to start applying open-science principles by creating an open-research life cycle, which foresees sharing each step of the process, from ideas and results (scientific papers) to data (raw and processed), metadata, and methods and software. The ideas and plans for the development of the open-science principles to the NAS ecological observatory, which we named project “EcoNAOS” (Ecological Northern Adriatic Open Science Observatory System), are thoroughly described by Minelli et al. (2018).
This paper represents one relevant step of this wider activity. The database that we present is composed of observations on abiotic (physical and chemical) parameters and phytoplankton and zooplankton abundances, collected over 50 years (from 1965 to 2015) during cruises that focused on different sampling stations across the NAS and in the Gulf of Venice in particular. Here we describe the sampling and analytical activities, the parameters, and the structure of the database.
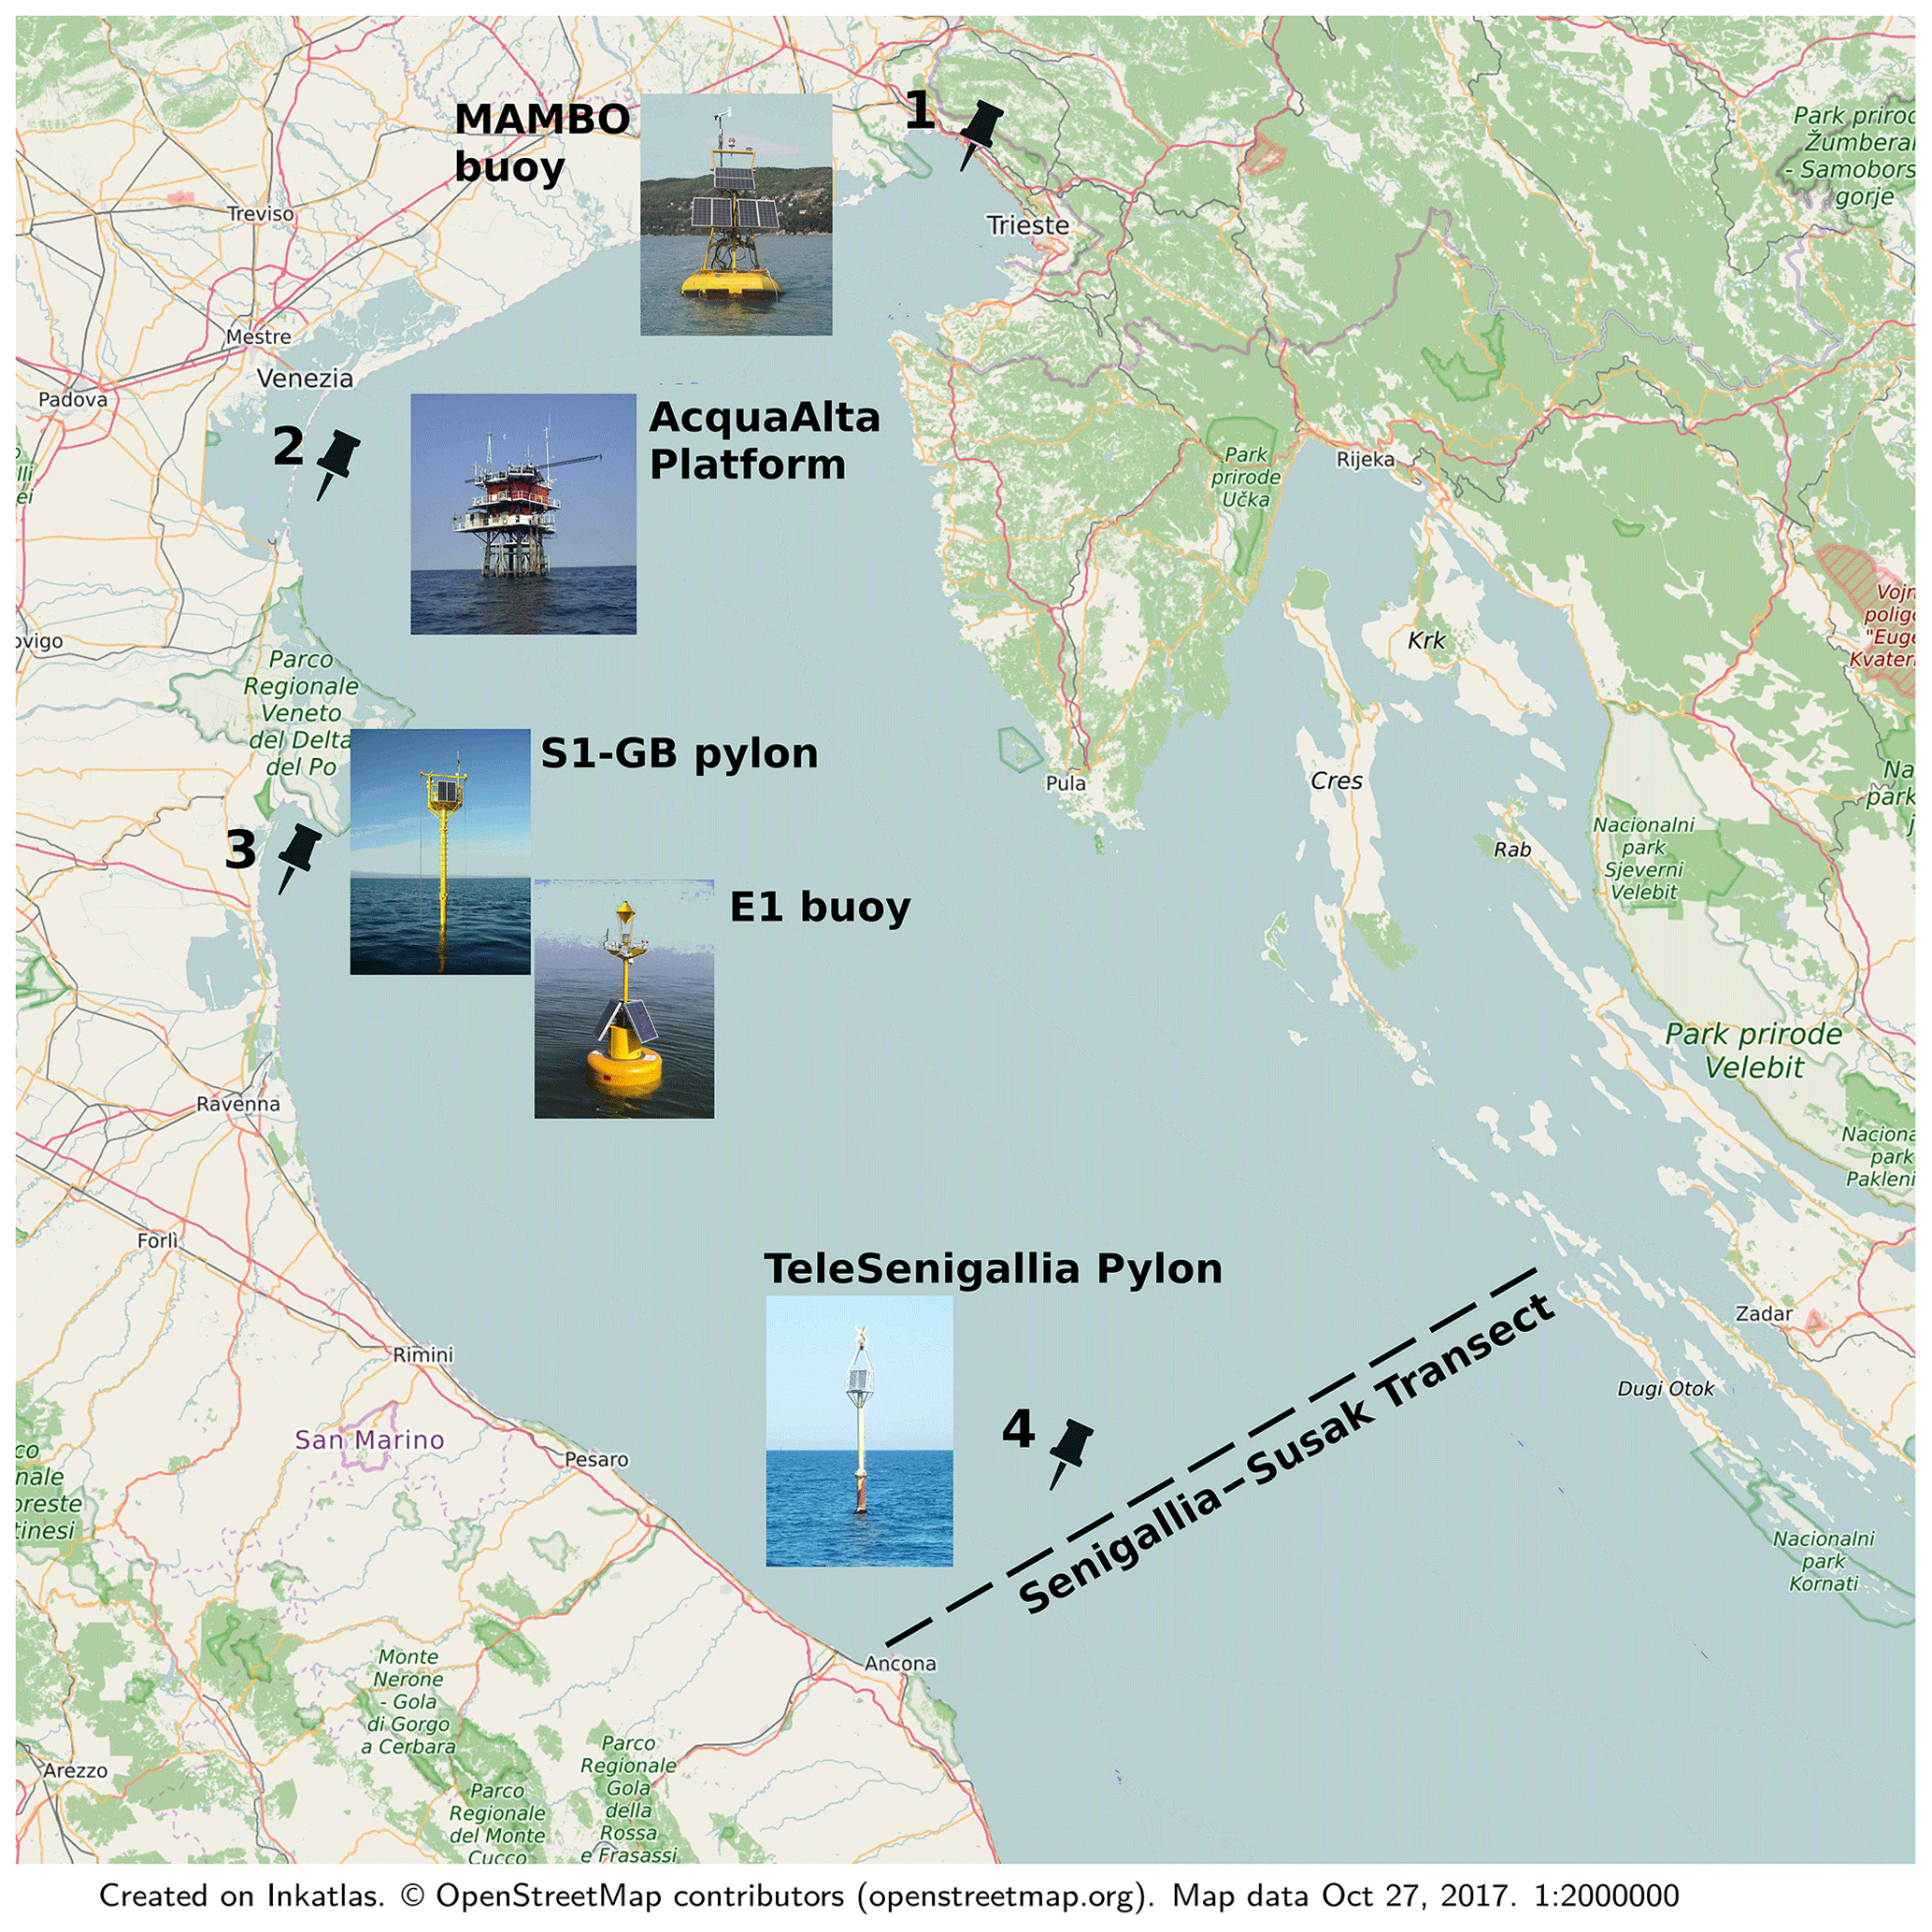
Figure 1The LTER-Italy Northern Adriatic Sea parent site, with its four research sites: 1 – Gulf of Trieste; 2 – Gulf of Venice; 3 – Po Delta and Romagna Coast; 4 – Senigallia–Susak Transect. The fixed-point observatories at each research site are shown (see Ravaioli et al., 2016, for a full description). Base map credits: © OpenStreetMap contributors 2019. Distributed under a CC-BY-SA License.
The NAS (Fig. 1) is the northernmost basin of the Mediterranean Sea and one of its most productive areas. It is characterized by a shallow depth and by a dominant cyclonic circulation. The oceanographic and meteorological parameters show a marked seasonal and interannual variability. The major forcings of the system are represented by the remarkable river inputs along the Italian coast, the Eastern Adriatic Current (EAC), which brings high salinity and oligotrophic waters from the southern basin, and the notable sea-level range, relative to the rest of the Mediterranean area. The urban and industrial inputs and the hydrodynamic exchange between the NAS and the lagoons located along the Italian coast are also elements of ecological relevance. A trophic gradient, decreasing from northwest to southeast, is typically observed in the basin, in which the nutrient-rich waters coming from the rivers are mainly spread southward and eastward from the Italian coast (Bernardi Aubry et al., 2006; Solidoro et al., 2009). The NAS is subject to multiple anthropogenic impacts (e.g. nutrient inputs, coastal urbanization, fishing activity, tourism, and maritime trade). The basin has experienced overfishing (Fortibuoni et al., 2010) and marked eutrophication (during the 1970s; Giani et al., 2012), followed by a phase of oligotrophication (during the 2000s; Mozetič et al., 2010) and a recent increase in nutrient concentrations (since 2007; Totti et al., 2019). The NAS has also been subjected to frequent development of mucilage aggregates (Giani et al., 2005; De Lazzari et al., 2008), until the 2000s.
The LTER-Italy parent site NAS includes four research sites (Gulf of Trieste, Gulf of Venice, Po Delta and Romagna Coast, Senigallia–Susak Transect; Fig. 1), where meteo-oceanographic and biological data, mainly regarding plankton (Table 2), are gathered both during oceanographic cruises and at fixed-point observatories. Detailed information can be found on the ILTER Dynamic Ecological Information Management System Site and Dataset Registry, DEIMS-SDR (https://deims.org/92fd6fad-99cd-4972-93bd-c491f0be1301, last access: February 2020) (Wohner et al., 2019). The database we describe here refers to an area of about 40 000 km2, ranging between 43.7 and 45.8∘ N and 12.2 and 14.3∘ E (coordinate reference system: WGS84).
The database described in this data paper is composed of 108 687 records. Each record is intended as a timestamped and georeferenced set of information, individuated by a row in the database. These observations belong to 22 datasets coming from 299 oceanographic cruises carried out from 1965 to 2015.
Due to the long time coverage, the collection and analysis system for many parameters changed over time, thus making the database very heterogeneous concerning data management and organization. The heterogeneity is mainly due to the following factors.
-
Sampling frequency. For example, data coming from CTD (conductivity, temperature, depth) sensors, such as temperature, oxygen, and pH, are registered in real time at each metre in depth; other parameters, like nutrients and phytoplankton, are sampled at a lower time frequency and at variable depths. The overall depth coverage ranged between 0 and 63 m, the sampling frequency from monthly to seasonal.
-
Data treatment. Some data are basically raw; e.g. data registered by CTD are reported into the database as they are delivered from the instrument. Other data need some elaboration to obtain a specific parameter's value (e.g. nutrients, chlorophyll a, plankton abundance).
-
Methodologies and units of measurements. For example, changes of methodologies due to the introduction of CTD measurements or a change of the units of measure of salinity, which passed from g L−1 to a dimensionless parameter.
-
Data format. Data collected between 1965 and 1990 were registered only in paper archives, while those from 1990 onwards are recorded in spreadsheets.
In particular, methodological protocols and associated documentation changed over time. Several sensors are described and extensively documented through the GET-IT platform (Geoinformation Enabling ToolkIT starterkit®; see Sect. 5), where it is possible to visualize all the observations related to a specific instrument or method. Other protocols have undergone a deep mediation process by analysing ancillary historical metadata (Scovacricchi, 2017). In this case, it is not immediately possible to obtain data related to a specific protocol, but it is still possible to methodically filter data by importing the .csv file in a spreadsheet.
3.1 Data sources and geographical coverage
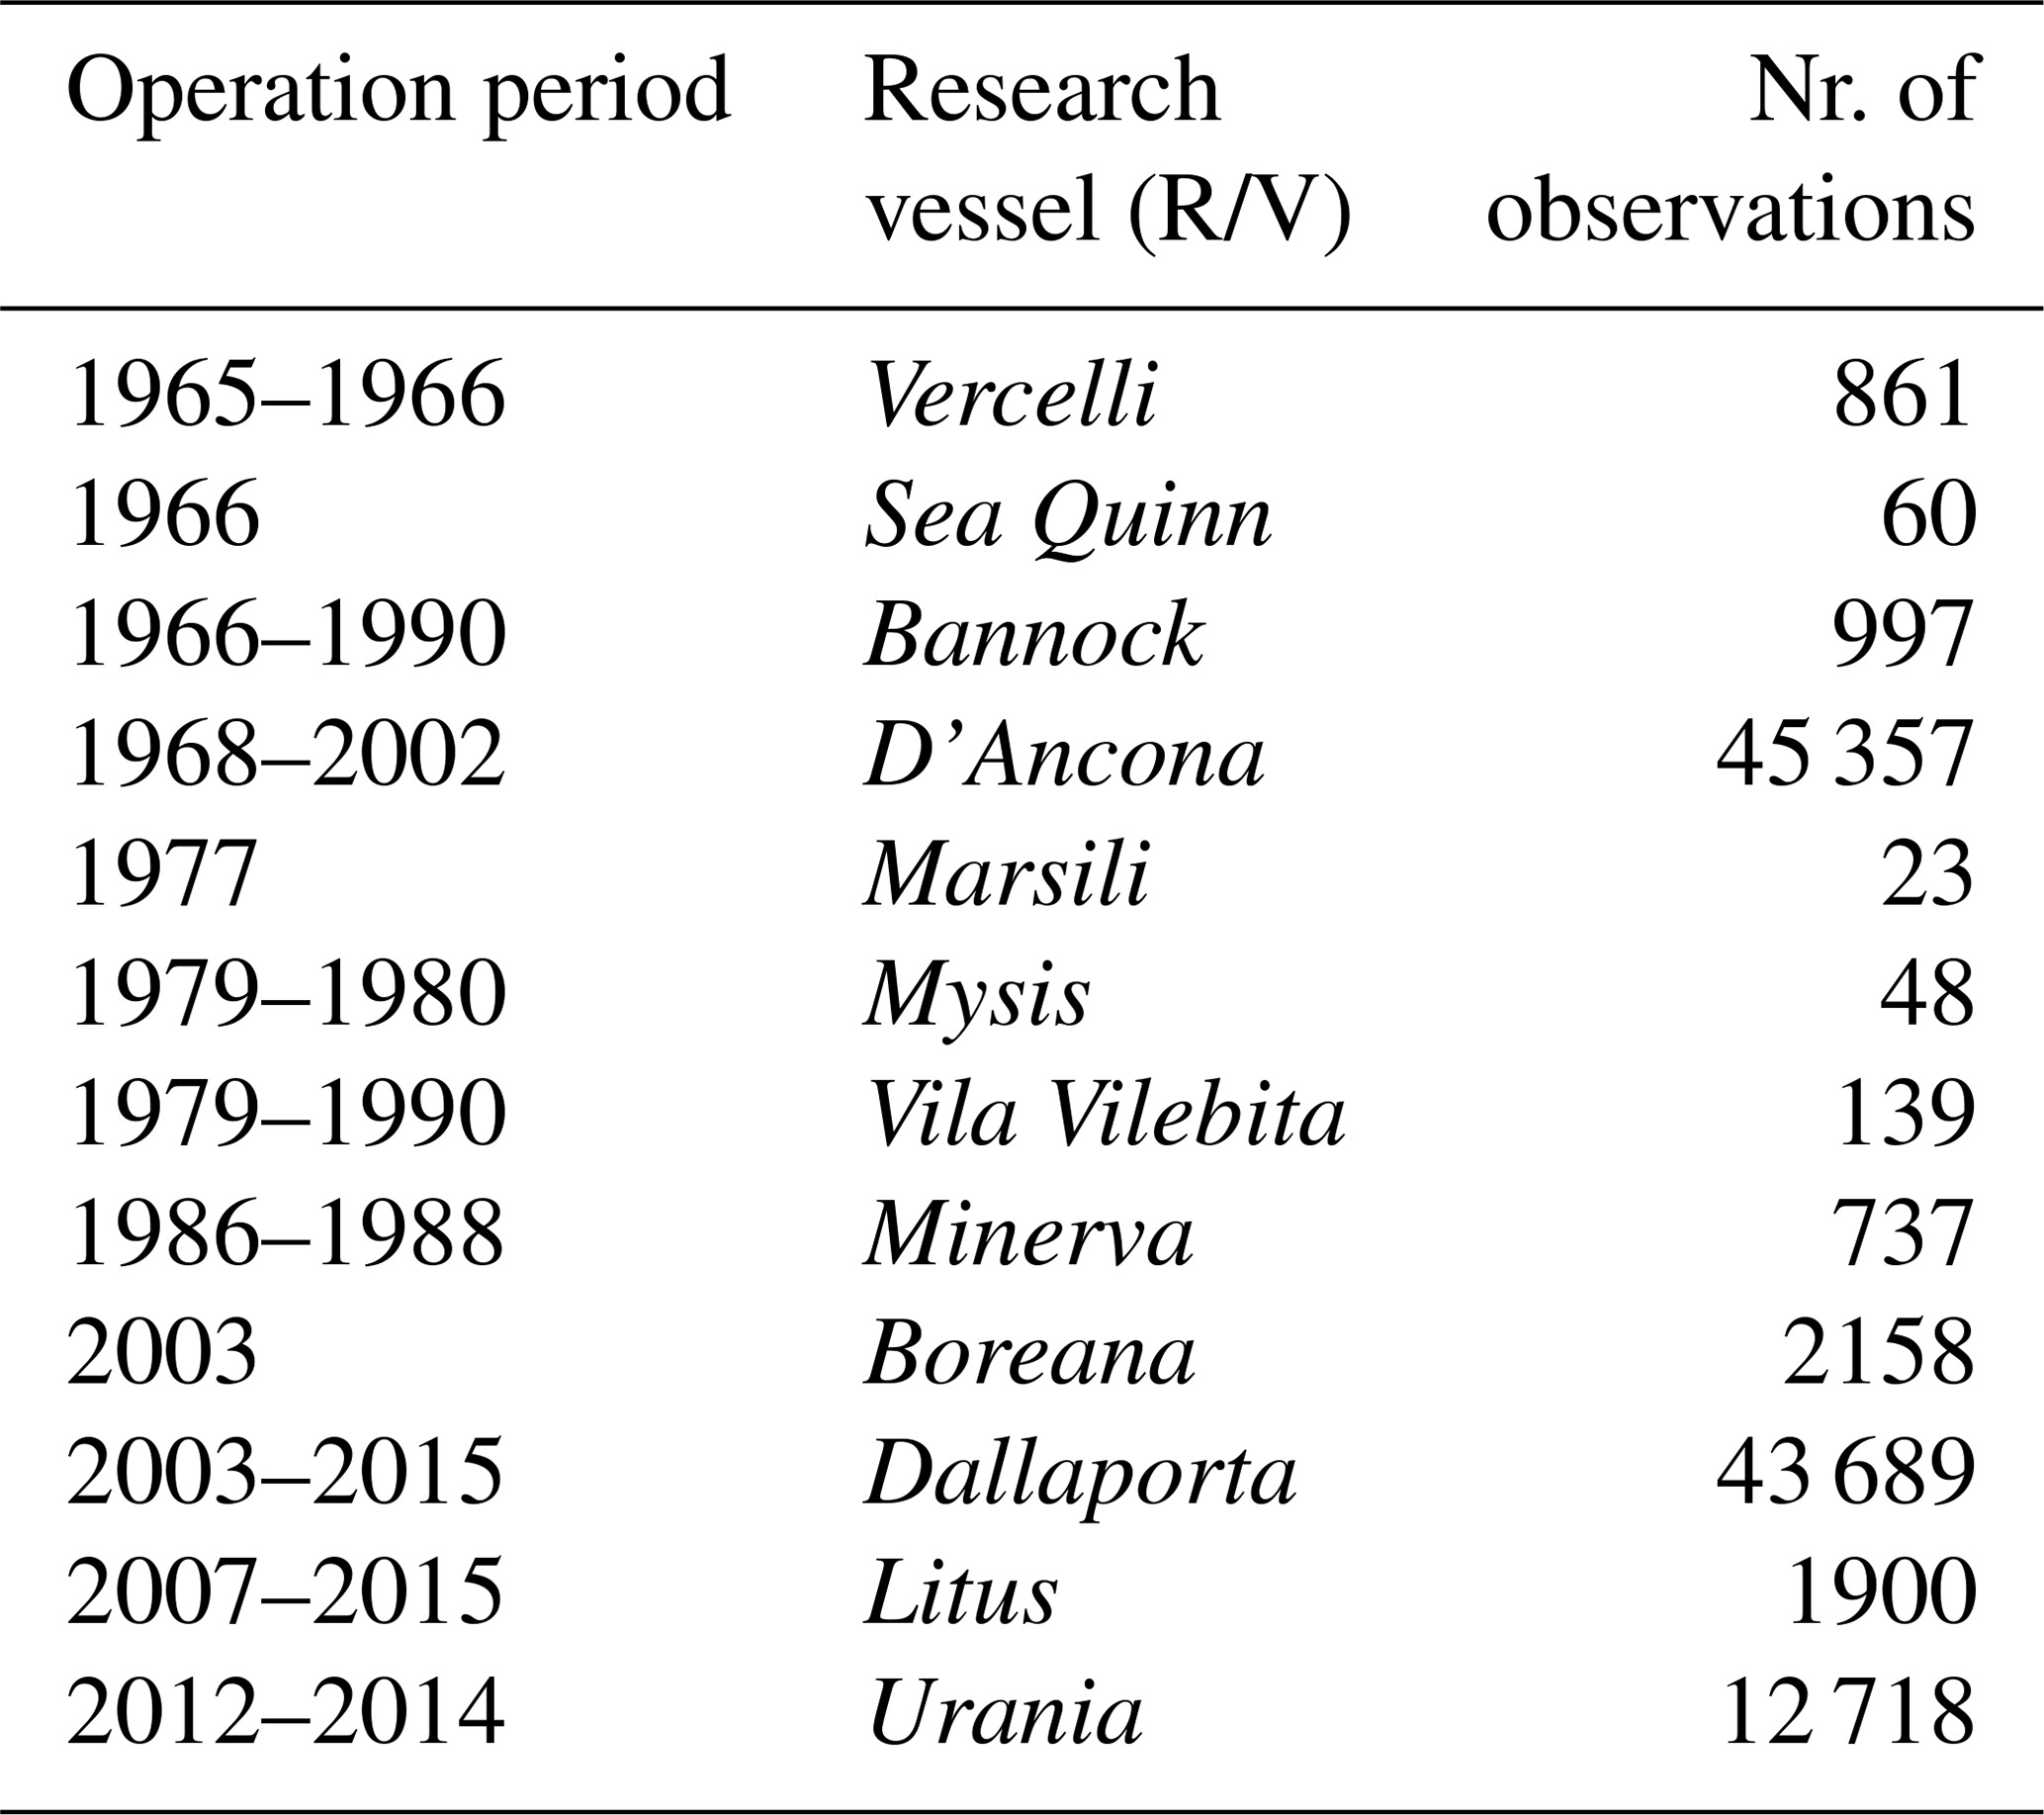
Data sources for this database come mainly from oceanographic cruises that were carried out on 12 different research vessels, at the basin scale (Table 1). The other observations come from sampling stations located next to the fixed automatic sensors: in this case the cruises are named as the nearby sensor, i.e. 576 observations at the Paloma buoy (Gulf of Trieste), 1284 at the Acqua Alta oceanographic tower (Gulf of Venice), 138 at the S1 buoy (Po Delta). The data were gathered in the frame of many different projects that are all mentioned in the database.
Table 1Operation periods of the different research vessels between 1965 and 2015 and number of observations.
Until the early 1990s, GPS systems were not usually found on board research vessels. For this reason, oceanographers used to refer to a fixed grid covering the entire research area and identified the sampling positions (stations) with the nodes of this grid. An example of a grid used for this purpose is shown in Fig. 2 (Franco, 1972).
In Fig. 3a, the geographical coverage of the entire database is shown. Red dots represent the real observation points, while the nodes of the grid are indicated with black crosses. Observations referring to a specific station were assigned to the coordinates of the corresponding node on the grid even if the real position was not precisely located on the grid node. This resulted in a cloud of points near each sampling station. Since our main aim was to preserve most of the information for each observation, we decided not to “correct” the position of these points (see an example in Fig. 3b for the station 09/0E).
In the following years, when GPS allowed for better precision in the sampling position, researchers often continued referring to the nodes of the grid for the station names and, as a result, they adopted a nomenclature coherent with the one of the original grid for new sampling stations as well. For example, the new sampling point located east of the 09/2E station is named 10/2E, since it is located at the same longitude (2E) but a different latitude to 09/2E station (Fig. 3b). In Fig. 3c, a 3-D view of the entire database is shown.
Due to transcription errors that occurred during the oldest cruises, some data were misplaced, either falling on land or outside the NAS. A Python script (available under GNU GPL v.3 License here: https://github.com/CNR-ISMAR/econaos/tree/master, last access: February 2020) has been written and published in Zenodo (https://doi.org/10.5281/zenodo.3600991, Minelli, 2020) in order to correct this kind of error. The same script also implemented a routine to homogenize different names of the same sampling station (e.g. station “020D” could appear as station “02-0D”, “02/0D”, or “020D_07/07/1968). We selected the name reported on the original stations' network grid (Fig. 2) and we created from these stations a vector layer (black crosses in Fig. 3). Finally, since some stations changed their name over time, in order to maintain coherence with the same sampling point, we used their most recently used name.
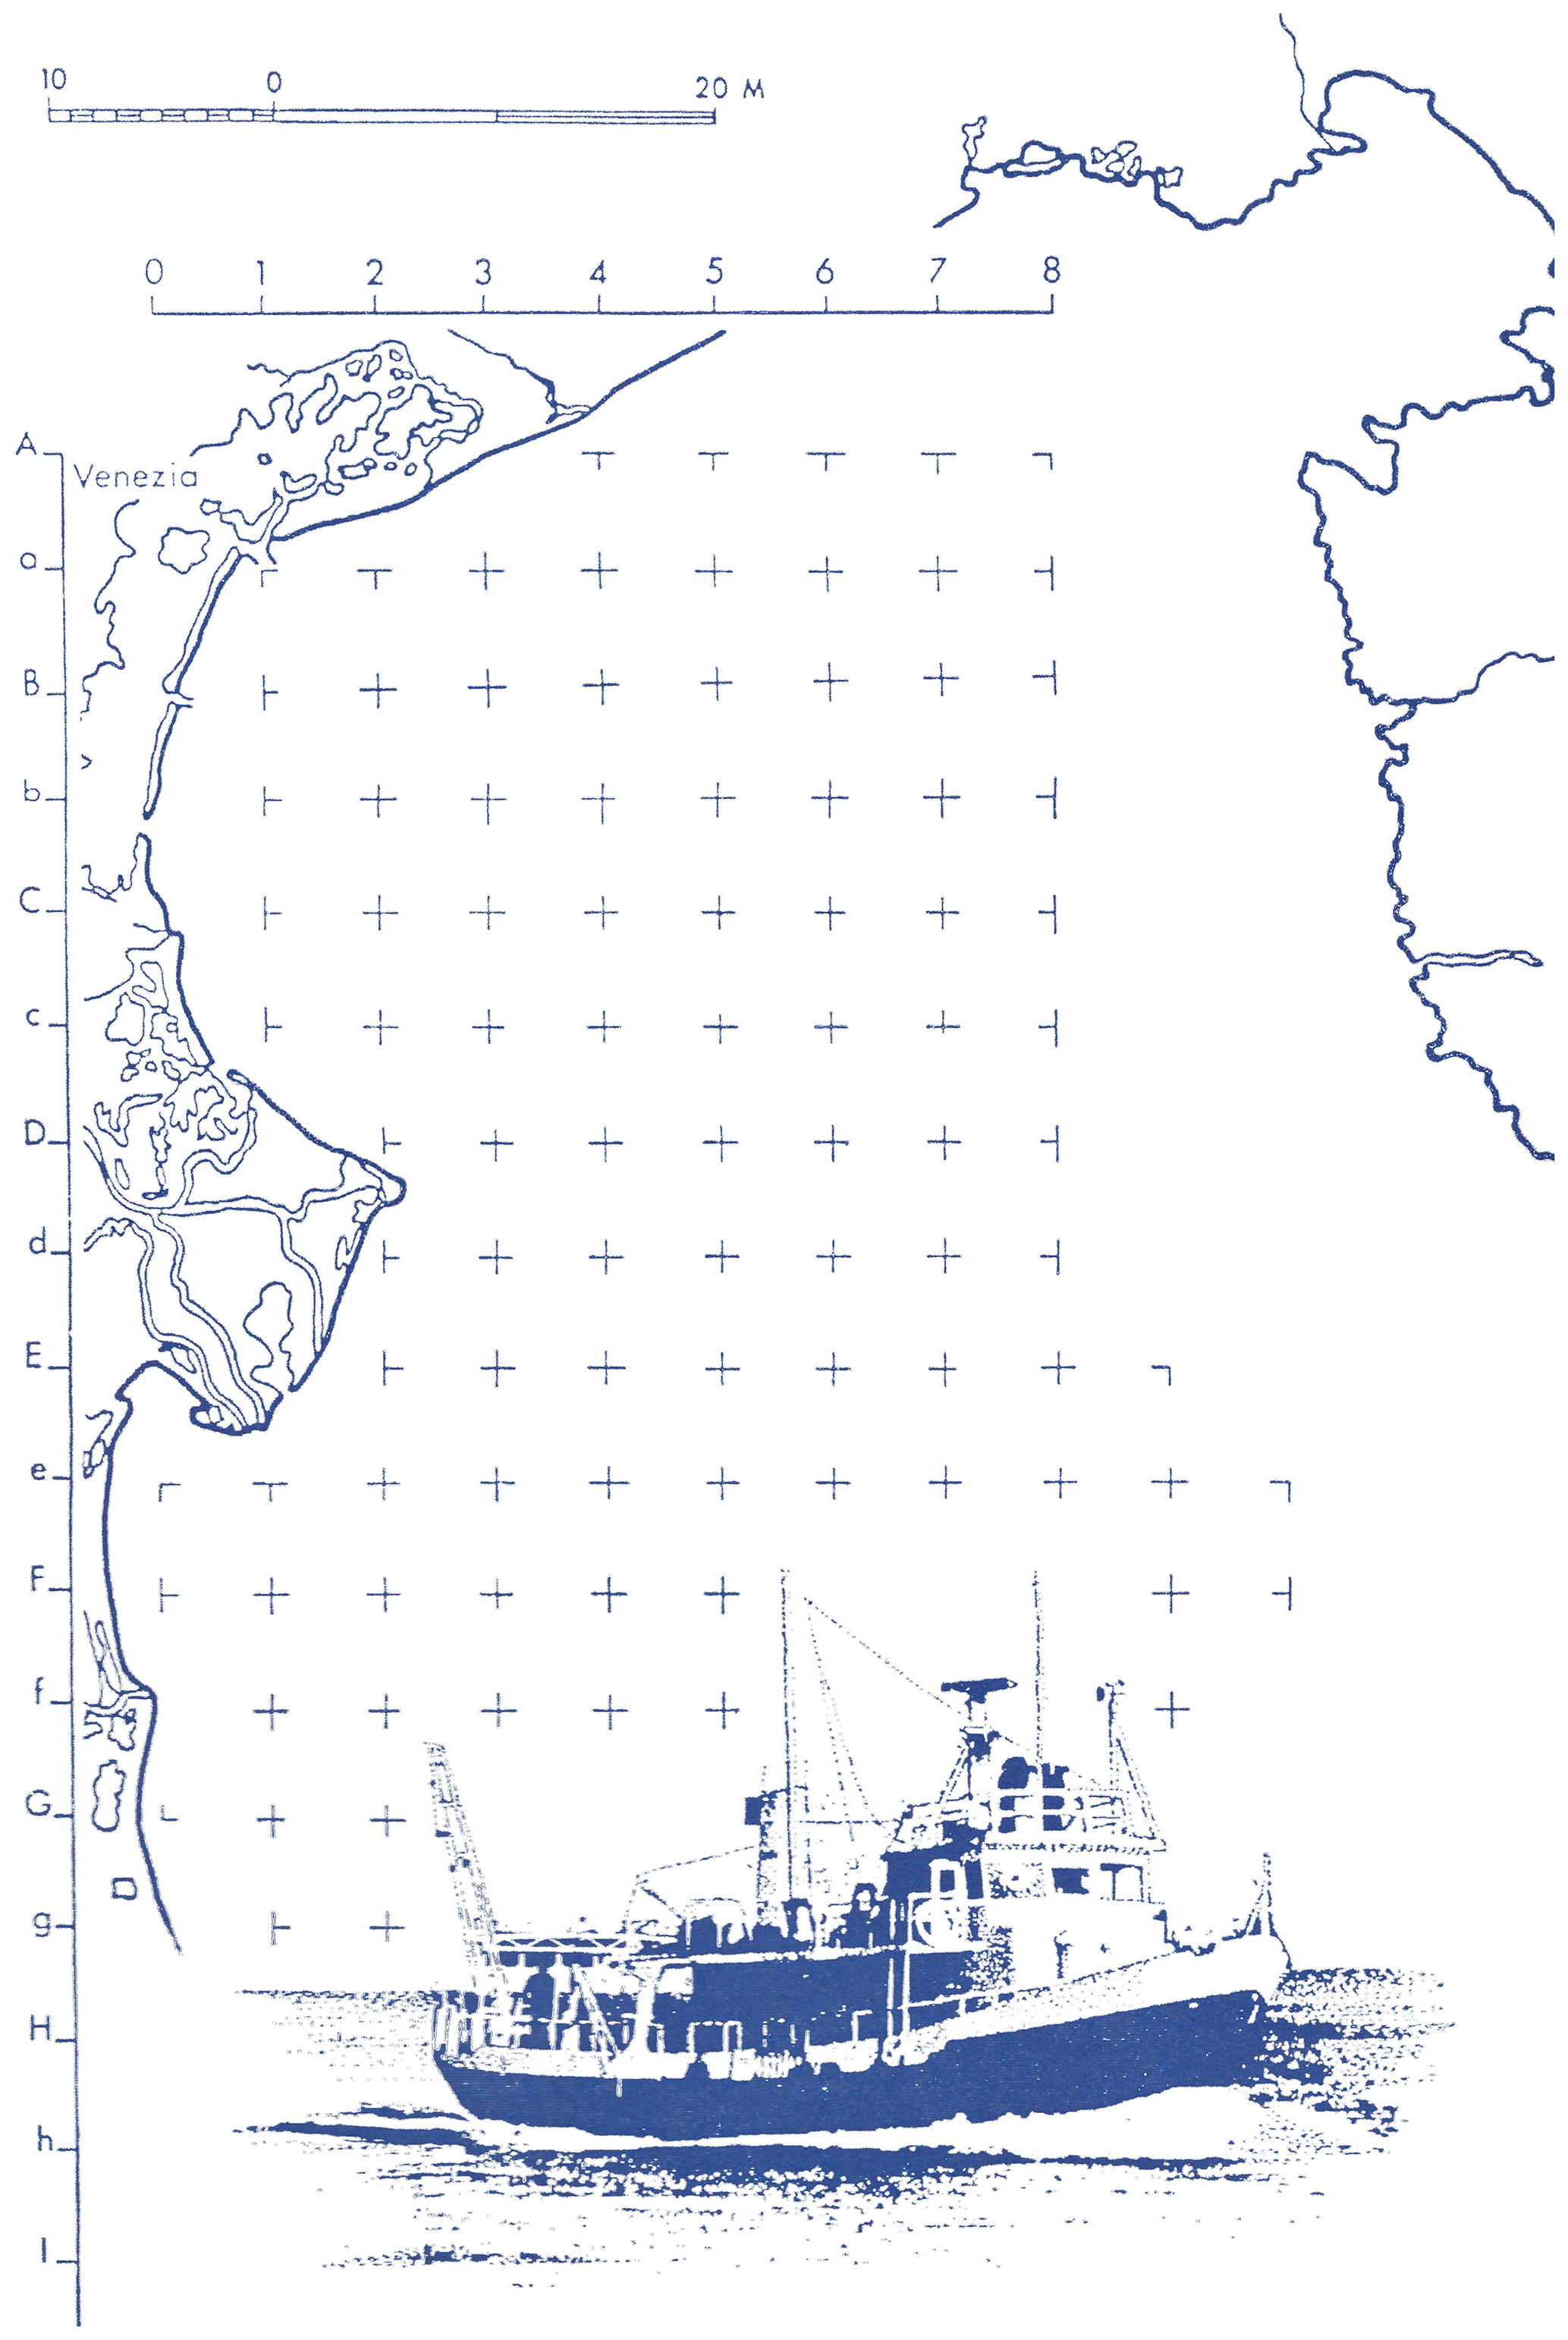
Figure 2An example of sampling stations based on the regular grid created in the NAS for the cruises from 1966 to 1980 (from Franco, 1972).
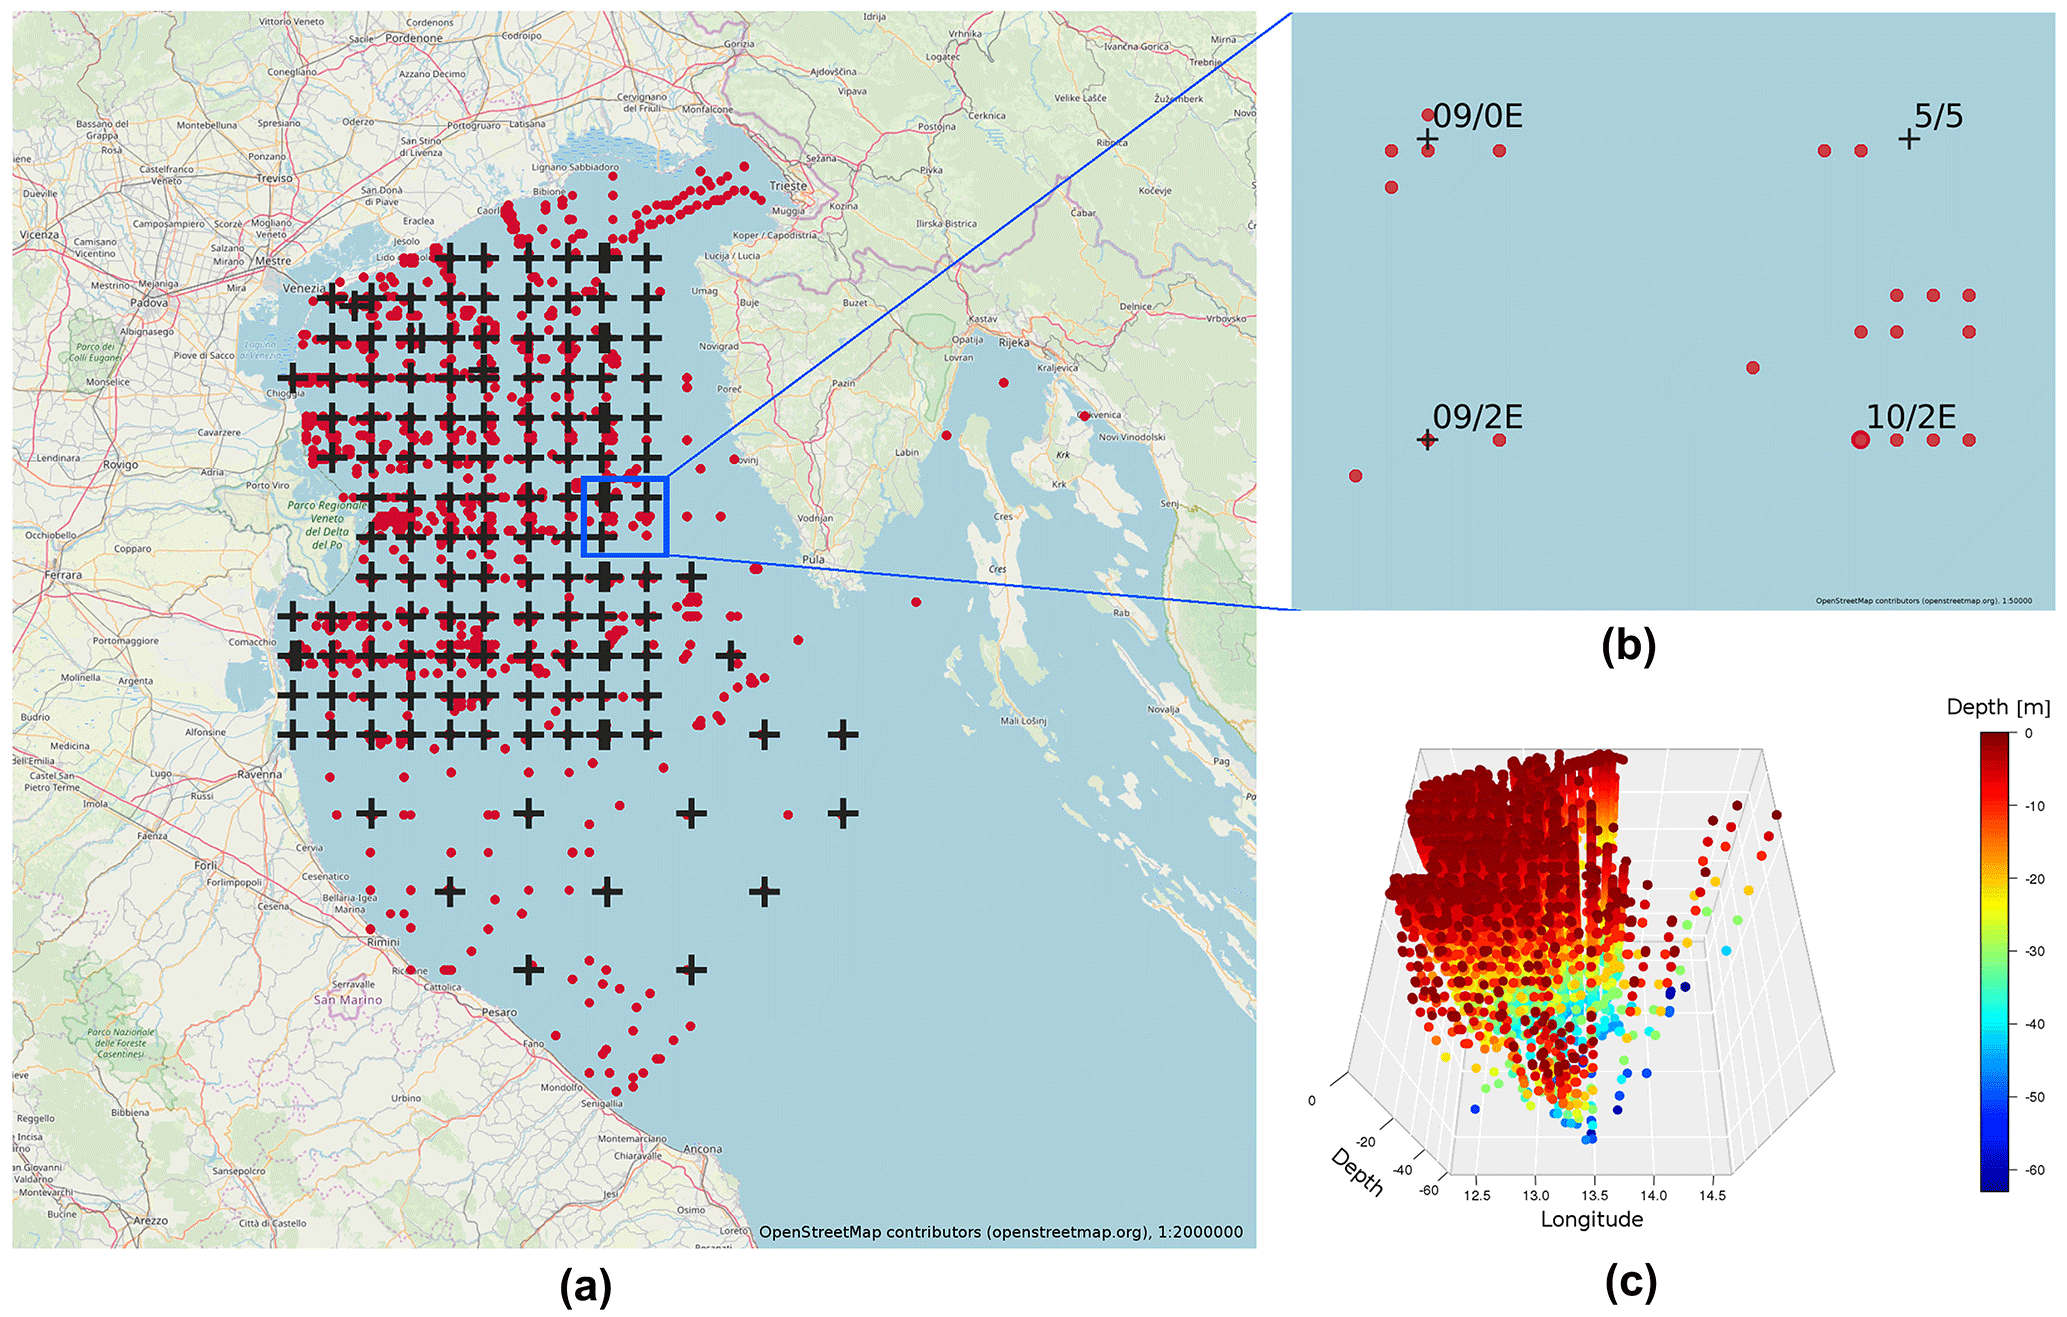
Figure 3(a) Geographical distribution of the observations: red dots for observations and black crosses for nodes of the grid. (b) Example of cloud distribution of observations around sampling station 09/2E and the naming of new sampling station 10/2E. (c) A 3-D view of the database. Base map credits: © OpenStreetMap contributors 2019. Distributed under a CC-BY-SA License.
3.2 Parameters: history, time coverage, and sensors
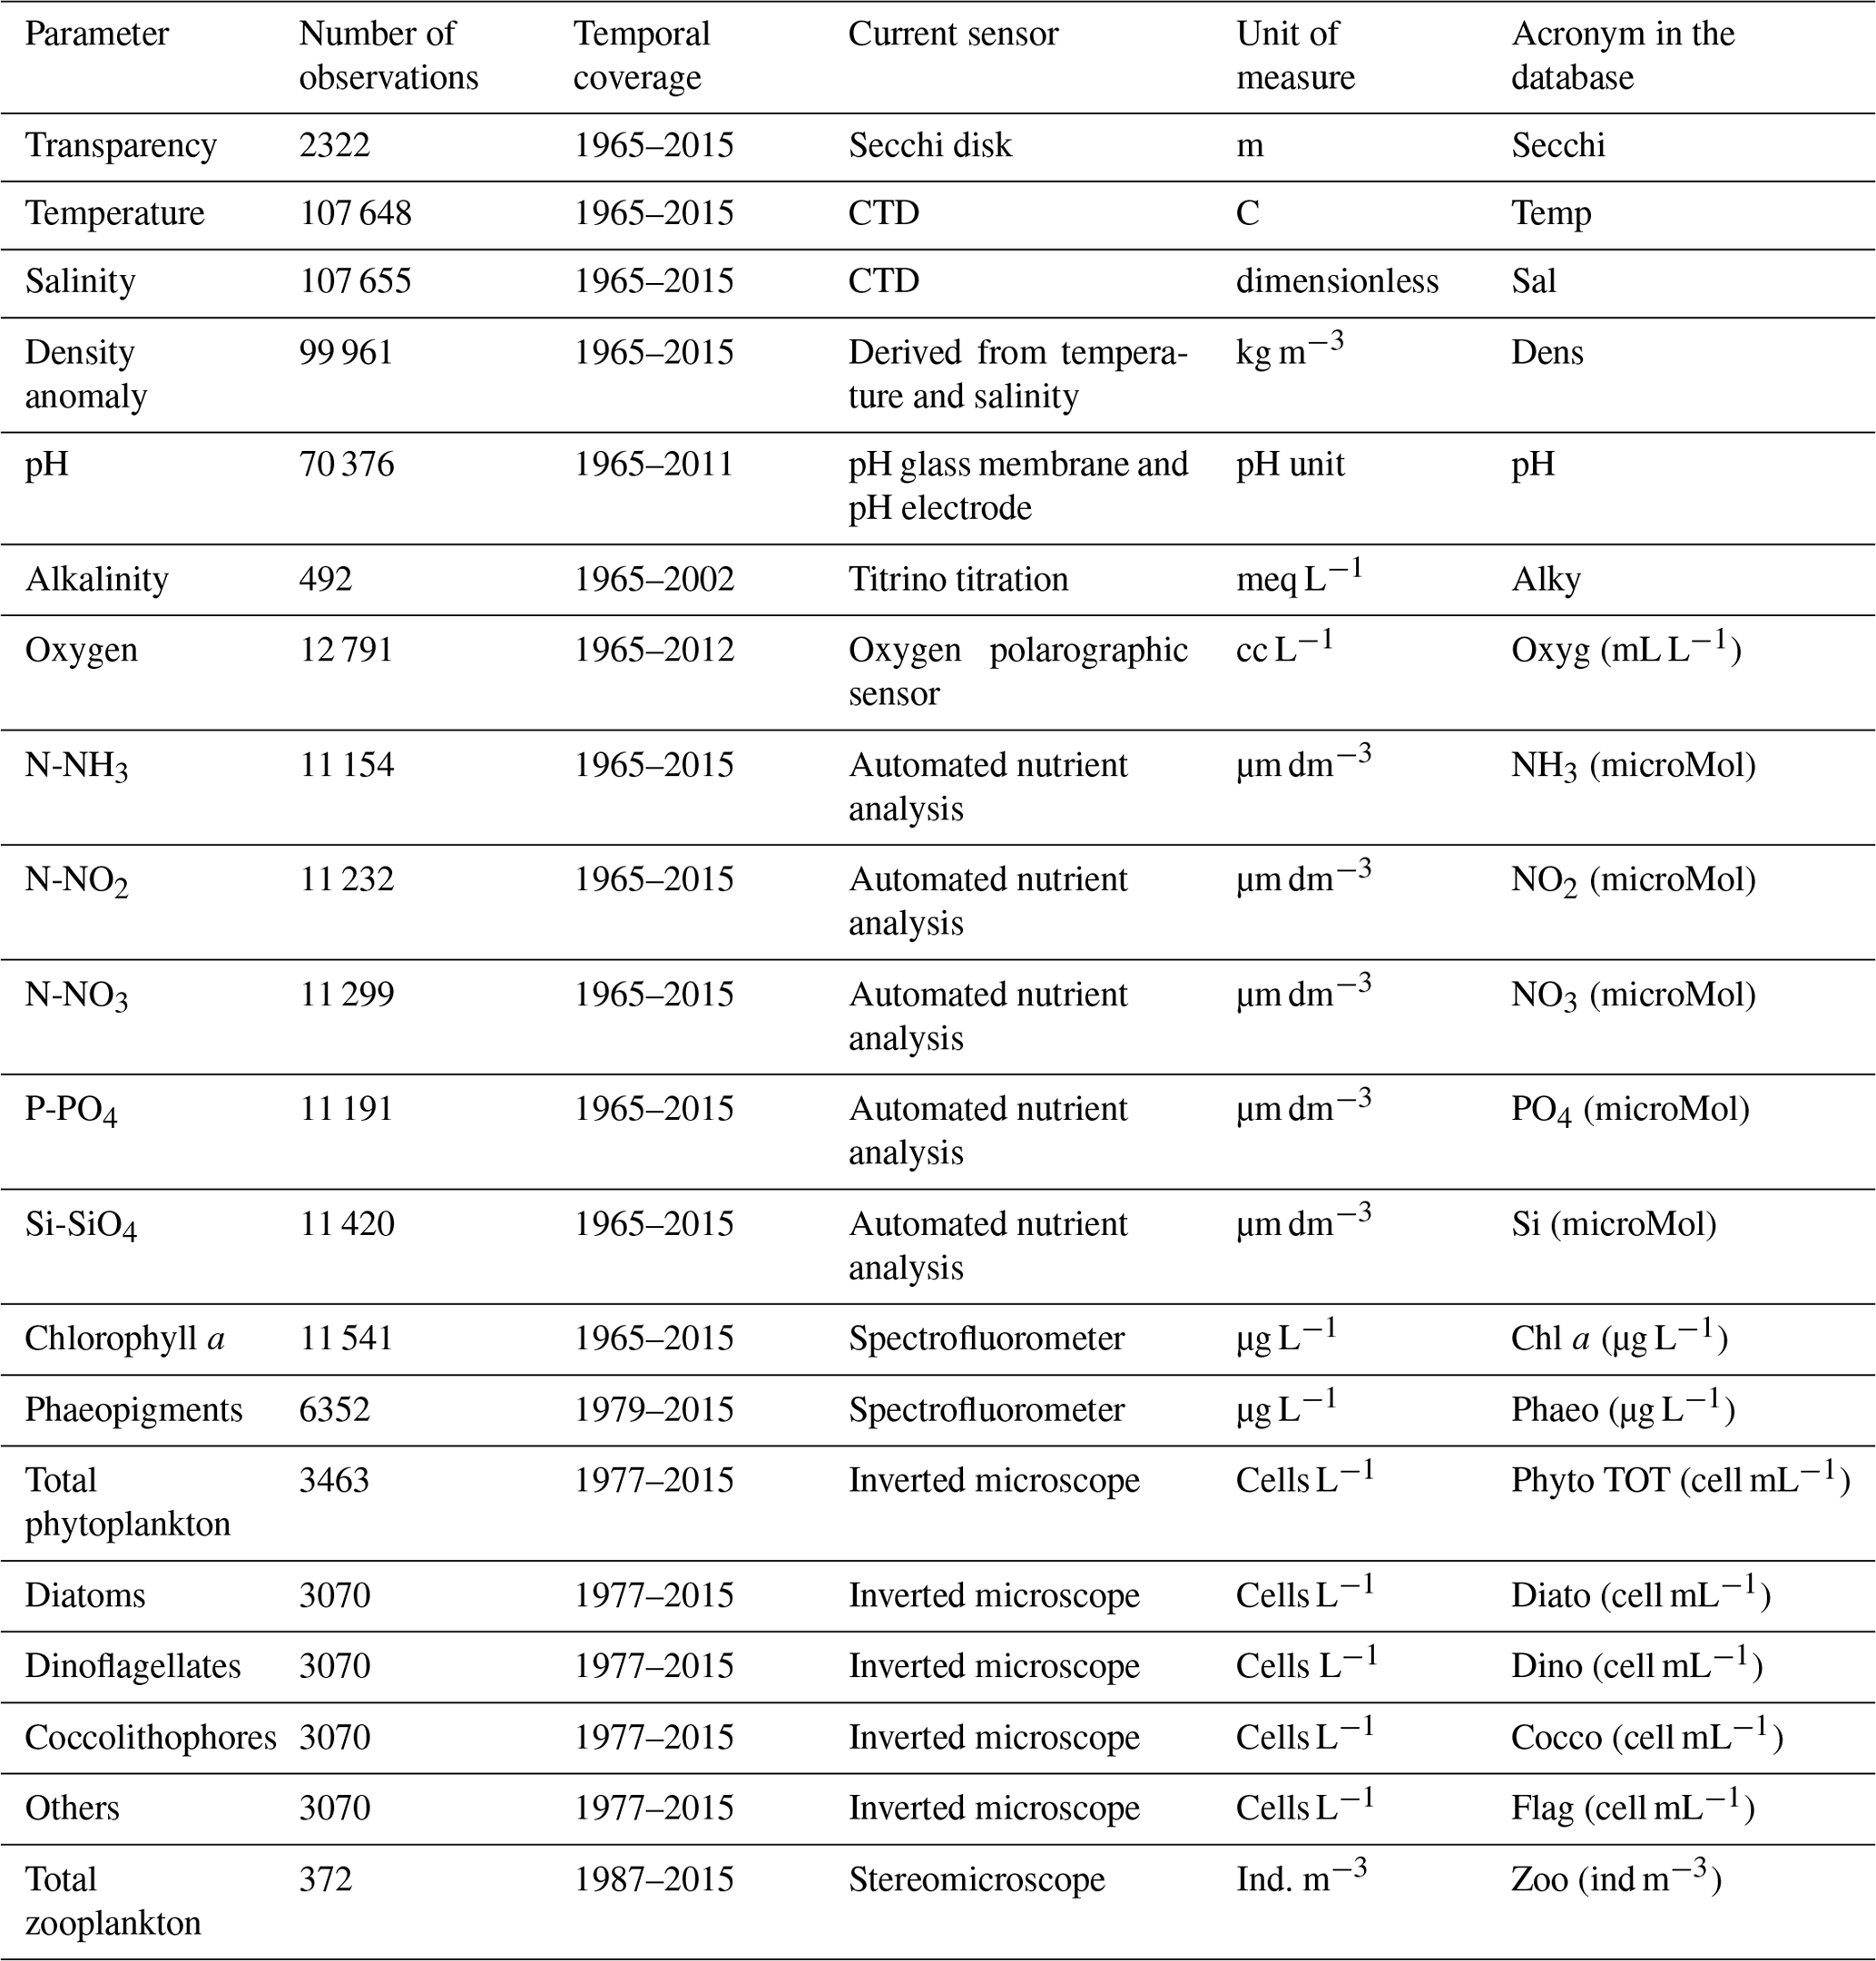
Samples collected during each cruise, whatever the station of collection, were then analysed in the laboratory using diverse techniques. Since 2000, analytical quality of nutrients and chlorophyll analyses is assessed through participation in Quality Assurance of Information for Marine Environmental Monitoring In Europe (QUASIMEME; http://www.quasimeme.org, last access: February 2020) international laboratory proficiency testing. The complete list of the parameters of the database is reported in Table 2, together with the descriptive elements given below:
-
total number of observations,
-
temporal coverage (from the first to the last record),
-
method or sensor currently used,
-
current unit of measure.
Instruments and sensors changed over the 50-year period, due to technological and scientific progress. Furthermore, instruments are also subject to degradation and need to be replaced. It is essential to preserve the information about these instrument changes and upgrades to track the reliability of the measurements.
In order to appropriately document data and guarantee the consistency of data within the database, we collected largest amount of ancillary information possible on the changes that occurred over time for each parameter measurement. For this purpose, a thorough review of historical sources (e.g. logbooks and manual transcriptions in spreadsheets) was carried out (Scovacricchi, 2017), working in cooperation with some researchers, who are now retired, that participated in the first cruises and also by referring to papers by Franco (1970, 1972, and 1982) that describe methods and instruments during a number of oceanographic cruises in the NAS from 1965 to 1979.
Plankton data are particularly sensitive to the skill of the operators, particularly during the microscope analyses of the samples. The change of the operators, which necessarily occurred over the 50-year period, could actually hamper the data comparison across time. To deal with this issue, internal education and recurring calibration of taxonomic competence were carefully considered, with both training periods and intercalibration phases.
Since 2006, the taxonomic revision of the phytoplankton species has been made according to “Algaebase” (https://www.algaebase.org/, last access: February 2020), the global algal database of taxonomic, nomenclatural, and distributional information, and for the zooplankton species the Marine Planktonic Copepods catalogue (https://copepodes.obs-banyuls.fr/en/links.php, last access: February 2020, Razolus et al., 2005–2019) has been used. In the past, for phytoplankton and zooplankton analyses, several texts and monographs were used (Berard-Therriault et al., 1999; Harris et al., 2000; Heimdal, 1993; Hendey, 1964; Hustedt, 1930–1966; Pascher, 1915; Peragallo and Peragallo, 1897–1908; Rampi and Bernhardt, 1980; Schiller, 1931–1937; Throndsen, 1993; Tomas, 1997).
The phytoplankton was gathered and analysed with the same method (Utermöhl, 1958) across the years. In the database we report the total phytoplankton abundances and the following main groups: diatoms, dinoflagellates (naked and armoured cells), coccolithophorids, and “others”, which includes the sum of cells belonging to cryptophyceans, crysophyceans, prymnesiophyceans (except coccolithophorids), prasinophyceans, and chlorophyceans, whose sizes lie between 4 and 20 µm and often remain undetermined. Mesozooplankton was always identified under a stereomicroscope and expressed as the total number of organisms per cubic metre. Compared to phytoplankton, the mesozooplankton data are very fragmented over time: they cover a 28-year period, from 1987 to 2015, for a total of 372 observations.
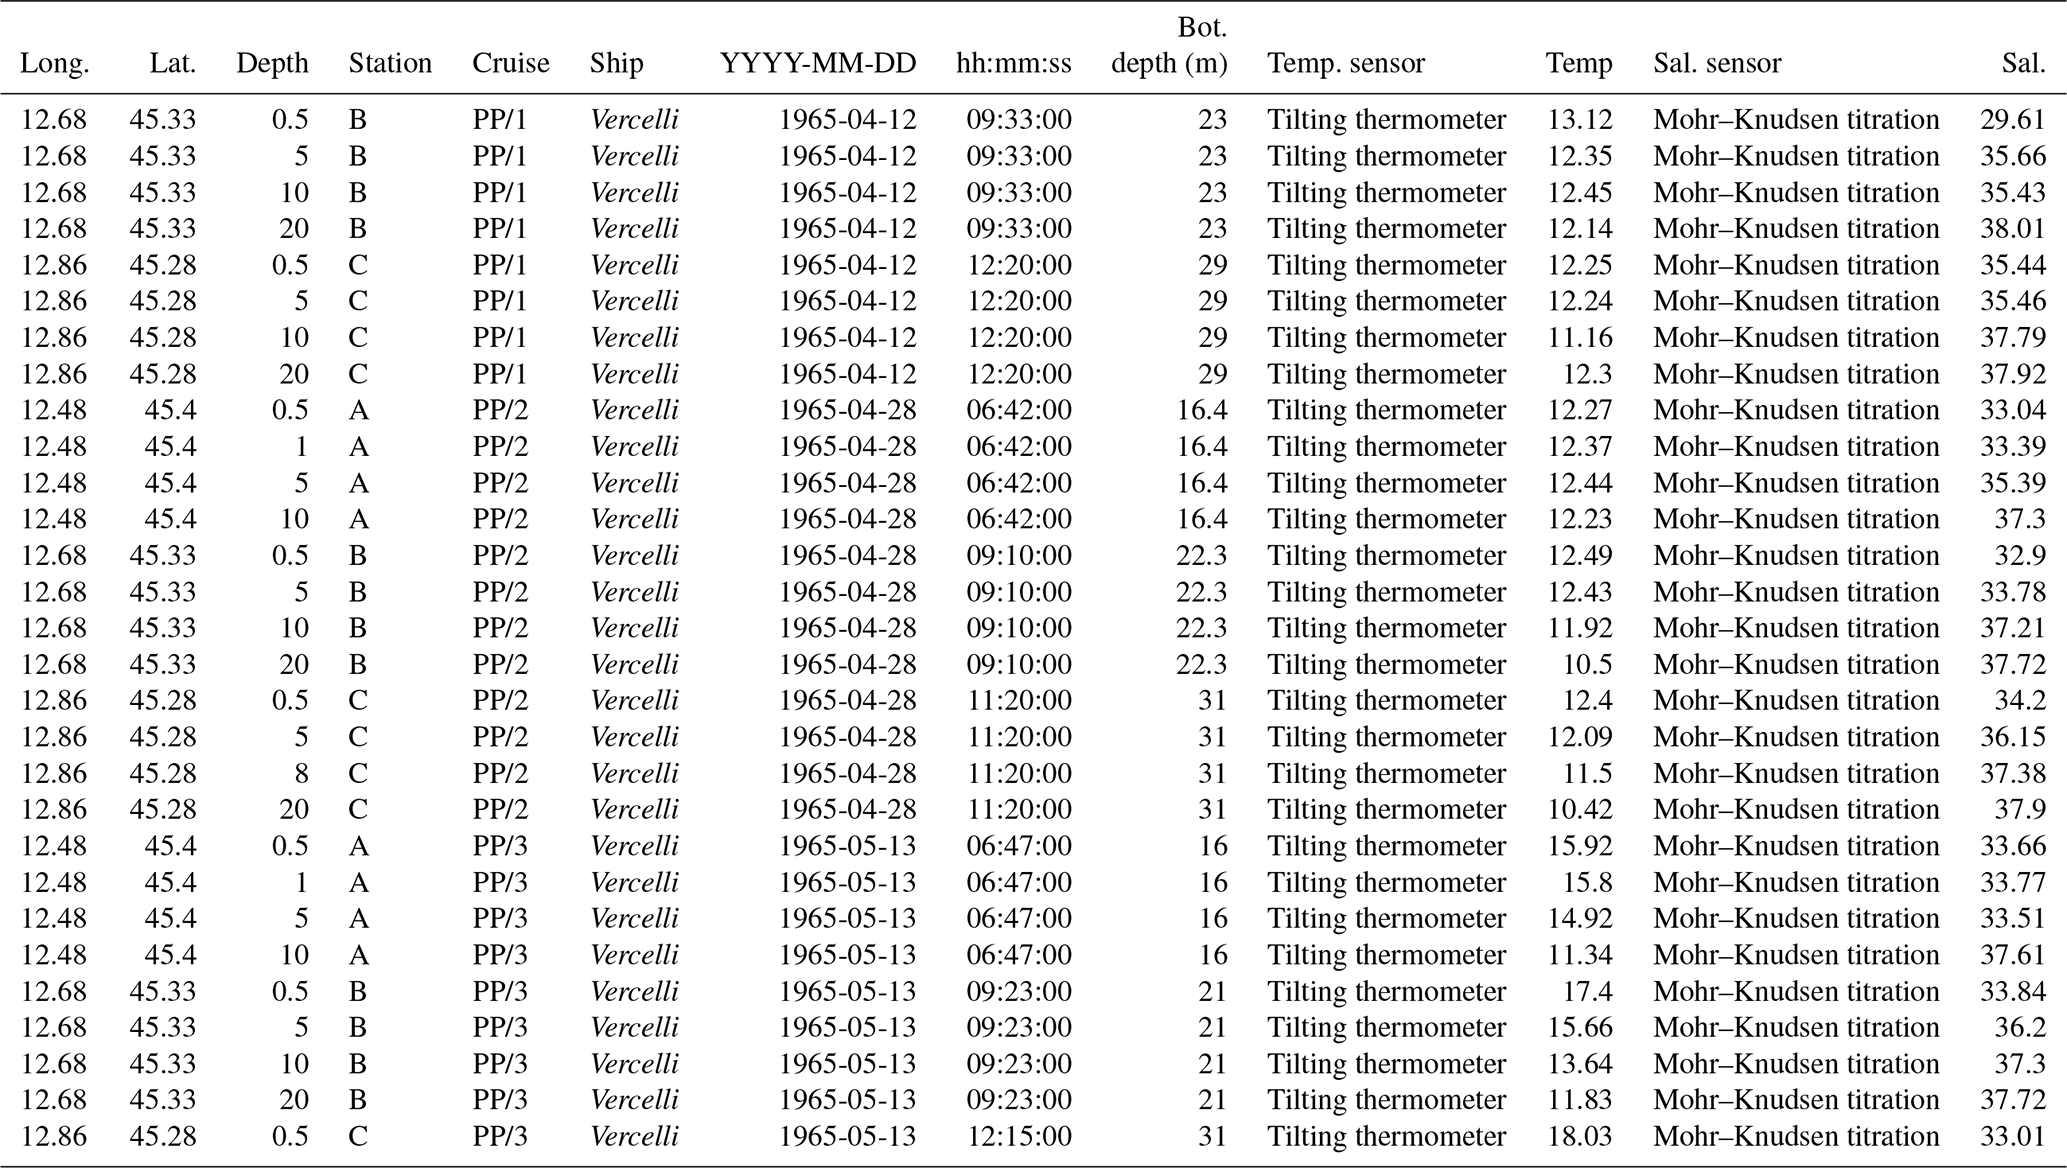
The present version of the database is recorded in a unique spreadsheet (Table 3), carrying information about each record using the following parameters:
-
coordinates (latitude–longitude) of the sampling station,
-
sampling depth,
-
sampling station name,
-
cruise and R/V (ship) name,
-
sampling date and time,
-
water column depth (bot. depth),
-
instrument and method used for each measurement and relative parameter value.
Table 3An example of the database, showing the fields for each observation.
Around 89 % of the observations of the database refer to the years 1999–2015, and the remaining 11 % cover the previous 33 years (see Fig. 4a for details). This is mainly due to the adoption since 1999 of CTD probes for measuring abiotic parameters at each metre depth, leading to an imbalance between the observations before (e.g. 778 in 1978) and after 1999 (e.g. 11 359 in 2004). In Fig. 4b observations from oceanographic cruises on board the different research vessels are shown (see also Table 1). The number of observations of abiotic parameters (nutrients, alkalinity, and transparency) is higher than for biotic parameters (chlorophyll a, phytoplankton, and zooplankton abundances) up until the year 2000; since then, they become comparable (Fig. 4c).
The database presents a heterogeneous number of observations for each parameter, mainly due to (i) parameter priority for the specific research conducted, (ii) the instruments and analytical efforts required, and (iii) the specific funding programmes and resources.
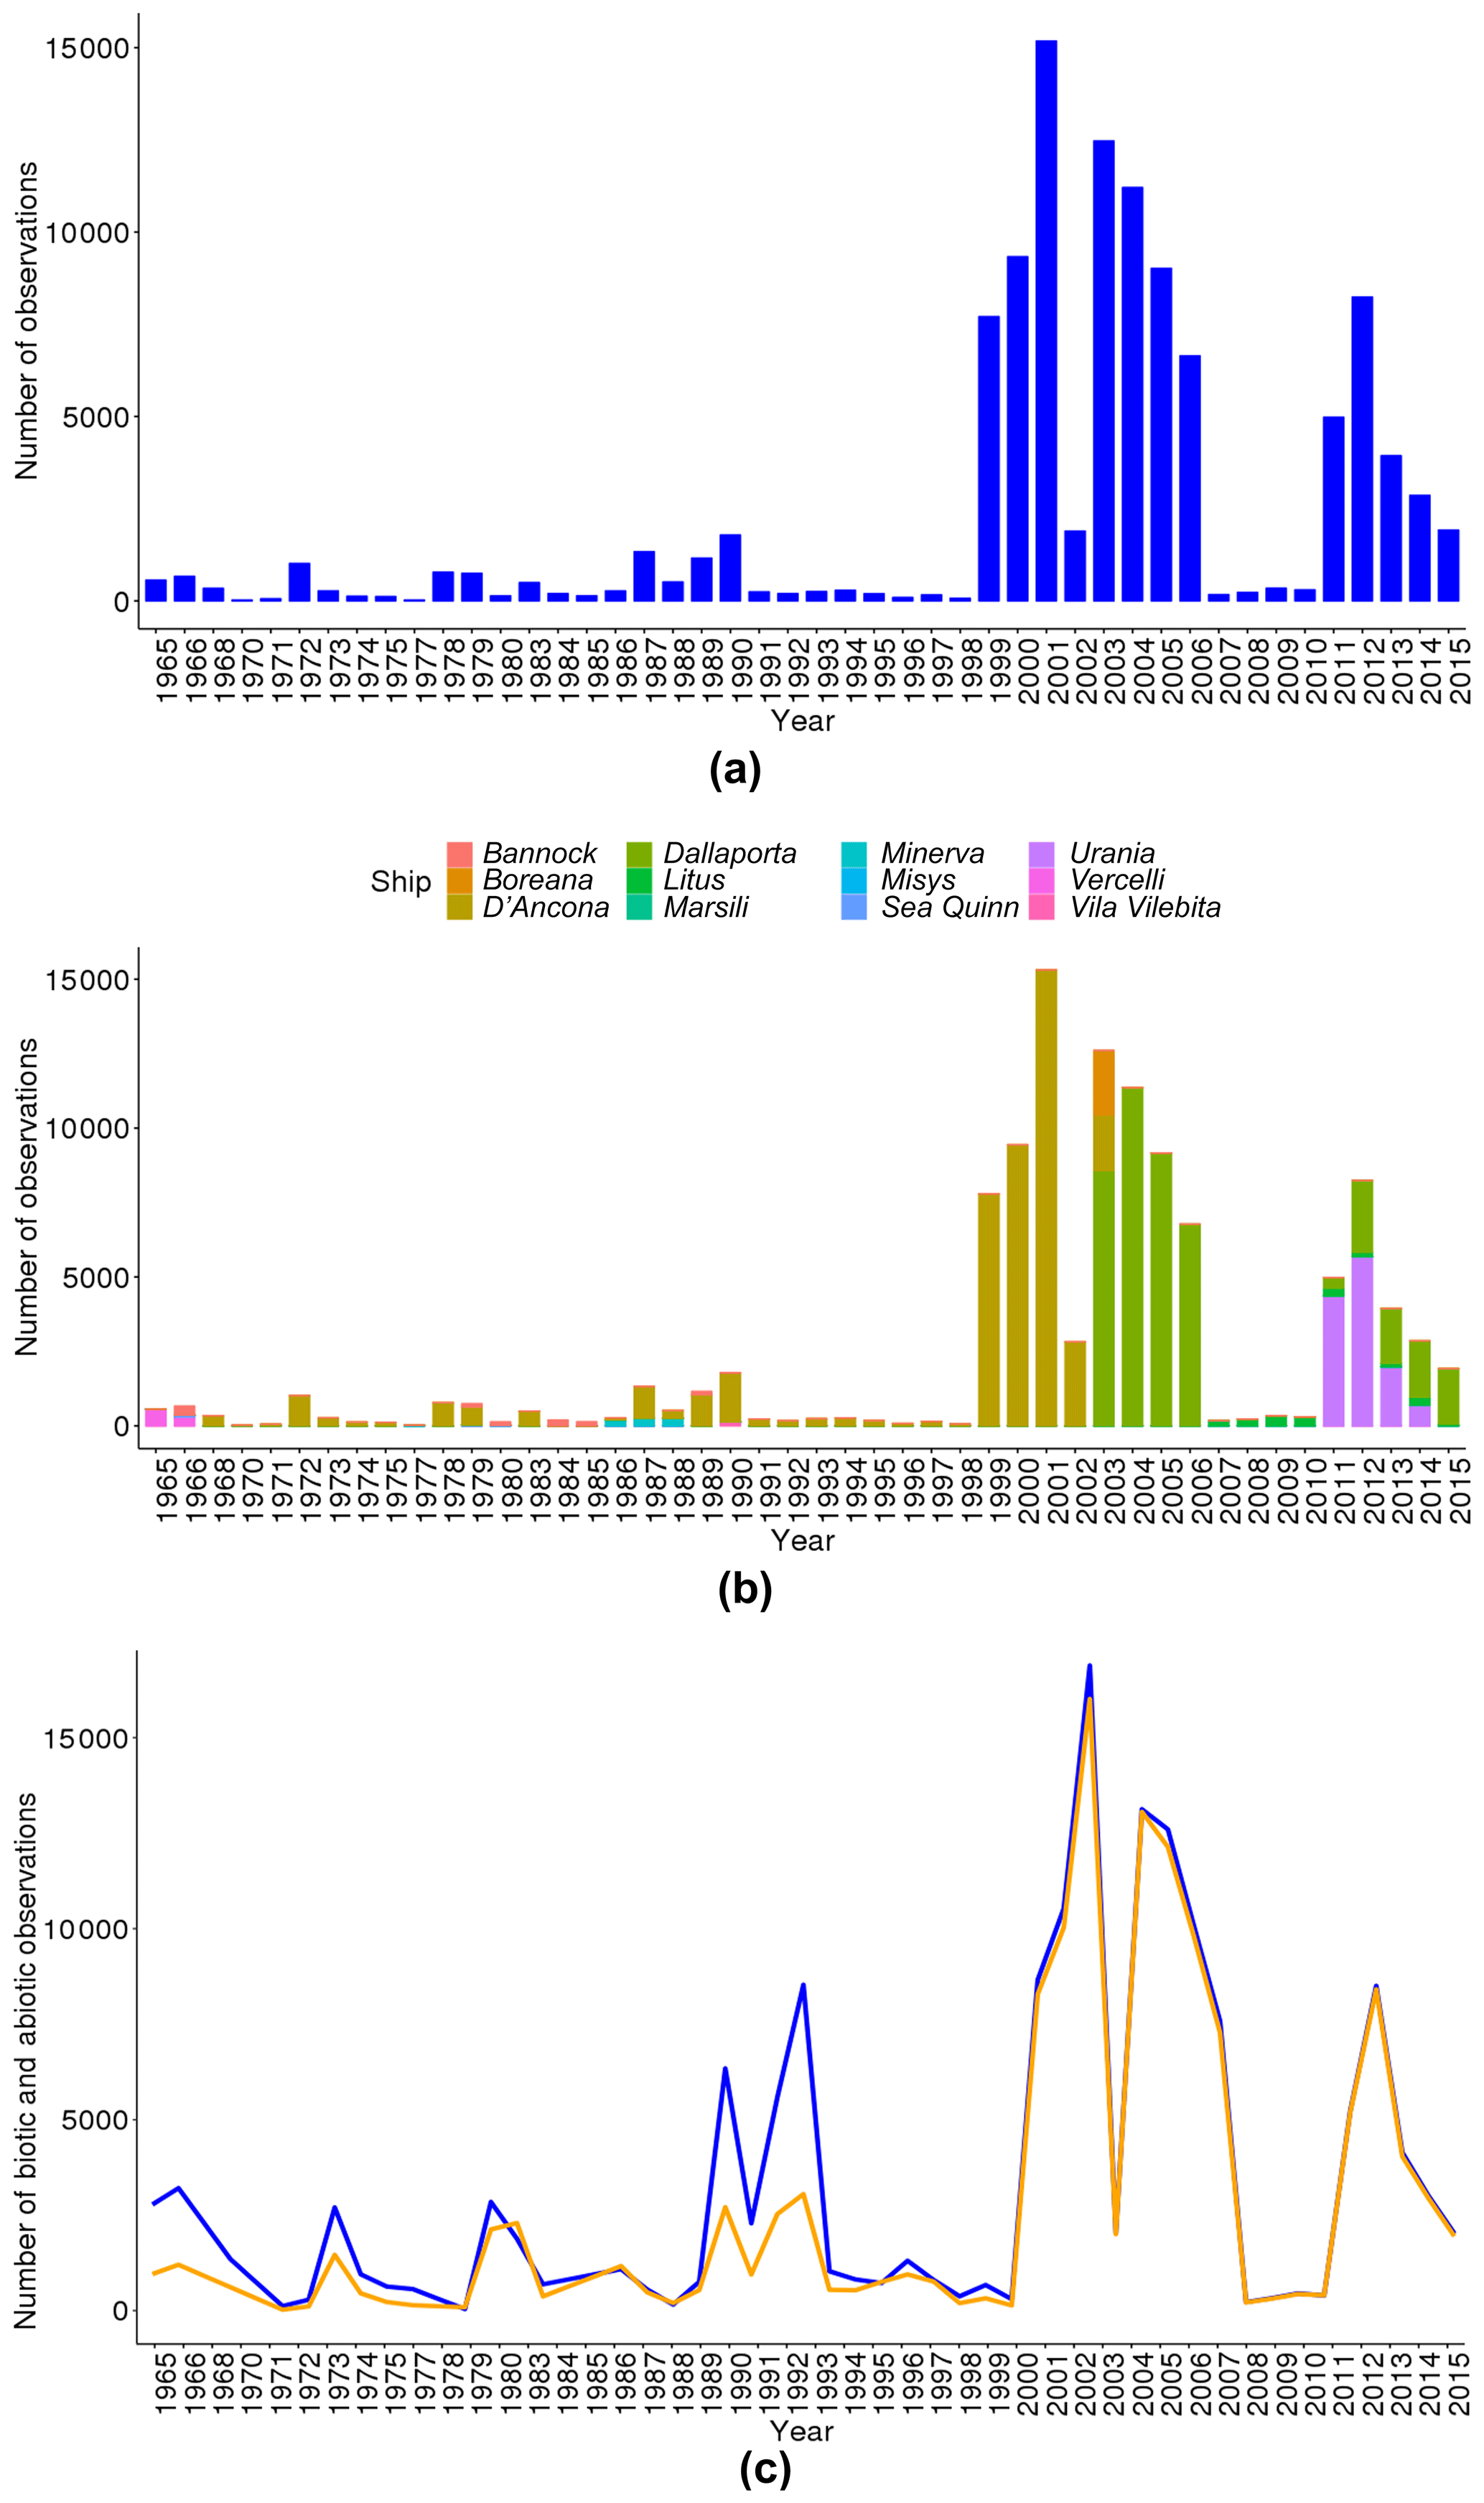
Figure 4Total number of observations over the whole period (a), clustered by research vessel (b) and by biotic (orange line) and abiotic (blue line) parameters (c).
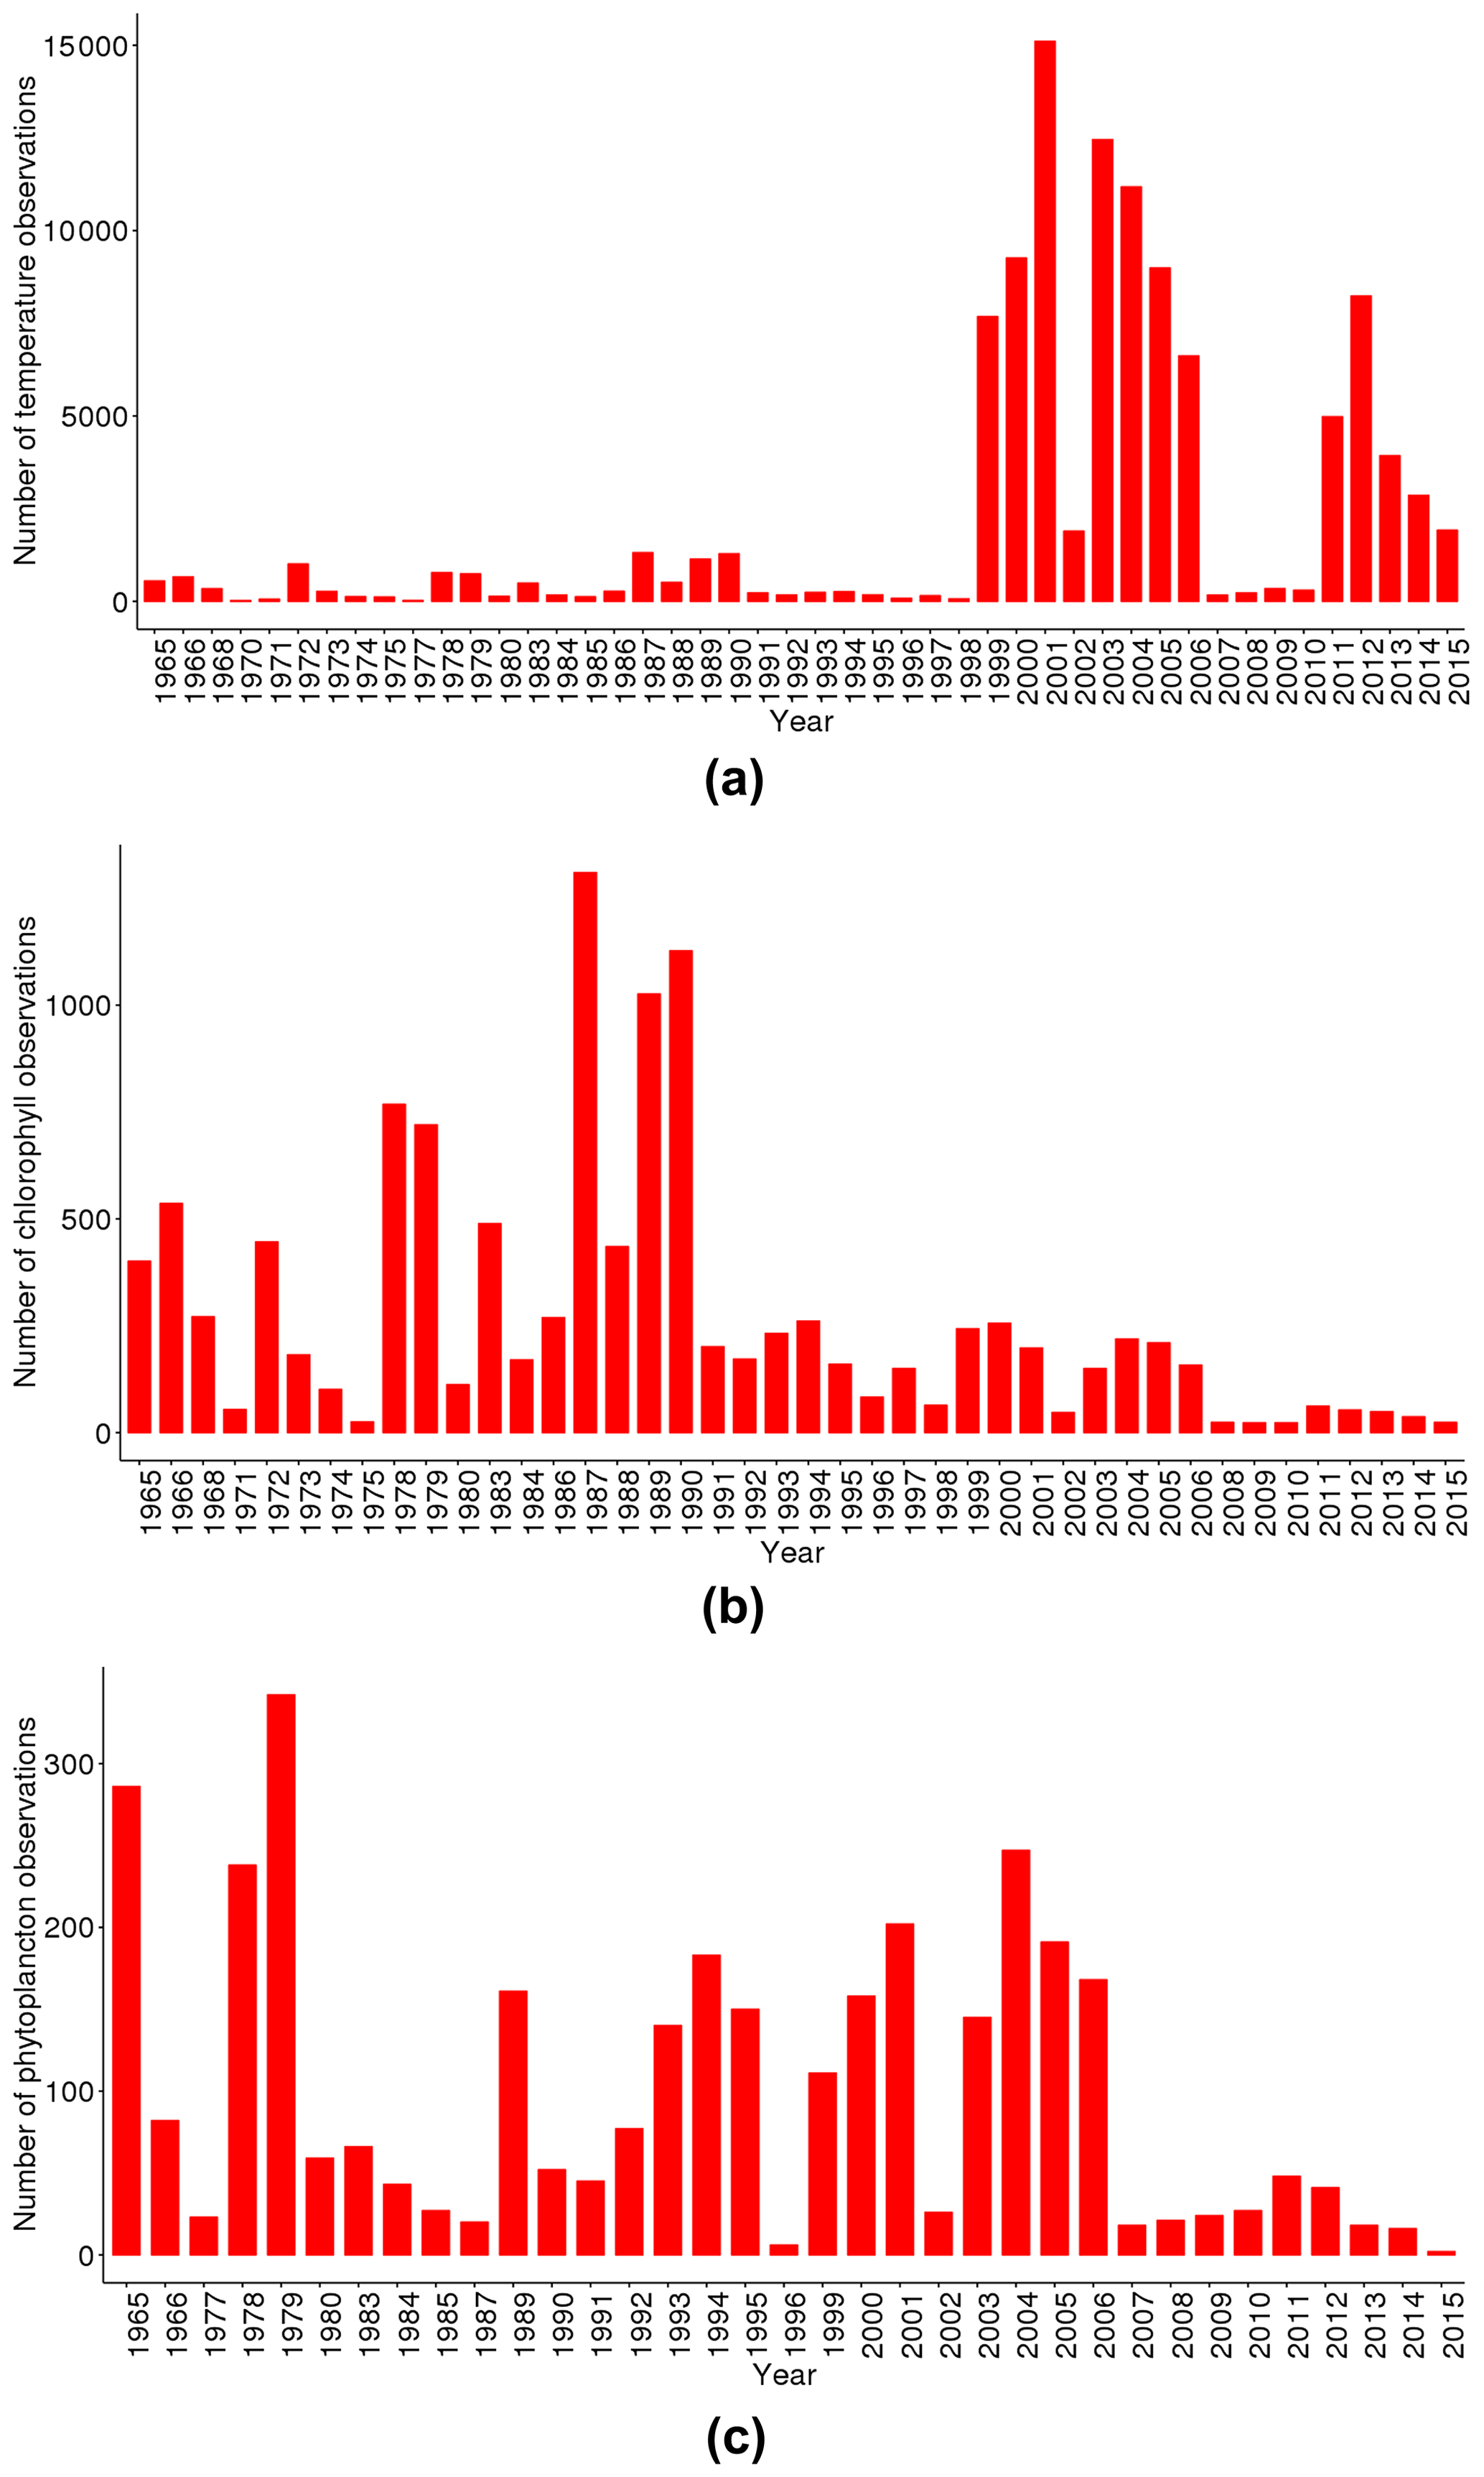
Figure 5Distribution over the years of the temperature (a), chlorophyll a (b), and phytoplankton (c) observations.
In Fig. 5 we compare the total number of observations of one physical (temperature) and two biological (chlorophyll a and phytoplankton abundance) parameters. All three parameters were measured each year, but each was measured with varying frequency. Temperature has up to ∼15 000 records, while chlorophyll a has ∼1200 records at most, and phytoplankton has only ∼300. The number of temperature data has a temporal distribution similar to the general one described in Fig. 4a, where 89 % of the observations occurred in the last 17 years due to the adoption of CTD probes. Chlorophyll a observations instead show peaks during the years 1987–1990, due to intense regional monitoring activities occurring in those years. The lowest number of phytoplankton observations is mainly due to the complex and time-consuming analytical procedure used, which does not allow for processing of a large amount of samples, and to the reduction of extensive monitoring activities since 2006.
The data management activities of the national flagship project RITMARE (Fugazza et al., 2014) allowed us to develop two tools to enhance the deployment of a distributed spatial data infrastructure (SDI) for the Italian marine researcher community. SDI is an interoperable technological infrastructure for preservation, publication, and discovery of geospatial data modelled on standard (Open Geospatial Consortium – OGC, World Wide Web Consortium – W3C, and INSPIRE Directive 2007/2/EC) web services. In order to strengthen the RITMARE infrastructure, the open-source software suite GET-IT (Oggioni et al., 2017; Menegon et al., 2017) and the customizable, template-driven metadata editor EDI (Pavesi et al., 2016; Tagliolato et al., 2016; https://github.com/SP7-Ritmare/EDI-NG_client, last access: February 2020) have been developed and released as open-source code. One of the nodes of the distributed SDI provides geospatial data collected by CNR-ISMAR marine researchers (http://vesk.ve.ismar.cnr.it, last access: February 2020).
Following the OGC Sensor Web Enablement (SWE) web service, each instrument or procedure has to be filled out as a “sensor”, then observations can be provided, for a specific parameter, as OGC O&M (Observations and Measurements) web standards. Through the EDI interface, integrated within the GET-IT software suite, a first core of sensors was already tested and uploaded in 2015 (Bastianini et al., 2015). A number of buoys (e.g. an ABATE – Seabird SBE 19 Plus V2), laboratory instruments (e.g. a Perkin Elmer Spectrophotometer), methods (e.g. Winkler titration method), and sensors have been described for this study by using XML SensorML v2.0 language, and their metadata, including manufacturer (provided as RDF, Resource Description Framework, Friend Of A Friend, FOAF, in Oggioni, 2019), owner, and operator contacts; measured parameters; position; documentation; and history, can be easily visualized in separate dedicated landing pages (Fig. 6). Currently, in the CNR-ISMAR GET-IT data node, 35 sensors have been described (http://vesk.ve.ismar.cnr.it/sensors/, last access: February 2020) for which it is possible to upload observations collected from different stations in the NAS.
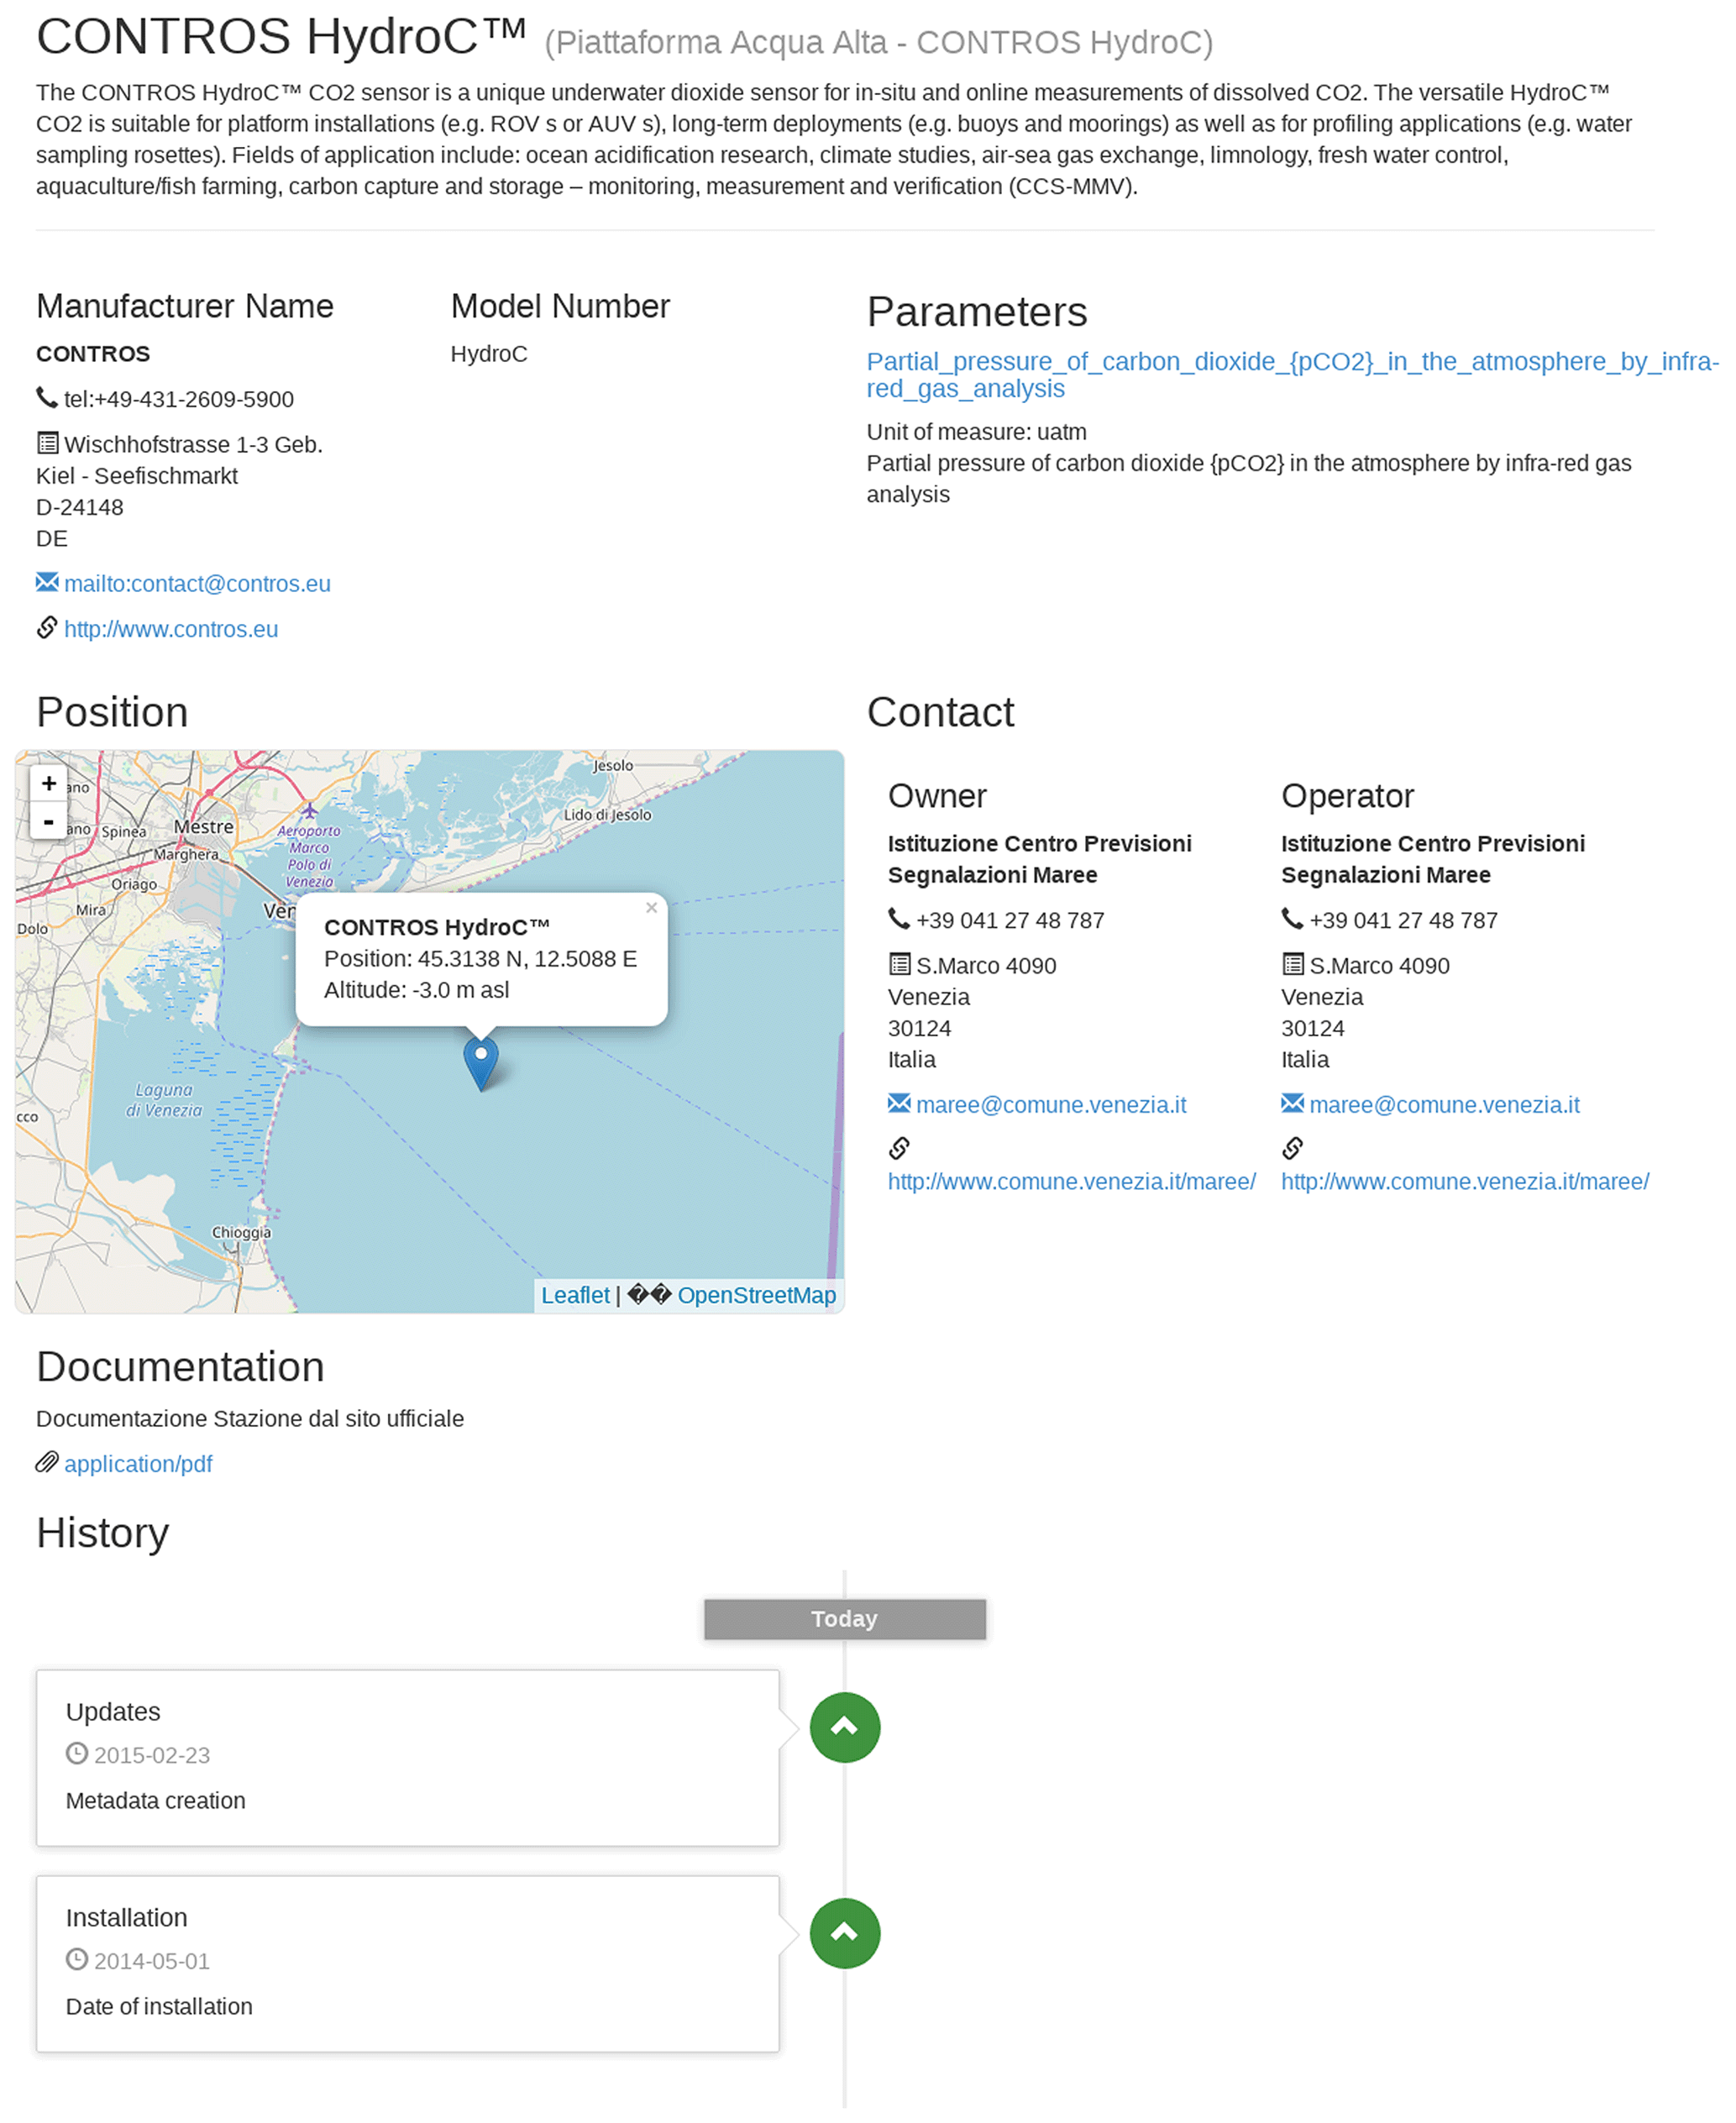
Figure 6Example of the sensor description provided by GET-IT. Information about manufacturer, owner and operator contacts, measured parameters, position, documentation, and history are displayed. Base map credits: © OpenStreetMap contributors 2019. Distributed under a CC-BY-SA License.
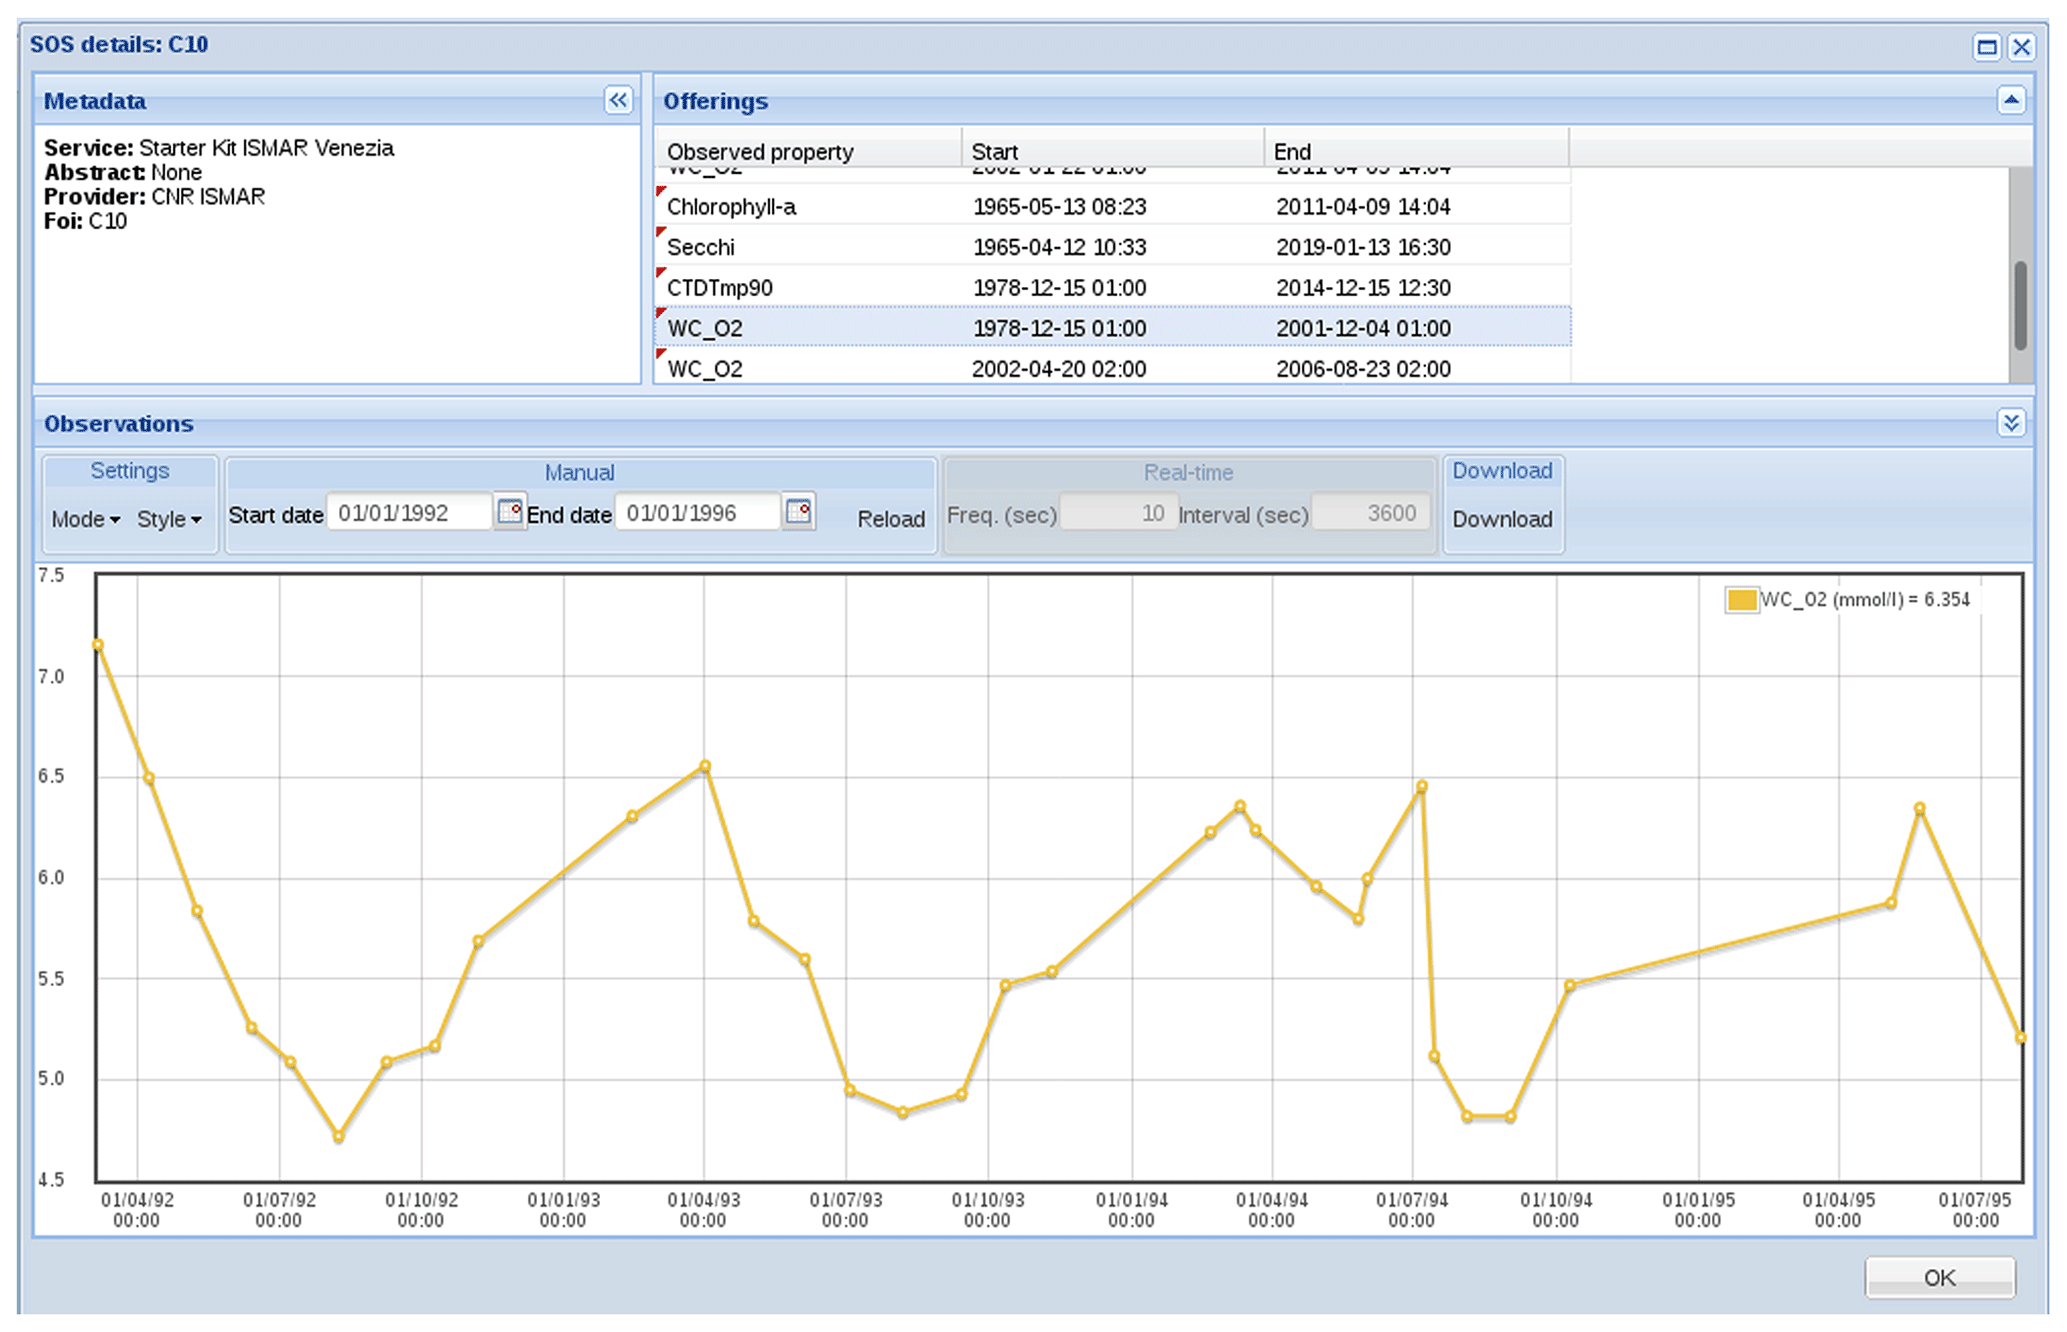
Figure 7Example of the graph of output from a query into the PostGis (http://postgis.net/) database underlying the GET-IT platform Oxygen data at station C10 for the period 1 January 1992–1 January 1996 are displayed.
Since v1.3.17 GET-IT still does not allow the three-dimensional representation of data, we decided to only upload surface values of each parameter and sampling operation into the software suite. This part of the database can be queried and graphed directly into GET-IT using the developed tool, in order to show time series of selected parameters (Fig. 7). A total of 16 017 observations have been uploaded.
Observations can be uploaded using the graphical interface or (for skilled users) directly into the SOS (Sensor Observation Service) web service using XML language. For uploads from the interface, data have to be formatted in a table using their date, time, and parameter value (Fig. 8). Since the speed of the process largely depends on the browser used to upload data, most of the data have been uploaded, through a Python script, by formatting specific .xml files containing information about the sensor's ID, sampling station, date, and time, following SWE standard. In both cases, the data upload begins with the selection of the sensor we want to upload data from and, following this, the selection of the sampling station from the map, if it is already available, or the creation of a new station.

Figure 8Data upload from the graphic interface. Selection of the sampling station for the specific sensor (a) and format of data to be uploaded into the SDI (b).
Code written to harmonize data is freely available under GNU GPL v.3 License both on Github (https://github.com/CNR-ISMAR/econaos/tree/master, last access: February 2020) and in Zenodo (https://doi.org/10.5281/zenodo.3600991, Minelli, 2020). The dataset is available at https://doi.org/10.5281/zenodo.3516717 (Acri et al., 2019). It was also uploaded in the DEIMS-SDR repository (Dynamic Ecological Information Management System – Site and Dataset Registry, https://deims.org/dataset/38d604ef-decb-4d67-8ac3-cc843d10d3ef, last access: February 2020), which is the official site and data registry for the International LTER network. The aim of DEIMS-SDR is to be a catalogue of in situ observation or experimentation facilities; it is implemented as a web-based information portal for integrated ecological information, which is comprised of detailed descriptions of sites where research is carried out, including the technical infrastructure, ecosystem properties, and research activities (see Wohner et al., 2019, for a full description). DEIMS-SDR provides a service which allows us to associate a PID (Persistent IDentifier) to the uploaded dataset. Thanks to an agreement between the LTER Research Infrastructure and the EUDAT Collaborative Data Infrastructure (CDI), the dataset is also automatically available in the B2Share catalogue (https://b2share.fz-juelich.de/records/e8d57102fd194bde957407ca290ad06a, last access: February 2020) and therefore in the EOSC (European Open Science Cloud) and GEOSS (Global Earth Observation System of Systems) catalogues. Since we opted to use a CC-BY license, our data are immediately fully available for download and reuse upon citation, without embargo rules or any further limitations.
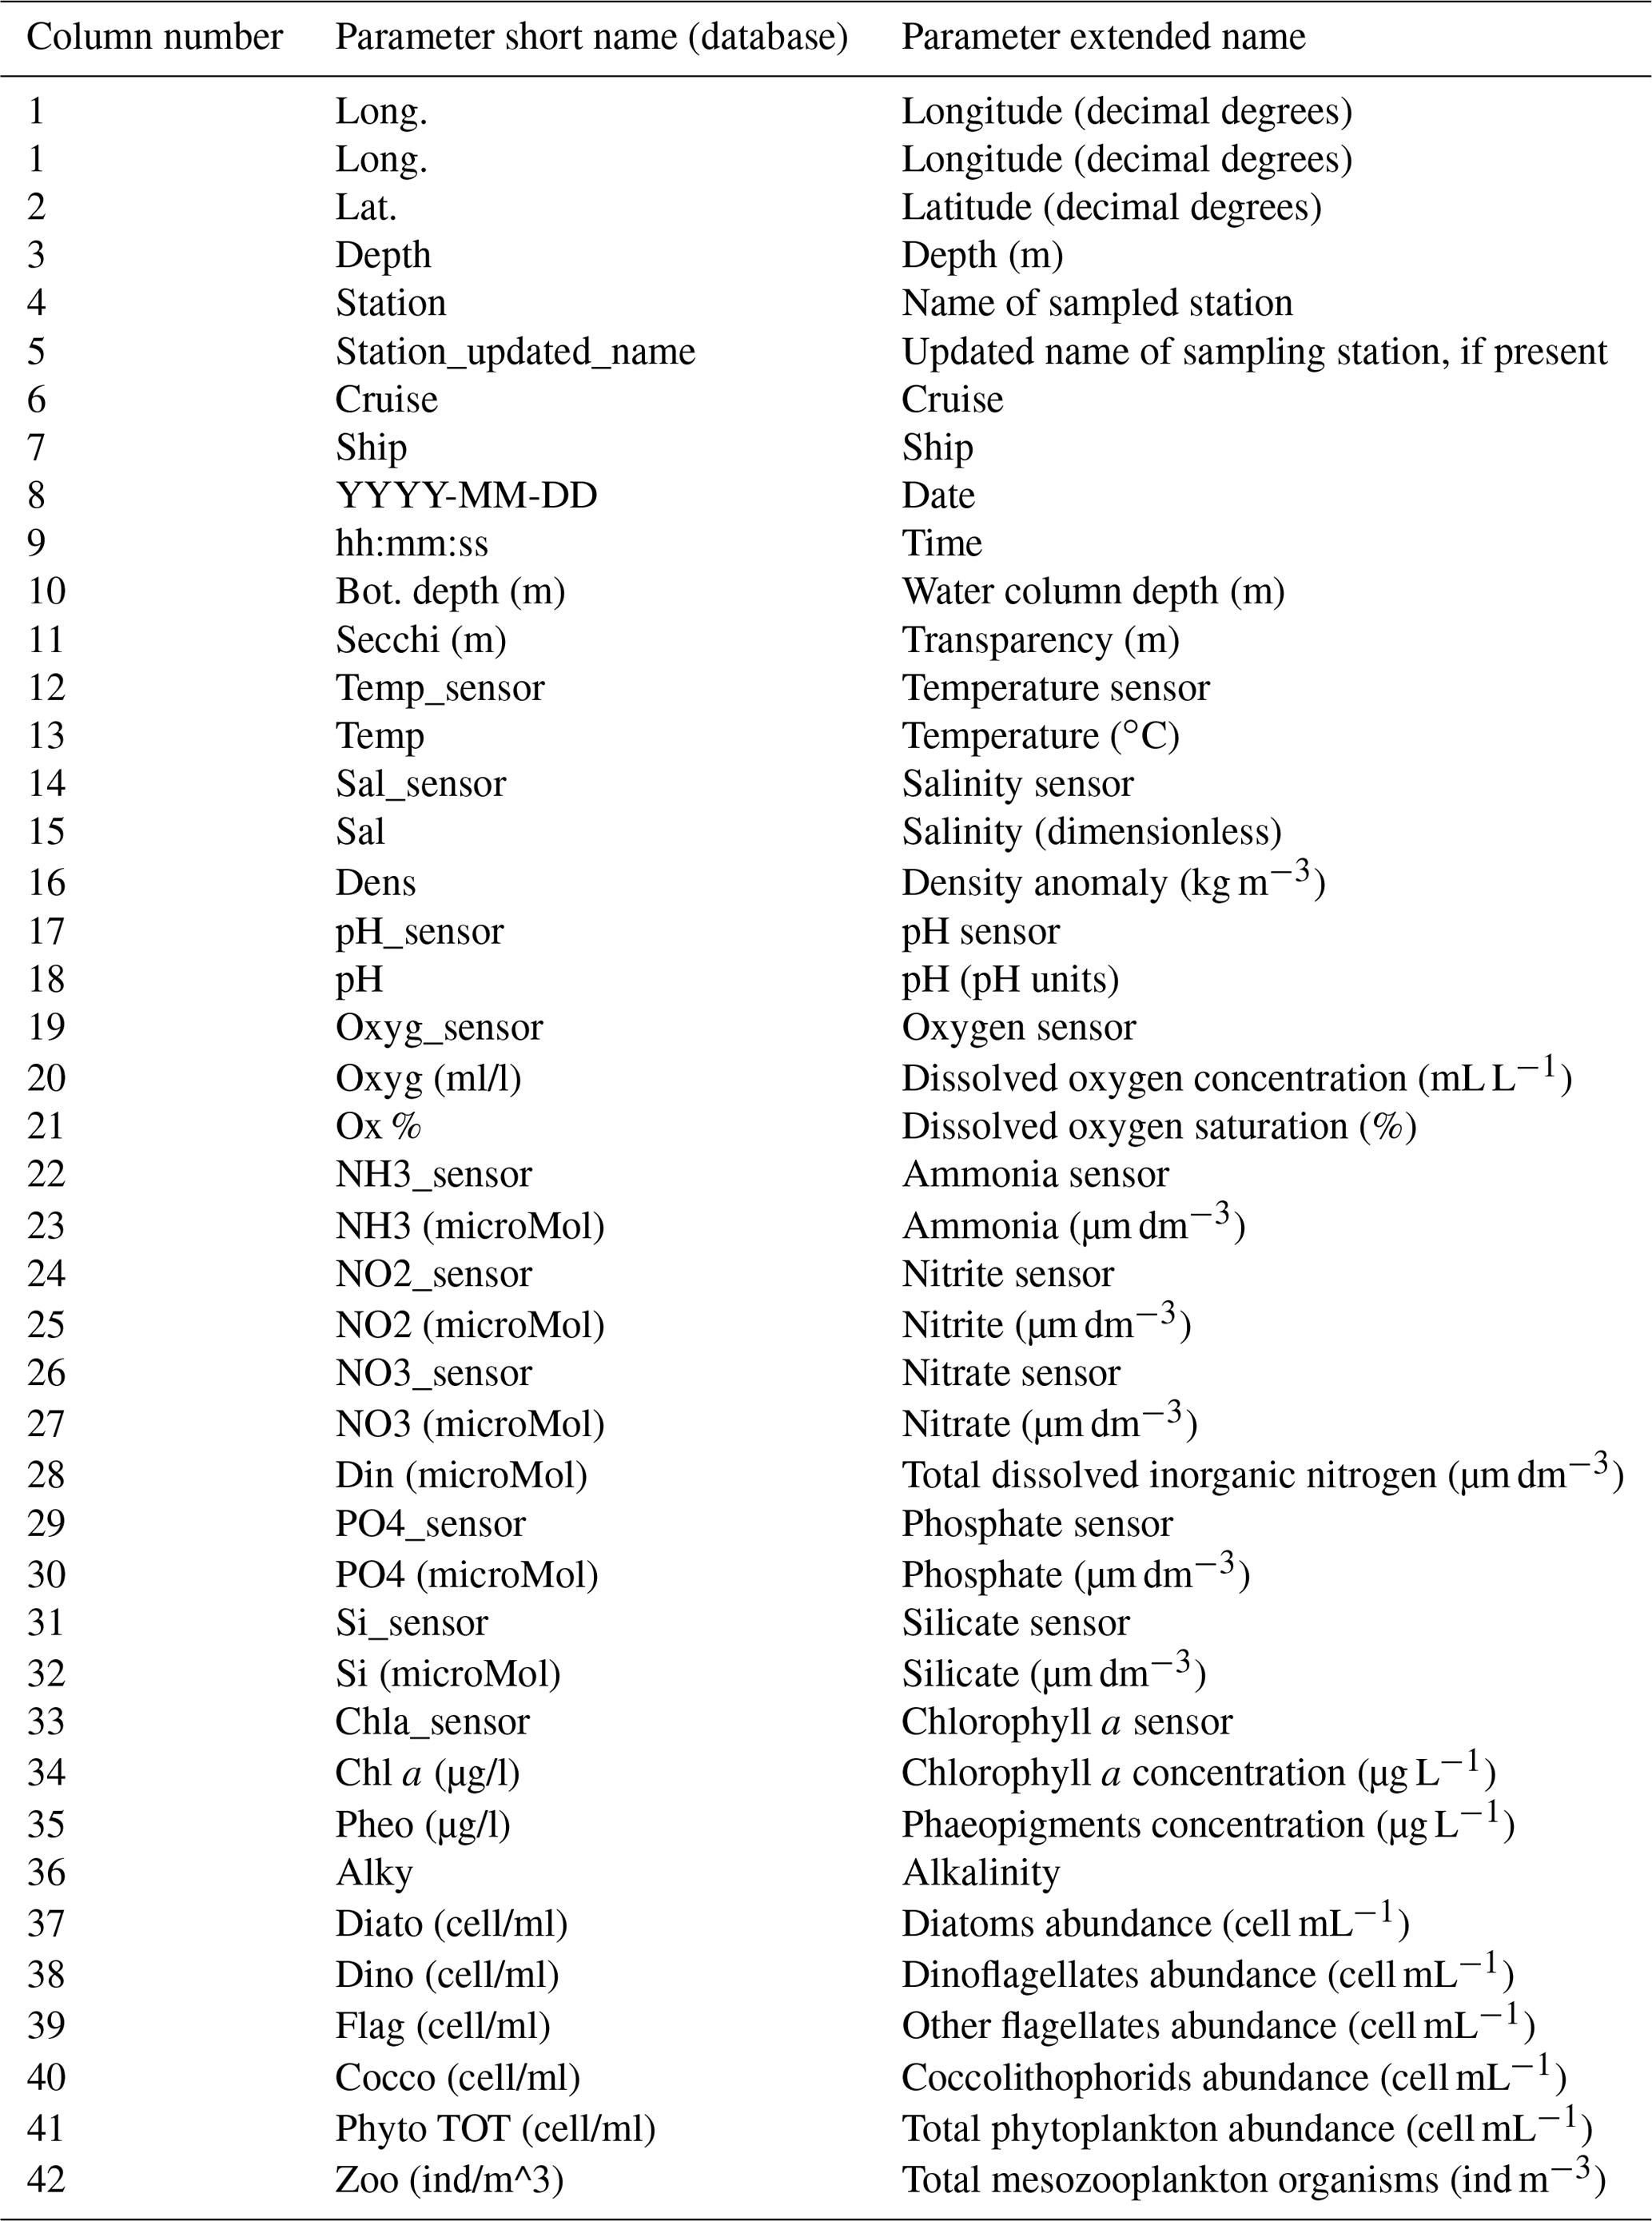
Table 4 collects the list of columns, short and extended names of each parameter, and ancillary field that make up the database.
Table 4Correspondence between column number, short name, and extended name of each parameter reported into the database.
The 50-year database of plankton and abiotic parameters in the NAS may contribute to an in-depth comprehension of plankton dynamics required not only to manage aquatic resources but also to predict and tackle future environmental changes. Long-term site-based studies of plankton may provide an invaluable opportunity to assess common or contrasting patterns of variability, to understand how those patterns change at different scales, and to hypothesize about their causes and consequences. The wide availability of the data on long-term variations in the planktonic system allows large-scale studies that obviously go beyond local use, representing a source of information for cross-system analysis, and allowing a comparison among ecosystems as well as new approaches in data analysis and in the development of water quality indicators.
However, these potential uses appear constrained by issues that are intrinsic to long-term series and that are related to the obvious variations, across the years, of sampling coverage and frequency and of analytical methodologies. In this respect, it is crucial to appropriately document the data, collecting and making as much ancillary information available as possible about the changes that occurred over time for each parameter measurement. This process was thoroughly carried out for the 50-year NAS dataset so that the potential users might know what the proper applications and limitations of the dataset could be.
The open access to the 50-year dataset of abiotic data and plankton in the NAS was framed in a wider open-science life cycle approach undertaken in the EcoNAOS project (Minelli et al., 2018), with the purpose of developing a practical case study that could insert the high and inspiring principles of open science into the scientific community, thereby fostering a cultural shift as well. Since its inception, EcoNAOS has involved both LTER and data management researchers in a joint partnership. In particular, the elaboration of the 50-year datasets has been worked out by a small group of plankton ecologists and data management experts, with the aim of sharing and harmonizing their different experiences, needs, and points of view. This participatory process is recognized to be crucial to overcoming cultural differences, barriers, and fragmentation that might represent an obstacle for open science (Björk, 2004; Janssen et al., 2012; Barry and Bannister, 2014). The constant interactions of oceanographers and ecologists with experts on data management and analysis, geospatial standards and web services interoperability, creating a rich and multi-domain research group, has been necessary to make the very detailed knowledge behind environmental surveys, samplings, analyses, and methodologies available and understandable through sound and fit-for-purpose technical solutions for data management and interoperability.
Accessibility and interoperability concepts and practices are crucial elements for LTER networks because the more the time series are consistent, coherent, and available, the more it is possible to reconstruct trends and dynamics and to identify and compare reliable trends. The consistency and the coherence of the dataset require careful efforts for supplying the proper metadata, which could document the methodological changes that occurred throughout the years, thus allowing potential users to evaluate the restrictions as well as the most suitable uses of the dataset. The activity described in this data paper is fully in line with the data management plan of the LTER networks at the national, European, and global levels, since one of the LTER mandates is actually to foster open sharing of LTER data (Mirtl, 2010; Mirtl et al., 2018). The national LTER networks are fostered to adopt the aspects of open science that are currently feasible in the different research groups.
Currently, a dynamic update and integration of the published dataset is not yet supported by specific tools nor integrated in automatic procedures. Regardless, the promotion of a full open-science approach to LTER in the coming years and extension of the dataset through the publication of updates and possibly through the integration of different long-term datasets is foreseen.
AM led the whole process of dataset recovery, mediation, and publication. AO, AP, and AS were the reference people for the entire activity. FA, MB, FBA, EC, CB, AM, AO, AS, and AP contributed to the writing of this paper by drafting the text, figures, tables, revisions, and suggestions.
FA, MB, FBA, EC, AB, DC, ADL, MP, SF, and GS collected and analysed data over time, providing statistics and material (graphs and tables) for the paper.
The authors declare that they have no conflict of interest.
This research has been supported by the Italian Ministry of University and Research (MIUR): action no. 66 – 11A13445, official gazette (General Serie) no. 240 (14-10-2011), 28 September 2011.
This paper was edited by Dirk Fleischer and reviewed by Johan Wikner and Diego Fontaneto.
Acri, F., Bastianini, M., Bernardi Aubry, F., Camatti, E., Bergami, C., Boldrin, A., De Lazzari, A., Finotto, S., Minelli, A., Oggioni, A., Pansera, M., Sarretta, A., Socal, G., and Pugnetti, A.: LTER Northern Adriatic Sea (Italy) marine data from 1965 to 2015 [Data set], Zenodo, https://doi.org/10.5281/zenodo.3266246, 2019.
Barry, E. and Bannister, F.: Barriers to open data release: A view from the top, Information Polity, 19, 129–152, 2014.
Bastianini, M., Bernardi Aubry, F., Bianchi, F., Boldrin, A., Camatti, E., Carrara, P., De Lazzari, A., Guerzoni, S., Menegon, S., Oggioni, A., Pugnetti, A., Sarretta, A., Socal, G., Tagliolato, P., and Vianello, A.: The LTER site Gulf of Venice and the project RITMARE: a case study for the recovery, search, view and sharing of long term ecological marine research data, AIOL – Associazione Italiana Oceanografia e Limnologia, Verbania Pallanza, 2015.
Benedetti-Cecchi, L., Crowe, T., Boehme, L., Boero, F., Christensen, A., Grémare, A., Hernandez, F., Kromkamp, J. C., Nogueira García, E., Petihakis, G., Robidart, J., Sousa Pinto, I., and Zingone, A.: Strengthening Europe's Capability in Biological Ocean Observations, edited by: Muñiz Piniella, Á., Kellett, P., Larkin, K., and Heymans, J. J., Future Science Brief 3 of the European Marine Board, Ostend, Belgium, 76 pp., ISBN 9789492043559 ISSN 2593-5232, 2018.
Berard-Therriault, L., Poulin, M., and Bossé, L.: Guide d'identification du phytoplancton marin de l'estuaire et du golfe du Saint-Laurent, NRC Research Press, 387 pp., ISBN 978-0-660-96057-9, 1999.
Bergami, C., L'Astorina, A., and Pugnetti, A. (a cura di): I Cammini della Rete LTER-Italia, Il racconto dell'ecologia in cammino, Roma: CNR Edizioni, ISBN (online) 978888080304-1, ISBN (cartaceo) 978888080312-6, https://doi.org/10.32018/978888080304-1, 2018.
Bernardi Aubry, F., Acri, F., Bastianini, M., Pugnetti, A., and Socal, G.: Picophytoplankton contribution to phytoplankton community structure in the Gulf of Venice (NW Adriatic Sea), Int. Rev. Hydrobiol., 91, 51–70, https://doi.org/10.1002/iroh.200410787, 2006.
Björk, B. C.: Open access to scientific publications - an analysis of the barriers to change?, Information Research, 2004, Vol. 9, No. 2, paper 170, http://hdl.handle.net/10227/647, 2004.
Council, B.: Freedom of Information Act 2000, Education, 18, 21, UK Government, available at: https://www.legislation.gov.uk/ukpga/2000/36/contents, 2006.
De Lazzari, A., Berto, D., Cassin, D., Boldrin, A., and Giani, M.: Influence of winds and oceanographic conditions on the mucilage aggregation in the Northern Adriatic Sea in 2003–2006, Mar. Ecol., 29, 469–482, https://doi.org/10.1111/j.1439-0485.2008.00268.x, 2008.
Eysenbach, G.: Citation advantage of open access articles, PLoS Biol., 4, e157, https://doi.org/10.1371/journal.pbio.0040157, 2006.
European Commission: Open innovation, open science, open to the world – a vision for Europe, RTD-PUBLICATIONS@ec.europa.eu [ISBN 978-92-79-57346-0], https://doi.org/10.2777/061652, 2016.
European Marine Board: Navigating the Future V: Marine Science for a Sustainable Future, Position Paper 24 of the European Marine Board, Ostend, Belgium, ISBN 9789492043757, ISSN 0167-9309, https://doi.org/10.5281/zenodo.2809392, 2019.
Fortibuoni, T., Libralato, S., Raicevich, S., Giovanardi, O., and Solidoro, C.: Coding Early Naturalists' Accounts into Long-Term Fish Community Changes in the Adriatic Sea (1800–2000), PLoS ONE, 5, e15502, https://doi.org/10.1371/journal.pone.0015502, 2010.
Franco, P.: Oceanography of Northern Adriatic-Sea: 1. Hydrologic features-cruises July–August and October–November 1965, Archivio di Oceanografia e Limnologia, 16, 1, 1970.
Franco, P.: Oceanography of Northern Adriatic Sea: 2. Hydrologic features: cruises January–February and April–May 1966, Archivio di Oceanografia e Limnologia, 17(Suppl.), 1–97, 1972, Illuss, 1972.
Franco, P.: Oceanography of Northern Adriatic Sea: Data from the cruises of the years 1978 and 1979, Istituto di biologia del mare, 1982.
Fugazza, C., Basoni, A., Menegon, S., Oggioni, A., Pavesi, F., Pepe, M., Sarretta, A., and Carrara, P.: RITMARE: Semantics-aware Harmonisation of Data in Italian Marine Research, Procedia Computer Science, 33, 261–265, https://doi.org/10.1016/j.procs.2014.06.041, 2014.
Giani, M., Berto, D., Zangrando, V., Castelli, S., Sist, P., and Urbani, R.: Chemical characterization of different typologies of mucilaginous aggregates in the Northern Adriatic Sea, Sci. Total Environ., 353, 232–246, https://doi.org/10.1016/j.scitotenv.2005.09.027, 2005.
Giani, M., Djakovac, T., Degobbis, D., Cozzi, S., Solidoro, C., and Fonda Umani, S.: Recent changes in the marine ecosystems of the northern Adriatic Sea, Estuar. Coast. Shelf Sci., 115, 1–13, https://doi.org/10.1016/j.ecss.2012.08.023, 2012.
Haase, P., Tonkin, J. D., Stoll, S., Burkhard, B., Frenzel, M., Geijzendorffer, I. R., Mirtl, M., Müller, F., Musche, M., Penner, J., Zacharias, S., and Schmeller, D. S.: The next generation of site-based long-term ecological monitoring: linking essential biodiversity variables and ecosystem integrity, Sci. Total Environ., 613, 1376–1384, https://doi.org/10.1016/j.scitotenv.2017.08.111, 2018.
Hampton, S. E., Anderson, S. S., Bagby, S. C., Gries, C., Han, X., Hart, E. M., Jones, M. B., Lenhardt, W. C., MacDonald, A., Michener, W. K., Mudge, J., Pourmokhtarian, A., Schildhauer, M. P., Woo, K. H., and Zimmerman, N.: The Tao of open science for ecology, Ecosphere, 6, 120, https://doi.org/10.1890/ES14-00402.1, 2015.
Harris, R. P., Wiebe, P. H., Lenz, J., Skjoldal, H. R., and Huntley, M.: ICES Zooplankton Methodology Manual, Academic Press, USA, pp. 684, https://doi.org/10.1016/B978-0-12-327645-2.X5000-2, 2000.
Heimdal, B. R.: Modern Coccolithophorids in: Marine phytoplankton a guide to naked flagellates and coccolithophorids, Tanos editors, Academic Press, 147–248, ISBN 9780323138277, 1993.
Hendey, N. I.: An introductory account of the smaller algae of British coastal waters. Part V: Bacillariophyceae, Diatoms. Fishery Invest. Lond. Ser. IV 5, 317 pp., 1964.
Hustedt, F.: Die Kiesealgen von Deutschland, Österreichs und der Schweiz mit Berusichtigung der übrigen Länder Europas sowie der angrenzender Mehresgebiete, in: Rabenhorst's Kriptogamen-Flora von Deutschland, Österreichs und der Schweiz. Akad; Verlag. m. b. H. Leipzig. 7: Tl. 2. 920 pp.: Tl., 2 845 pp.; Tl. 3, 816 pp., https://doi.org/10.5962/bhl.title.1356, 1930–1966.
Janssen, M., Charalabidis, Y., and Zuiderwijk, A.: Benefits, adoption barriers and myths of open data and open government, Info. Sys. Manage., 29, 258–268, https://doi.org/10.1080/10580530.2012.716740, 2012.
McKiernan, E. C., Bourne, P. E., Brown, C. T., Buck, S., Kenall, A., Lin, J., McDougall, D., Nosek, B. A., Ram, K., Soderberg, C. K., Spies, J. R., Thaney, K., Updegrove, A., Woo, K. H., and Yarkoni, T.: Point of view: How open science helps researchers succeed, eLife, 5, e16800, https://doi.org/10.7554/eLife.16800, 2016.
Menegon, G., Vianello, A., Oggioni, A. Tagliolato, P., Lanucara, S., Sarretta, A., Basoni, A., Zilioli, M., Pepe, M., Fugazza, C., Bastianini, M., Criscuolo, L., Pavesi, F., and Carrara, P.: SP7-Ritmare/starterkit v1.3.17, https://doi.org/10.5281/zenodo.1101020, 2017.
Minelli, A.: EcoNAOS Project code, https://doi.org/10.5281/zenodo.3600991, 2020.
Minelli, A., Oggioni, A., Pugnetti, A., Sarretta, A., Bastianini, M., Bergami, C., Bernardi Aubry, F., Camatti, E., Scovacricchi, T., and Socal, G.: The project EcoNAOS: vision and practice towards an open approach in the Northern Adriatic Sea ecological observatory, Research Ideas and Outcomes, 4, e24224, https://doi.org/10.3897/rio.4.e24224, 2018.
Mirtl, M.: Introducing the next generation of ecosystem research in Europe: LTER-Europe’s multi-functional and multi-scale approach, Long-Term Ecological Research, 75–93, https://doi.org/10.1007/978-90-481-8782-9_6 Springer, Dordrecht, 2010.
Mirtl, M., Borer, E. T., Djukic, I., Forsius, M., Haubold, H., Hugo, W., Orenstein, D. E., Pauw, J.C., Peterseil, J., Shibata, H., Wohner, C., Yu, X., and Haase, P.: Genesis, goals and achievements of long-term ecological research at the global scale: a critical review of ILTER and future directions, Sci. Total Environ., 626, 1439–1462, https://doi.org/10.1016/j.scitotenv.2017.12.001, 2018.
Mozetič, P., Solidoro, C., Cossarini, G., Socal, G., Precali, R., Francé, J., Bianchi, F., De Vittor, C., Smodlaka, N., and Umani, S. F.: Recent trends towards oligotrophication of the northern Adriatic: evidence from chlorophyll a time series, Estuaries and Coasts, 33, 362–375, https://doi.org/10.1007/s12237-009-9191-7, 2010.
Oggioni, A.: oggioniale/RDF-FOAF-Manufacture-list: First release of RDF-FOAF-Manufacturers list, https://doi.org/10.5281/zenodo.3247546, 2019.
Oggioni, A., Tagliolato, P., Fugazza, C., Pepe, M., Menegon, S., Pavesi, F., and Carrara, P.: Interoperability in Marine Sensor Networks through SWE Services: The RITMARE Experience, https://doi.org/10.4018/978-1-5225-0700-0.ch009, 2017.
Palen, L., Soden, R., Anderson, T. J., and Barrenechea, M.: Success & scale in a data-producing organization: The socio-technical evolution of OpenStreetMap in response to humanitarian events, in: Proceedings of the 33rd annual ACM conference on human factors in computing systems (pp. 4113–4122), ACM, https://doi.org/10.1145/2702123.2702294, 2015.
Pascher, A.: Clorophyceae, in: Die Susswasser Flora Deutschlands, Osterreichs und der Schweiz, Verlags von Gustav Fisher, Jena, Heft 5, 250 pp., ISBN 1176110802, 1915.
Pavesi, F., Basoni, A., Fugazza, C., Menegon, S., Oggioni, A., Pepe, M., Tagliolato, P., and Carrara, P.: EDI – A Template-Driven Metadata Editor for Research Data, Journal of Open Research Software, 4, e40, https://doi.org/10.5334/jors.106, 2016.
Peragallo, H. and Peragallo, M.: Diatomees Marine de France et des Districts Maritimes Voisins. Micrographe Editeur Grez sur Loing (S. et M.), 419 pp., ISBN 0270995986, 1897–1908.
Rampi, L. and Bernhardt, M.: Chiave per la determinazione tassonomica delle Peridinee Pelagiche Mediterranee: C.N.E.N., Roma (RT/B10 (81)13), 1–98, 1980.
Ravaioli, M., Bergami, C., Riminucci, F., Langone, L., Cardin, V., Di Sarra, A., Aracri, S., Bastianini, M., Bensi, M., Bergamasco, A., Bommarito, C., Borghini, M., Bortoluzzi, G., Bozzano, R., Cantoni, C., Chiggiato, J., Crisafi, E., D'Adamo, R., Durante, S., Fanara, C., Grilli, F., Lipizer, M., Marini, M., Miserocchi, S., Paschini, E., Penna, P., Pensieri, S., Pugnetti, A., Raichich, F., Schroeder, K., Siena, G., Specchiulli, A., Stanghellini, G., Vetrano, A., and Crise, A.: The RITMARE Italian Fixed-Point Observatory Network (IFON) for marine environmental monitoring: a case study, Journal of Operational Oceanography, 9(Suppl.), s202–s214, https://doi.org/10.1080/1755876X.2015.1114806, 2016.
Razouls, C., de Bovée, F., Kouwenberg, J., and Desreumaux, N.: Diversity and Geographic Distribution of Marine Planktonic Copepods, Sorbonne University, CNRS, available at: http://copepodes.obs-banyuls.fr/en (last access: February 2020), 2005–2019.
Reichman, O. J., Jones, M. B., and Schildhauer, M. P.: Challenges and opportunities of open data in ecology, Science, 331, 703–705, https://doi.org/10.1126/science.1197962, 2011.
Schiller, J: Dinoflagellatae (Peridineae) Monografischer Behandlung, in: Rabenhorst Kriptogamen-Flora von Deutschland, Österreichs und der Schweiz. Verlag. m. b. H. Leipzig, 10 (3) -1, 1–617, (1931–1933), (10) 3–2, 1–590, (1933–1937), https://doi.org/10.5962/bhl.title.1356, 1931–1937.
Science|Business Network's Cloud Consultation Group: Why Open Science is the Future (and how to make it happen), Science|Business, Brussels, report available at: https://sciencebusiness.net/report/why-open-science-future-and-how-make-it-happen (last access: February 2020), 2019.
Scovacricchi, T.: Technical recovery of material and methods applied in the cruises of 1965, 1966, 1978/79 as described by P. Franco (1970, 1972, 1982), Internal Report, CNR-ISMAR Venezia (Italy), 2017.
Solidoro, C., Bastianini, M., Bandelj, V., Codermatz, R., Cossarini, G., Melaku Canu, D., Ravagnan, E., Salon, S., and Trevisani, S.: Current state, scales of variability, and trends of biogeochemical properties in the northern Adriatic Sea, J. Geophys. Res., 114, C07S91, https://doi.org/10.1029/2008JC004838, 2009.
Tagliolato, P., Oggioni, A., Fugazza, C., Pepe, M., and Carrara, P.: Sensor metadata blueprints and computer-aided editing for disciplined SensorML, IOP Conference Series: Earth and Environmental Science 34, 012036-012036, https://doi.org/10.1088/1755-1315/34/1/012036, 2016.
Tai, T. and Robinson, J.: Enhancing climate change research with open science, Front. Environ. Sci., 6, 115, https://doi.org/10.3389/fenvs.2018.00115, 2018.
Tennant, J. P., Crane, H., Crick, T., Davila, J., Enkhbayar, A., Havemann, J., Kramer, B., Martin, R., Masuzzo, P., Nobes, A., Rice, C., Rivera-López, B. S., Ross-Hellauer, T., Sattler, S., Thacker, P., and Vanholsbeeck, M.: Ten myths around open scholarly publishing, PeerJ Preprints, 7, e27580v1, https://doi.org/10.7287/peerj.preprints.27580v1, 2019.
Throndsen, J.: The planktonic marine flagellates in: Marine phytoplankton a guide to naked flagellates and coccolithophorids, Tanos editors, Academic Press: 7–131, ISBN 9780323138277, 1993.
Tomas, C. R.: Identifying Marine Phytoplankton, Academic Press, Arcourt Brace & Company, https://doi.org/10.1016/B978-0-12-693018-4.X5000-9, 1997.
Totti, C., Romagnoli, T., Accoroni, S., Coluccelli, A., Pellegrini, M., Campanelli, A., Grilli, F., and Marini, M.: Phytoplankton communities in the northwestern Adriatic Sea: Interdecadal variability over a 30-years period (1988–2016) and relationships with meteoclimatic drivers, J. Mar. Syst., 193, 137–153, https://doi.org/10.1016/j.jmarsys.2019.01.007, 2019.
Utermöhl, H.: Zur Vervollkommung der quantitativen Phytoplankton-Methodik, Mitt. Int. Ver. Limnol., 9, 38, 1958.
Wilkinson, M. D., Dumontier, M., Aalbersberg, I. J., Appleton, G., Axton, M., Baak, A., Blomberg, N., Boiten, J., Bonino da Silva Santos, L., Bourne, P. E., Bouwman, J., Brookes, A. J., Clark, T., Crosas, M., Dillo, I., Dumon, O., Edmunds, S., Evelo, C. T., Finkers, R., Gonzalez-Beltran, A., Gray, A. J. G., Groth, P., Goble, C., Grethe, J. S., Heringa, J., 't Hoen, P. A. C., Hooft, R., Kuhn, T., Kok, R., Kok, J., Lusher, S. J., Martone, M. E., Mons, A., Packer, A. L., Persson, B., Rocca-Serra, P., Roos, M., van Schaik, R., Sansone, S., Schultes, E., Sengstag, T., Slater, T., Strawn, G., Swertz, M. A., Thompson, M., van der Lei, J., van Mulligen, E., Velterop, J., Waagmeester, A., Wittenburg, P., Wolstencroft, K., Zhao, J., and Mons, B.: The FAIR Guiding Principles for scientific data management and stewardship, Scientific Data, 3, 160018, https://doi.org/10.1038/sdata.2016.18, 2016.
Wohner, C., Peterseil, J., Poursanidis, D., Kliment, T., Wilson, M., Mirtl, M., and Nektarios, C.: DEIMS-SDR – A web portal to document research sites and their associated data, Ecological Informatics, 51, 15–24, https://doi.org/10.1016/j.ecoinf.2019.01.005, 2019.