the Creative Commons Attribution 4.0 License.
the Creative Commons Attribution 4.0 License.
 | 10 Feb 2020
A spatially explicit database of wind disturbances in European forests over the period 2000–2018
Giovanni Forzieri
Matteo Pecchi
Marco Girardello
Achille Mauri
Marcus Klaus
Christo Nikolov
Marius Rüetschi
Barry Gardiner
Julián Tomaštík
David Small
Constantin Nistor
Donatas Jonikavicius
Jonathan Spinoni
Luc Feyen
Francesca Giannetti
Rinaldo Comino
Alessandro Wolynski
Francesco Pirotti
Fabio Maistrelli
Ionut Savulescu
Stéphanie Wurpillot-Lucas
Stefan Karlsson
Karolina Zieba-Kulawik
Paulina Strejczek-Jazwinska
Martin Mokroš
Stefan Franz
Lukas Krejci
Ionel Haidu
Mats Nilsson
Piotr Wezyk
Filippo Catani
Yi-Ying Chen
Sebastiaan Luyssaert
Gherardo Chirici
Alessandro Cescatti
Pieter S. A. Beck
Strong winds may uproot and break trees and represent a major natural disturbance for European forests. Wind disturbances have intensified over the last decades globally and are expected to further rise in view of the effects of climate change. Despite the importance of such natural disturbances, there are currently no spatially explicit databases of wind-related impact at a pan-European scale. Here, we present a new database of wind disturbances in European forests (FORWIND). FORWIND is comprised of more than 80 000 spatially delineated areas in Europe that were disturbed by wind in the period 2000–2018 and describes them in a harmonized and consistent geographical vector format. The database includes all major windstorms that occurred over the observational period (e.g. Gudrun, Kyrill, Klaus, Xynthia and Vaia) and represents approximately 30 % of the reported damaging wind events in Europe. Correlation analyses between the areas in FORWIND and land cover changes retrieved from the Landsat-based Global Forest Change dataset and the MODIS Global Disturbance Index corroborate the robustness of FORWIND. Spearman rank coefficients range between 0.27 and 0.48 (p value < 0.05). When recorded forest areas are rescaled based on their damage degree, correlation increases to 0.54. Wind-damaged growing stock volumes reported in national inventories (FORESTORM dataset) are generally higher than analogous metrics provided by FORWIND in combination with satellite-based biomass and country-scale statistics of growing stock volume. The potential of FORWIND is explored for a range of challenging topics and scientific fields, including scaling relations of wind damage, forest vulnerability modelling, remote sensing monitoring of forest disturbance, representation of uprooting and breakage of trees in large-scale land surface models, and hydrogeological risks following wind damage. Overall, FORWIND represents an essential and open-access spatial source that can be used to improve the understanding, detection and prediction of wind disturbances and the consequent impacts on forest ecosystems and the land–atmosphere system. Data sharing is encouraged in order to continuously update and improve FORWIND. The dataset is available at https://doi.org/10.6084/m9.figshare.9555008 (Forzieri et al., 2019).


Natural forest disturbances represent a serious peril for maintaining productive forests. Studies indicate that their occurrence can reduce primary production and partially offset carbon sinks or even turn forest ecosystems into carbon sources (Kurz et al., 2008; Yamanoi et al., 2015; Ziemblińska et al., 2018). This is particularly critical for windthrow and tree breakage due to strong winds, which represents a major natural disturbance for European forests (Schelhaas et al., 2003; Seidl et al., 2017). Such disturbances are intensifying globally, a trend that is expected to continue with further climate change (Bender et al., 2010; Knutson et al., 2010; Seidl et al., 2014).
European windstorms are associated with areas of low atmospheric pressure that typically occur in the autumn and winter months (Martínez-Alvarado et al., 2012). Deep low-pressure areas frequently track across the northern Atlantic Ocean towards Western Europe, passing the northern coasts of Great Britain and Ireland and into the Norwegian Sea. However, when they track further south, they can potentially hit any country in Europe. In 1999, windstorm Lothar damaged approximately 165 million cubic metres of timber mainly in France, Germany and Switzerland (Gardiner et al., 2010), which is equivalent to about 140 % of the average annual roundwood harvested in the countries affected (FAOSTAT, 2019). In 2005, 75 million cubic metres were damaged by windstorm Gudrun in Sweden (Gardiner et al., 2010), equivalent to about 1 year of cuttings in the same area (FAOSTAT, 2019). In 2007, windstorm Kyrill caused the loss of 49 millon cubic metres of timber in Germany and the Czech Republic. In 2009 and 2010, windstorms Klaus and Xynthia hit forests in France and Spain and caused timber losses totalling approximately 45 million cubic metres. In 2018, windstorm Vaia hit the northeastern regions of Italy causing a damaged growing stock volume of about 8.5 million cubic metres.
The socio-economic consequences of wind disturbances can be especially critical for local economies highly dependent on the forest sector. Countries in Northern Europe, Central Europe and Eastern Europe, where the forest sector may cover up to 6 % of the national GDP (Forest Europe, 2015), are, therefore, potentially more vulnerable to wind-related impacts.
Despite the risks they pose, spatially explicit databases of wind disturbances across Europe currently do not exist. Recent assessments of current and future forest damage due to windstorms at a European scale are based on catalogues of disturbances collected at country level (Gregow et al., 2017; Schelhaas et al., 2003; Seidl et al., 2014). Such databases (e.g. FORESTORM) are subject to multiple sources of bias and uncertainty associated with the diversity of the underlying inventories. Furthermore, estimates of forest damage aggregated at a national scale may only partially represent the spatial variability of the phenomenon. In fact, the coarse spatial resolution of such data hampers inferential analysis of potential drivers of forest vulnerability and their use in spatially explicit models to monitor or forecast wind-related impacts (Masek et al., 2015; Phiri and Morgenroth, 2017). Despite the lack of systematic mapping of wind disturbances in European forests, a multitude of local, national and transnational initiatives have accurately mapped forest areas affected by wind over the last decades. These data represent highly informative observational records for characterizing spatial patterns of forest damage. However, they are collected by different institutes and are often difficult to retrieve or poorly documented. Since 2012, the Copernicus Emergency Management Service (https://emergency.copernicus.eu/, last access: 20 December 2019) has produced maps of natural disasters throughout the world based on the analysis of satellite images and other geospatial data. While this important initiative can help map wind-affected areas, it only covers recent years and, being an on-demand service, it is not comprehensive, as it depends on the interests of individual authorized users of the service to map a given forest disturbance.
In this study, we try to fill the above-mentioned gap. To achieve this, we collected and harmonized 89 743 forest areas damaged by wind into a consistent geospatial dataset. The work was carried out through a unique joint effort of 27 research institutes and forestry services across Europe. This collaboration led to the first spatially explicit database of wind disturbances in European forests over the period 2000–2018, hereafter referred to as the FORWIND database. We believe that it provides essential spatial information for improving our understanding of forest damage from wind and can assist in large-scale systematic monitoring and modelling of forest disturbances and their effects on the land–atmosphere system. In the following sections, we describe the data collection, the harmonization process and the cross-comparison performed against satellite retrievals of changes in vegetation cover and data from national inventories of forest disturbances. We conclude the data description with some examples of the possible usage of the FORWIND database.
Table 1List of institutions responsible for wind disturbance mapping and the corresponding number of records collected and acquisition methods employed.
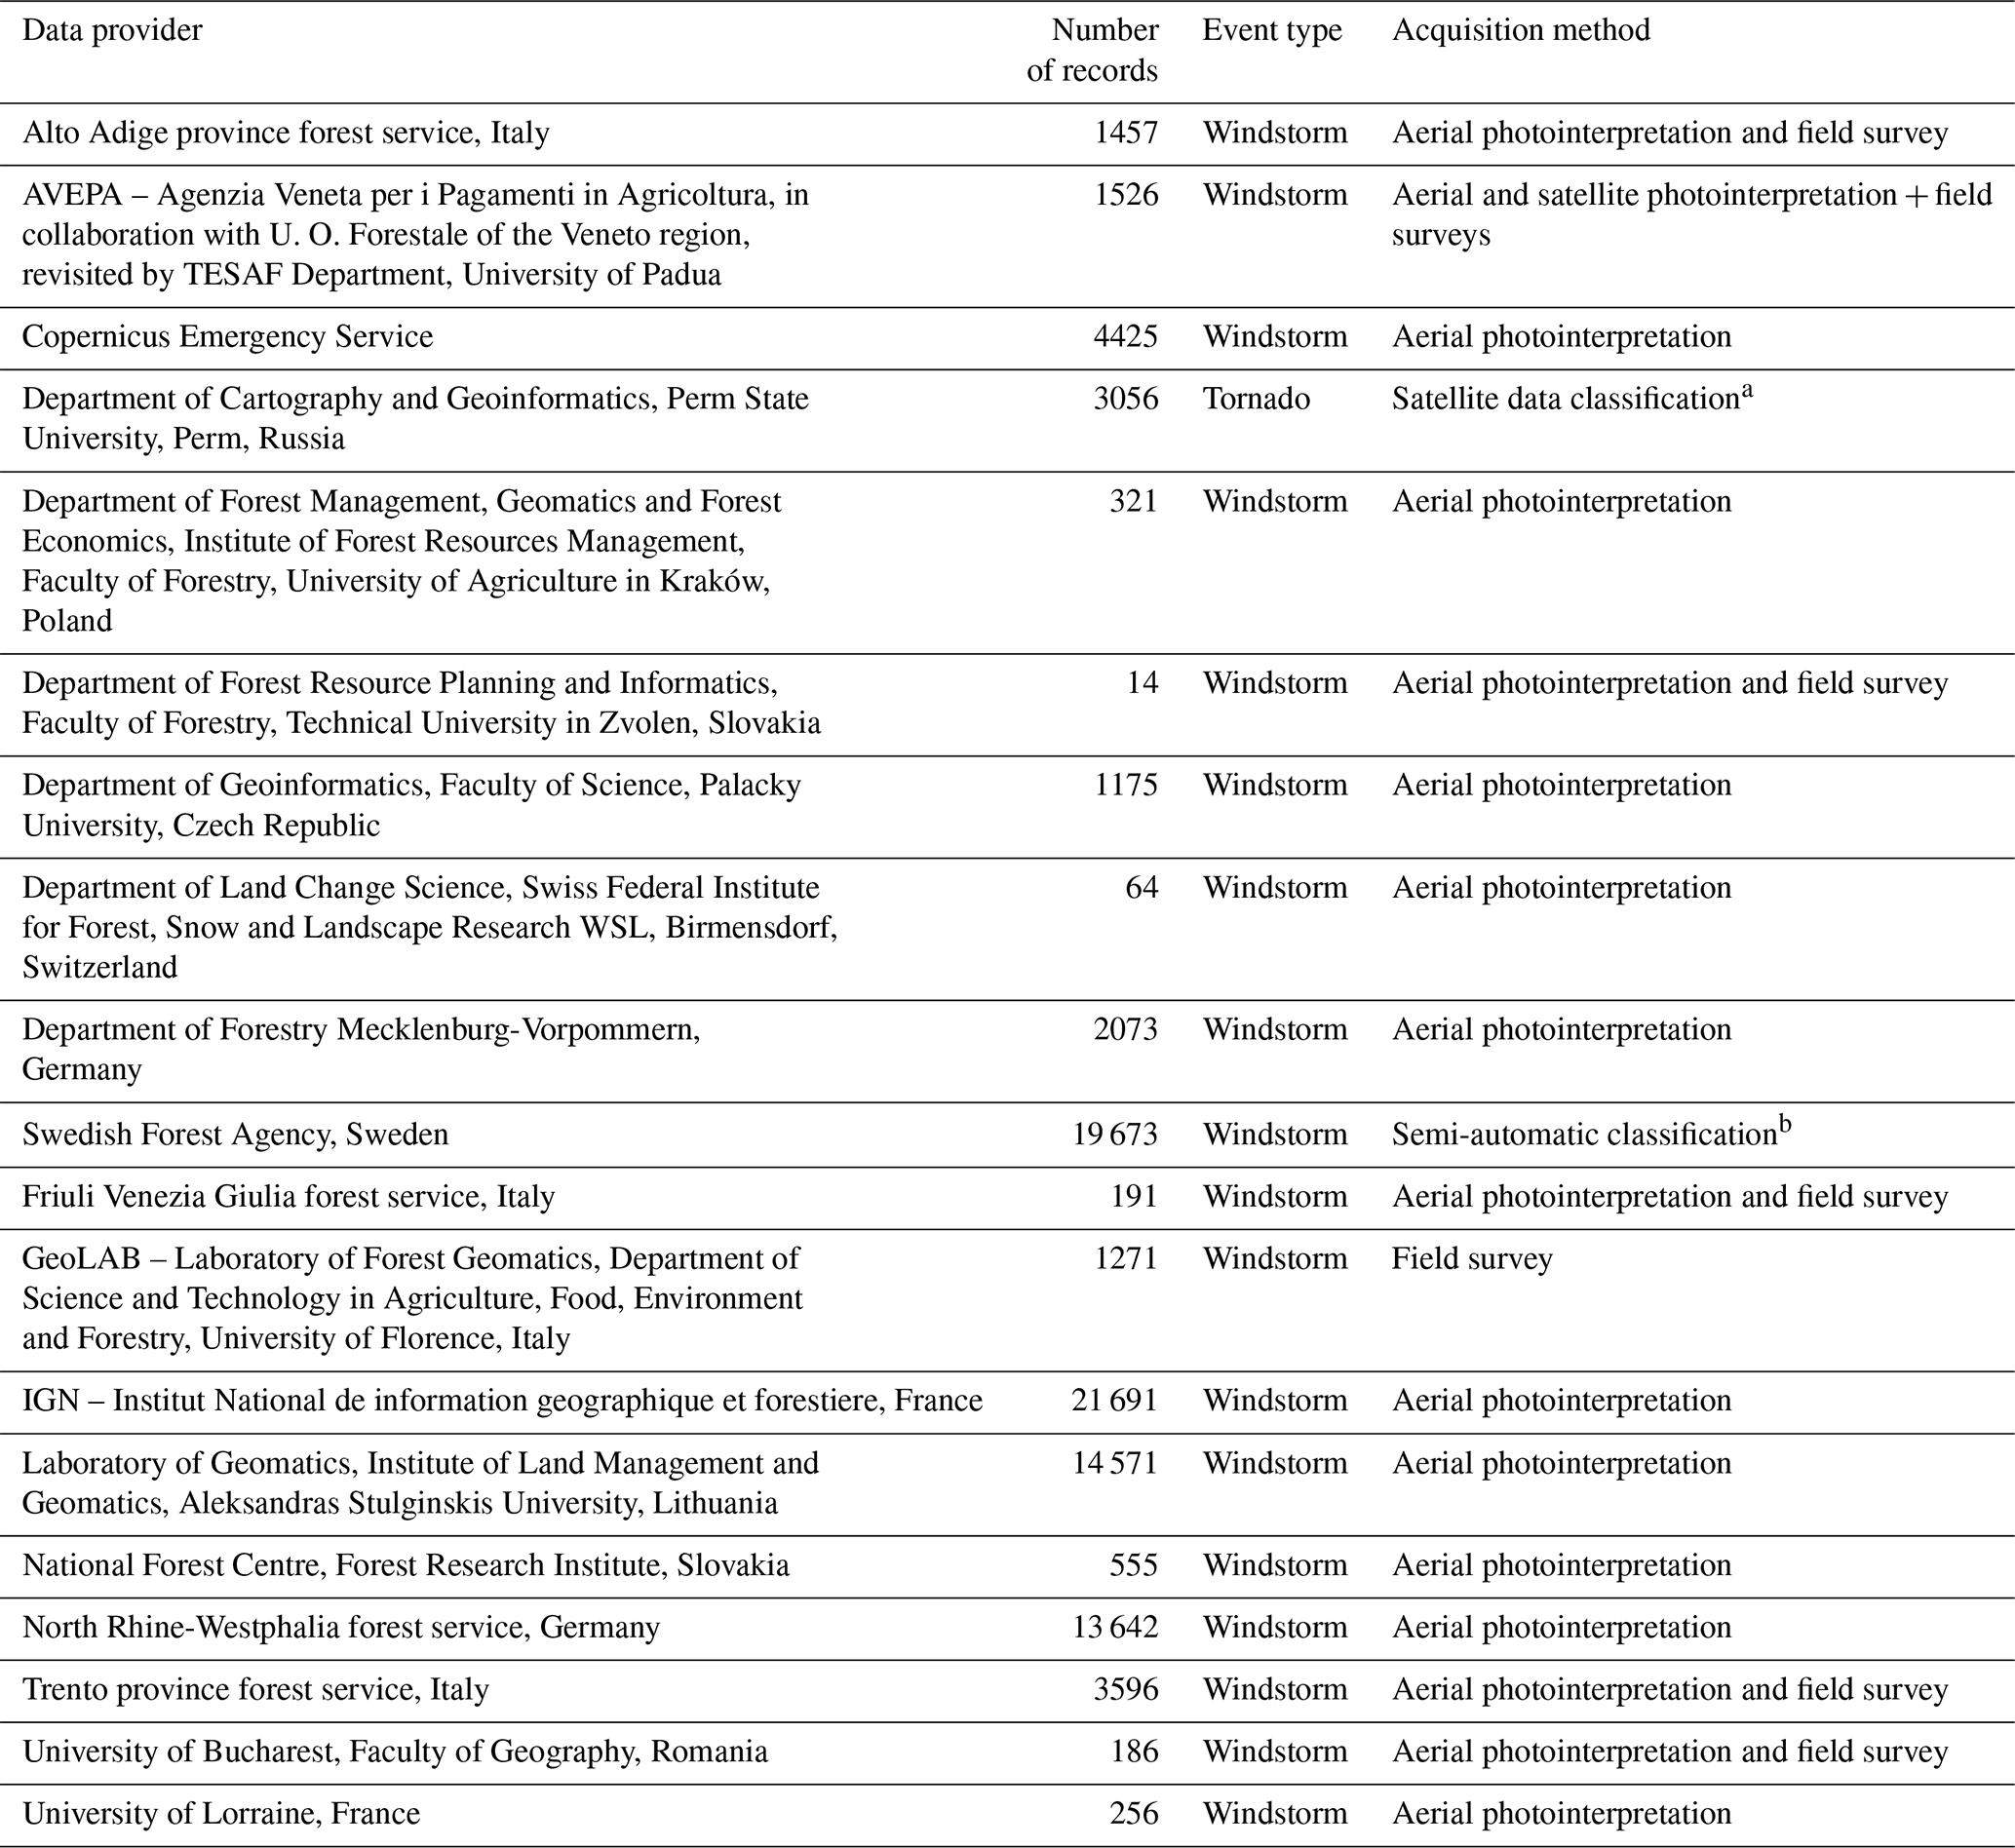
a Spatial delineation of tornado-related impacts on forests have been based on a semi-automatic algorithm and every record has been singularly validated based on visual inspection of high-resolution satellite images (Shikhov and Chernokulsky, 2018). b Areas subject to wind disturbances have been retrieved for FORWIND by intersection of the 2005 registered forest clear-cuts between 7 January and 31 December 2005 (http://skogsdataportalen.skogsstyrelsen.se/Skogsdataportalen/, last access: 20 December 2019), with the spatial delineation of windstorm Gudrun (Gardiner et al., 2010). The use of forest clear-cuts as proxy for wind-affected areas is reasonable because the morning after the storm all normal felling activity stopped and moved to storm-damaged areas (Swedish Forest Agency, personal communication, 2019).
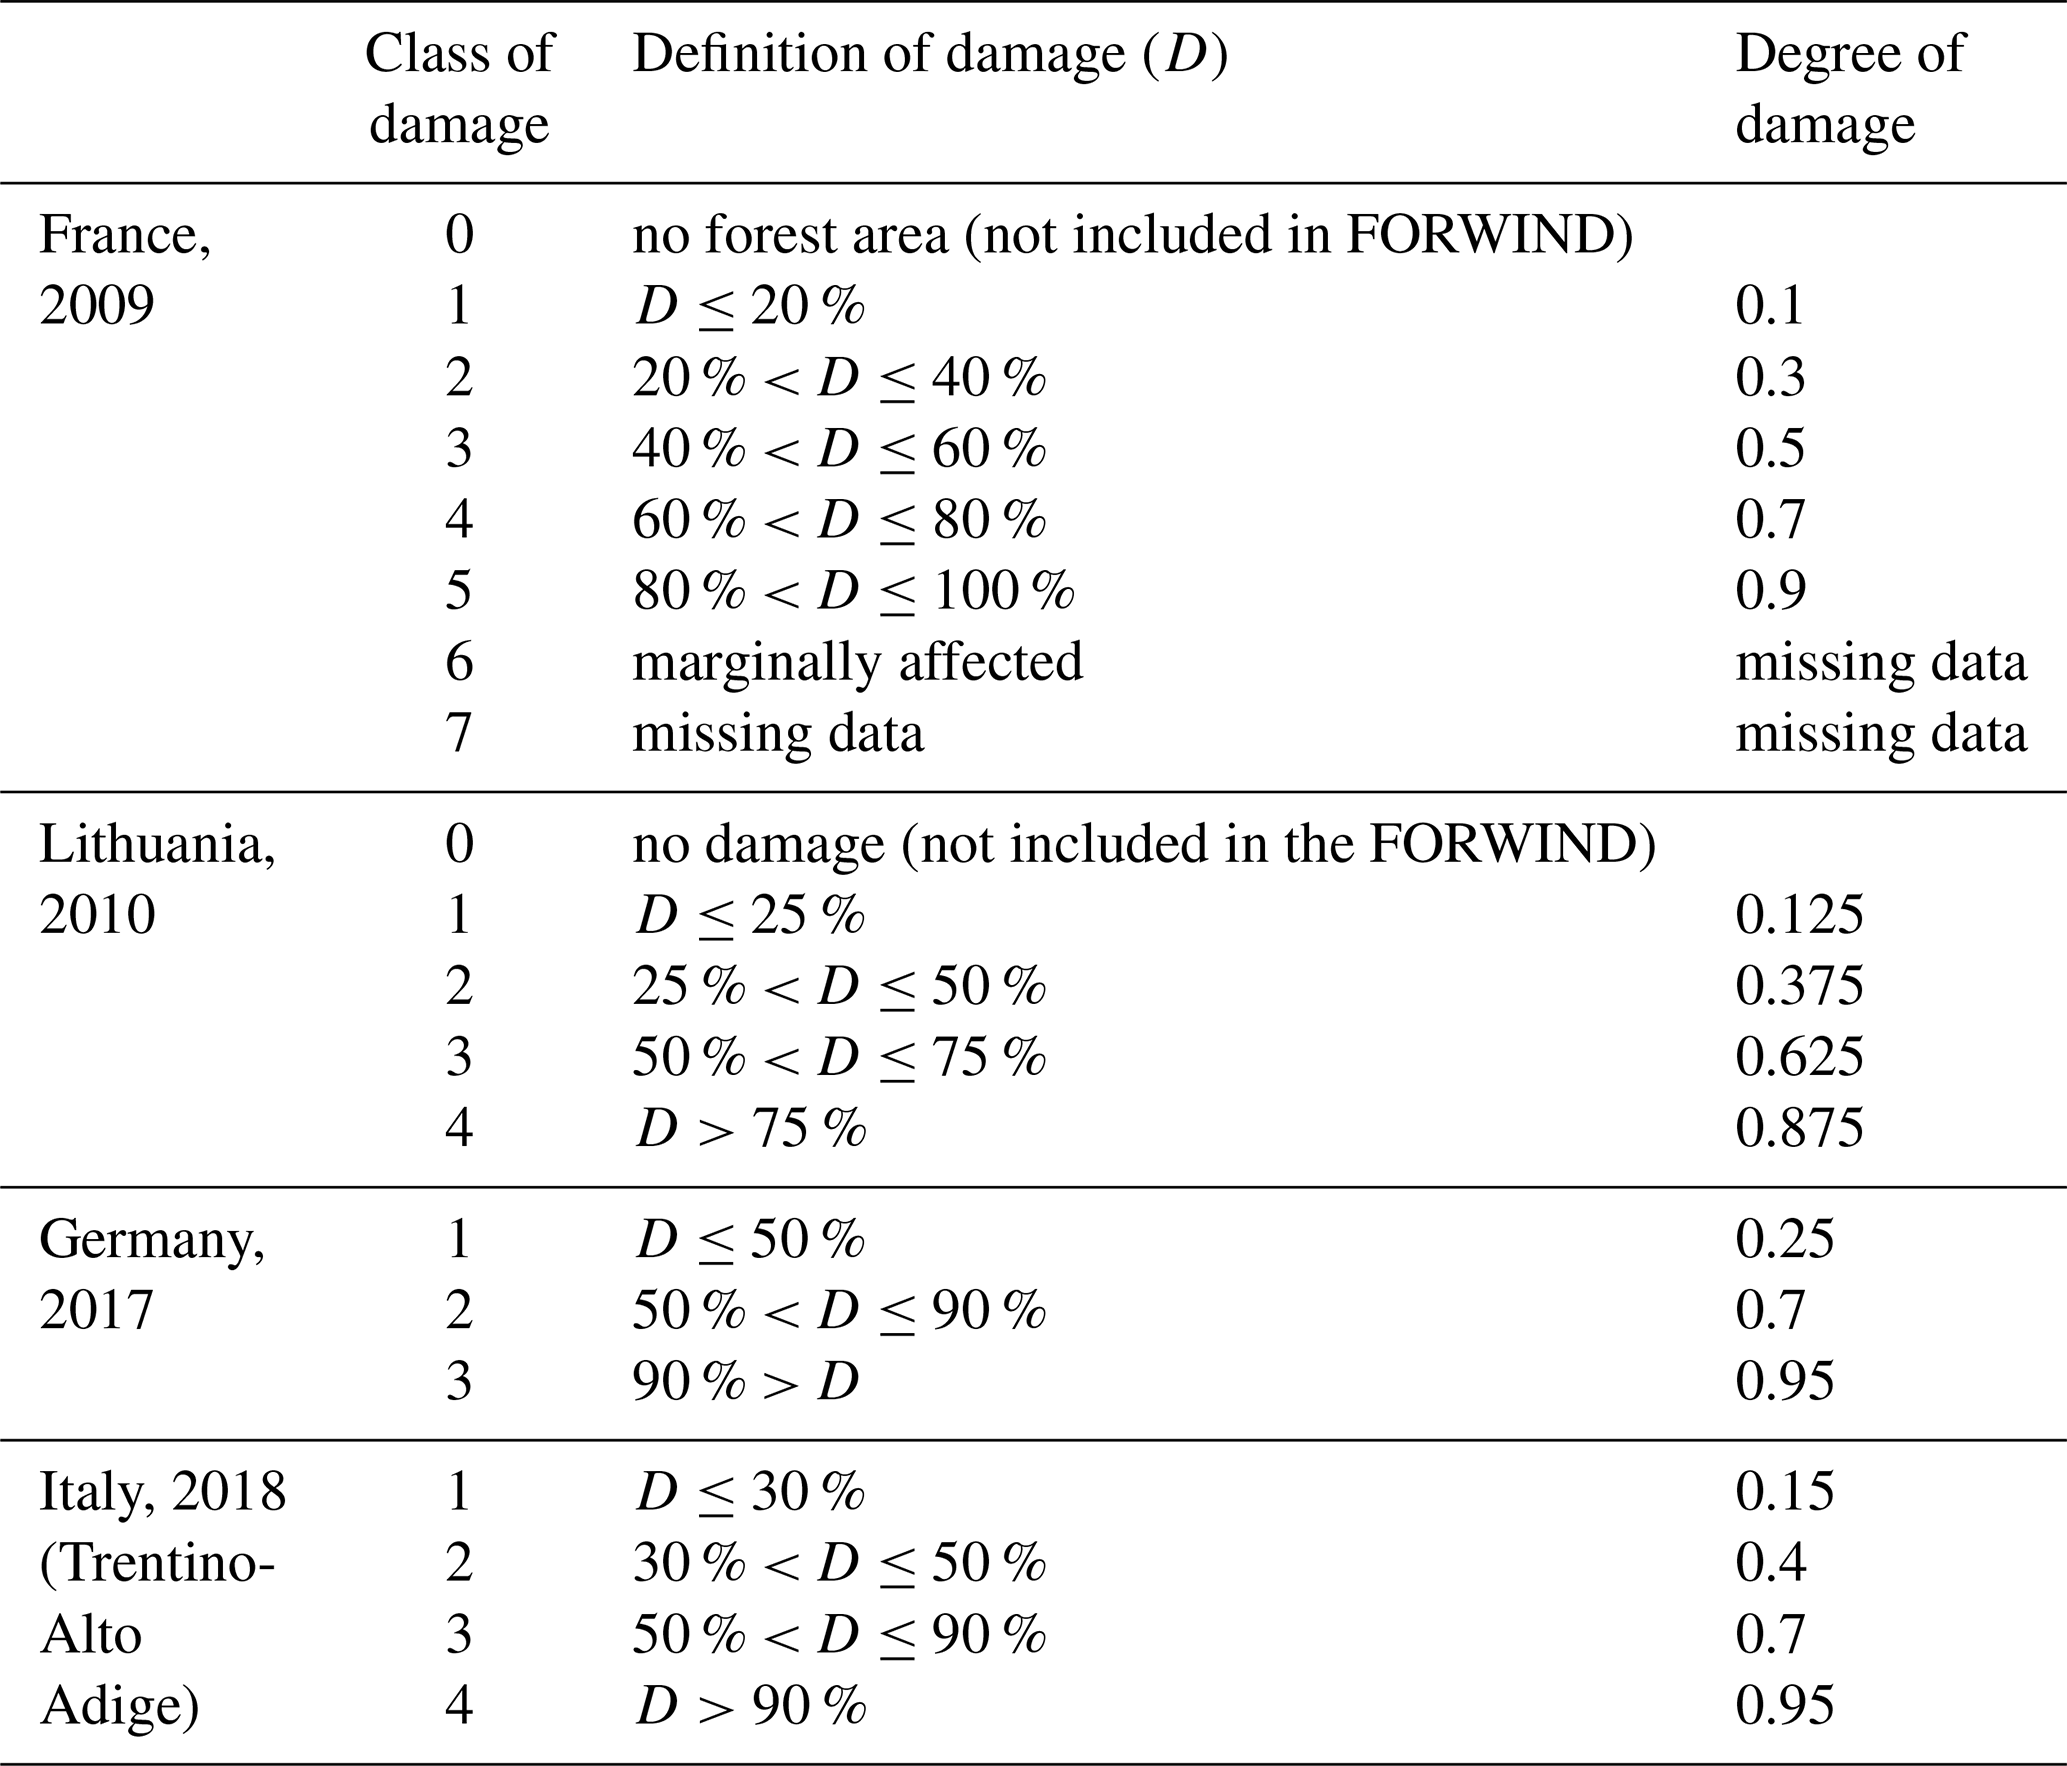
Table 2Conversion table for passing data from class of damage to degree of damage. Records of windstorms that occurred in Italy in 2015 (Toscana) and in 2018 (Veneto) are already expressed as damage degree in a consistent range between 0 (no damage) and 1 (full destruction of forest pattern).
We collected wind disturbance events caused by windstorms or tornadoes that occurred in Europe between 2000 and 2018. A wind disturbance event is represented by a geo-referenced polygon that delineates the damaged forest stand, regardless of the degree of damage. The original acquisition of the polygons was made by aerial and satellite photointerpretation or field survey (Table 1). Therefore, the polygons are delineated when a reasonably homogeneous patch of damaged forest is detected from the ground or remotely. The data were managed mostly on the Google Earth Engine platform (Gorelick et al., 2017) to efficiently quantify the extent of disturbances over large scales and extract additional informative attributes (e.g. Hansen et al., 2013; McDowell et al., 2015). We structured the data collection process in four main phases, described below.
-
Literature review and data gathering. We searched PubMed and Scopus for articles published up to January 2019, with no language restrictions, using the search terms “wind disturbance”, “windthrow”, “forest damage”, “wind damage”, or “forest disturbance” and “Europe” or a single country name in the publication title or abstract. The identified studies had mainly mapped the effects of wind on forests for single events and/or for a limited areal extent. We then retrieved the spatial delineation of the observed wind damage from the corresponding authors or contact persons responsible for the data acquisition. The collected data were originally recorded by different research institutes and international initiatives across Europe using diverse methodologies. Table 1 lists the data providers and the acquisition methods.
-
Coordinate system transformation. The wind disturbances were transformed to the same geographical unprojected coordinate system (World Geodetic System 1984, WGS84, EPSG:4326).
-
Spatial segregation. The spatial segregation of each record was verified. In cases where multiple features for the same event overlapped, they were merged.
-
Harmonization of the degree of damage. A damage classification for forest disturbances was originally recorded for windstorms that occurred in France in 2009, in Lithuania in 2010, in Germany in 2017, and in Italy in 2015 and – for part of the records – in 2018. In order to make these records comparable in terms of the severity of damage, the original classes were harmonized into a single damage metric following the rationale reported in Table 2. The resulting degree of damage varies between 0 (no damage) and 1 (full destruction of the forest patch). Information on the degree of damage is available for ∼48 % of records and is included as a basic attribute when available (Table 3).
Table 3Attribute table of the FORWIND database. The name and description of the attributes associated with each wind disturbance in FORWIND and listed in the .dbf file are given. Missing data are reported as −999.
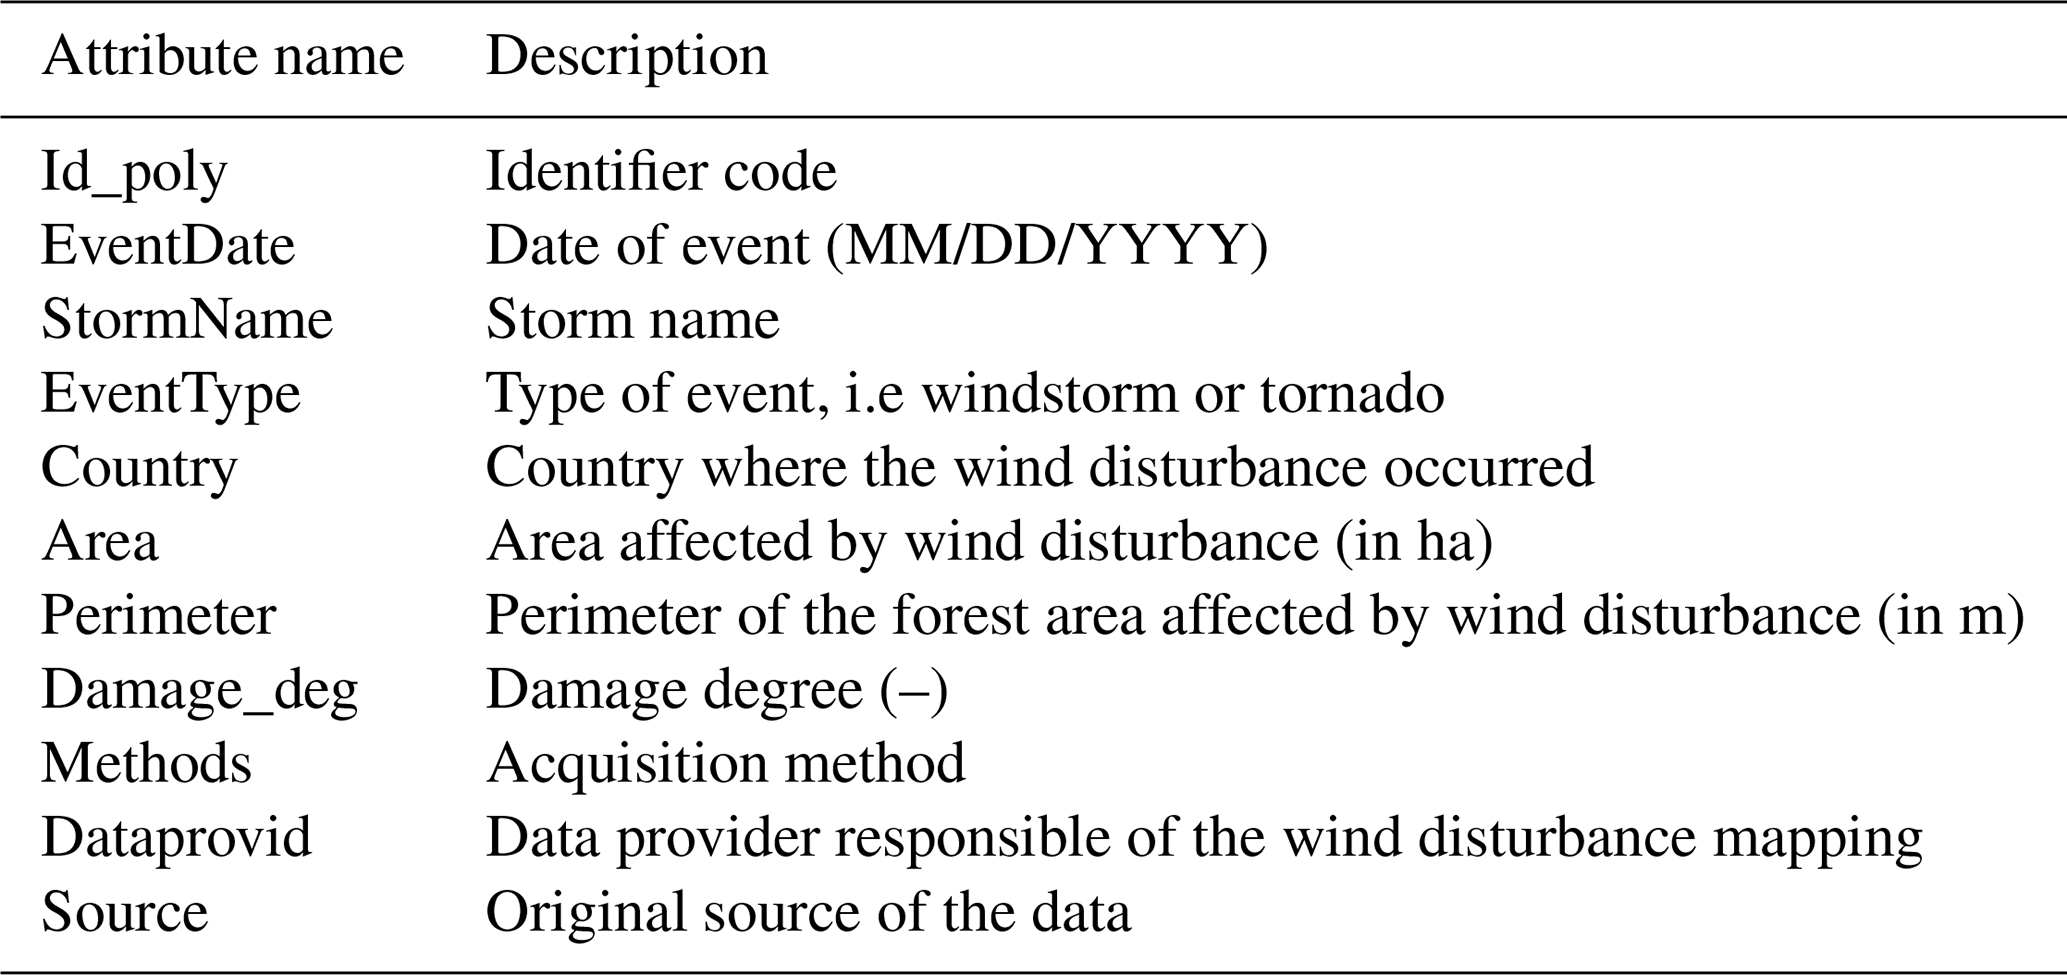
The FORWIND database is the final output of the data collection procedure and it is publicly available at https://doi.org/10.6084/m9.figshare.9555008 (Forzieri et al., 2019). The FORWIND dataset contains records as polygon features in shapefile format (.shp). The geometry of a feature is stored as a shape comprising a set of vector coordinates corresponding to the boundaries of the area of a given wind disturbance. Records are geo-referenced in geographical coordinates, i.e. latitude and longitude, following the WGS84 standard (EPSG:4326). Basic attributes of each disturbance (Table 3) are provided in an associated table, stored in a .dbf file.
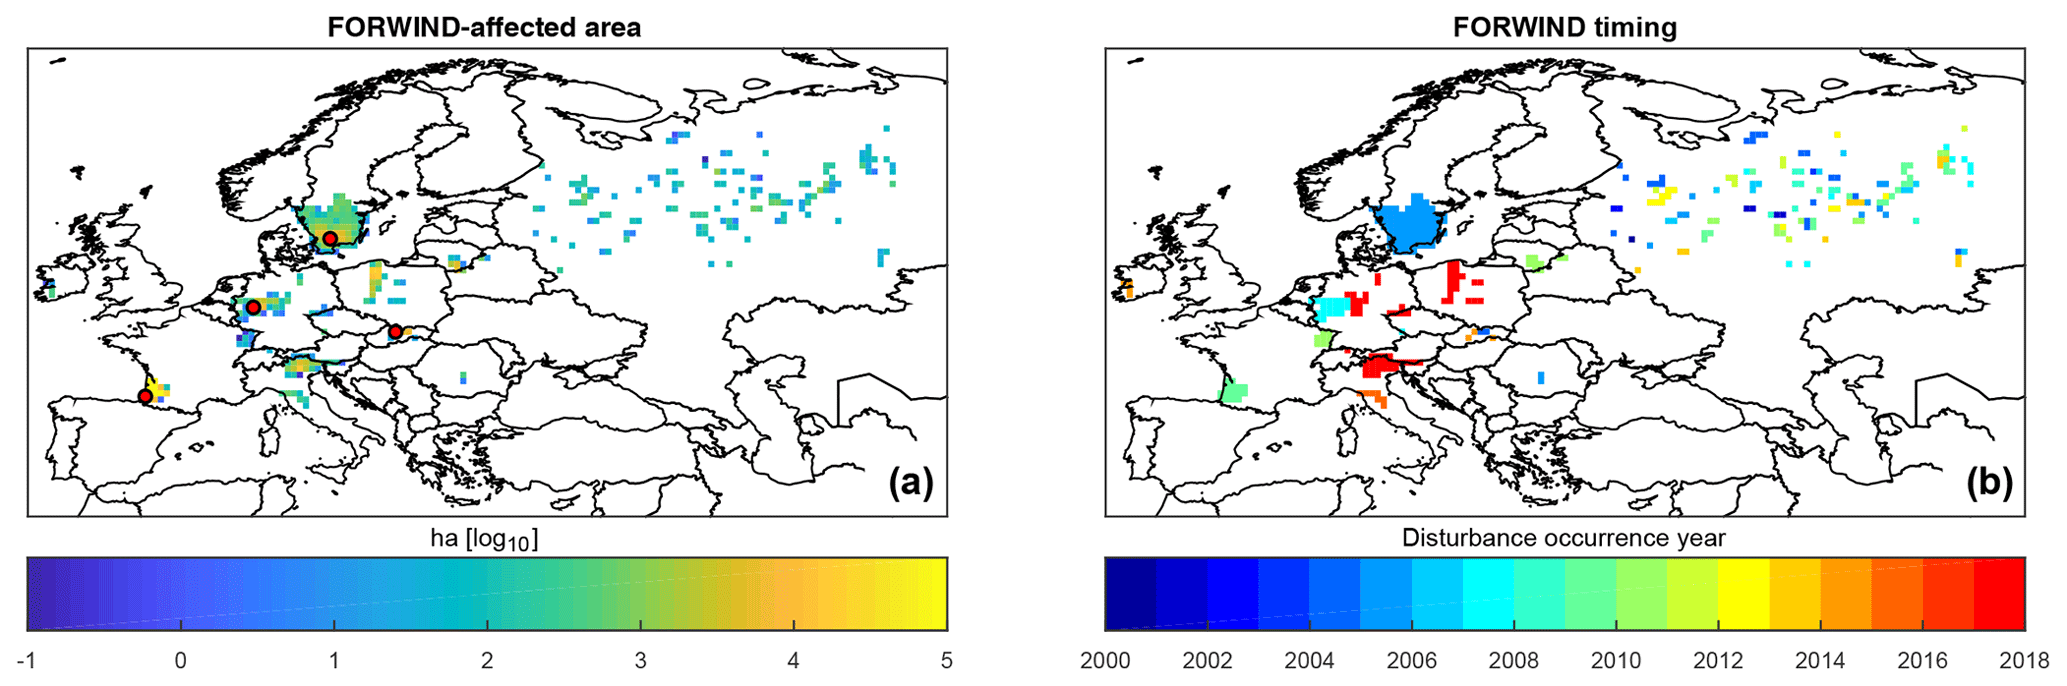
Figure 1Spatial and temporal distribution of wind disturbances in the FORWIND database. (a) The total area affected by wind disturbances over the multi-year observational period (2000–2018) in 0.5∘ cells. (b) Wind disturbance occurrence year in the same cells. Red circles in (a) refer to site locations shown in Fig. 2.

Figure 2Examples of wind disturbances recorded in the FORWIND database. (a, b) Tatra Mountains, Slovakia, affected by a windstorm in 2004. (c, d) Southern Sweden, affected by windstorm Gudrun in 2005. (e, f) Western Germany, affected by windstorm Kyrill in 2007. (g, h) Western France, affected by windstorm Klaus in 2009. Wind disturbances recorded in the FORWIND database are shown as red polygons. Background colours show forest and non-forest areas derived from the 25 m forest cover map from 2000 (Pekkarinen et al., 2009), while water bodies are derived from the 25 m land cover type map from 2006 (Kempeneers et al., 2011) (https://forest.jrc.ec.europa.eu/en/past-activities/forest-mapping/#Downloadforestmaps, last access: 20 December 2019). Site locations in (a, c, e, g) are shown in Fig. 1a, whereas the zoomed plots in (b, d, f, h) refer to black boxes in (a, c, e, g).
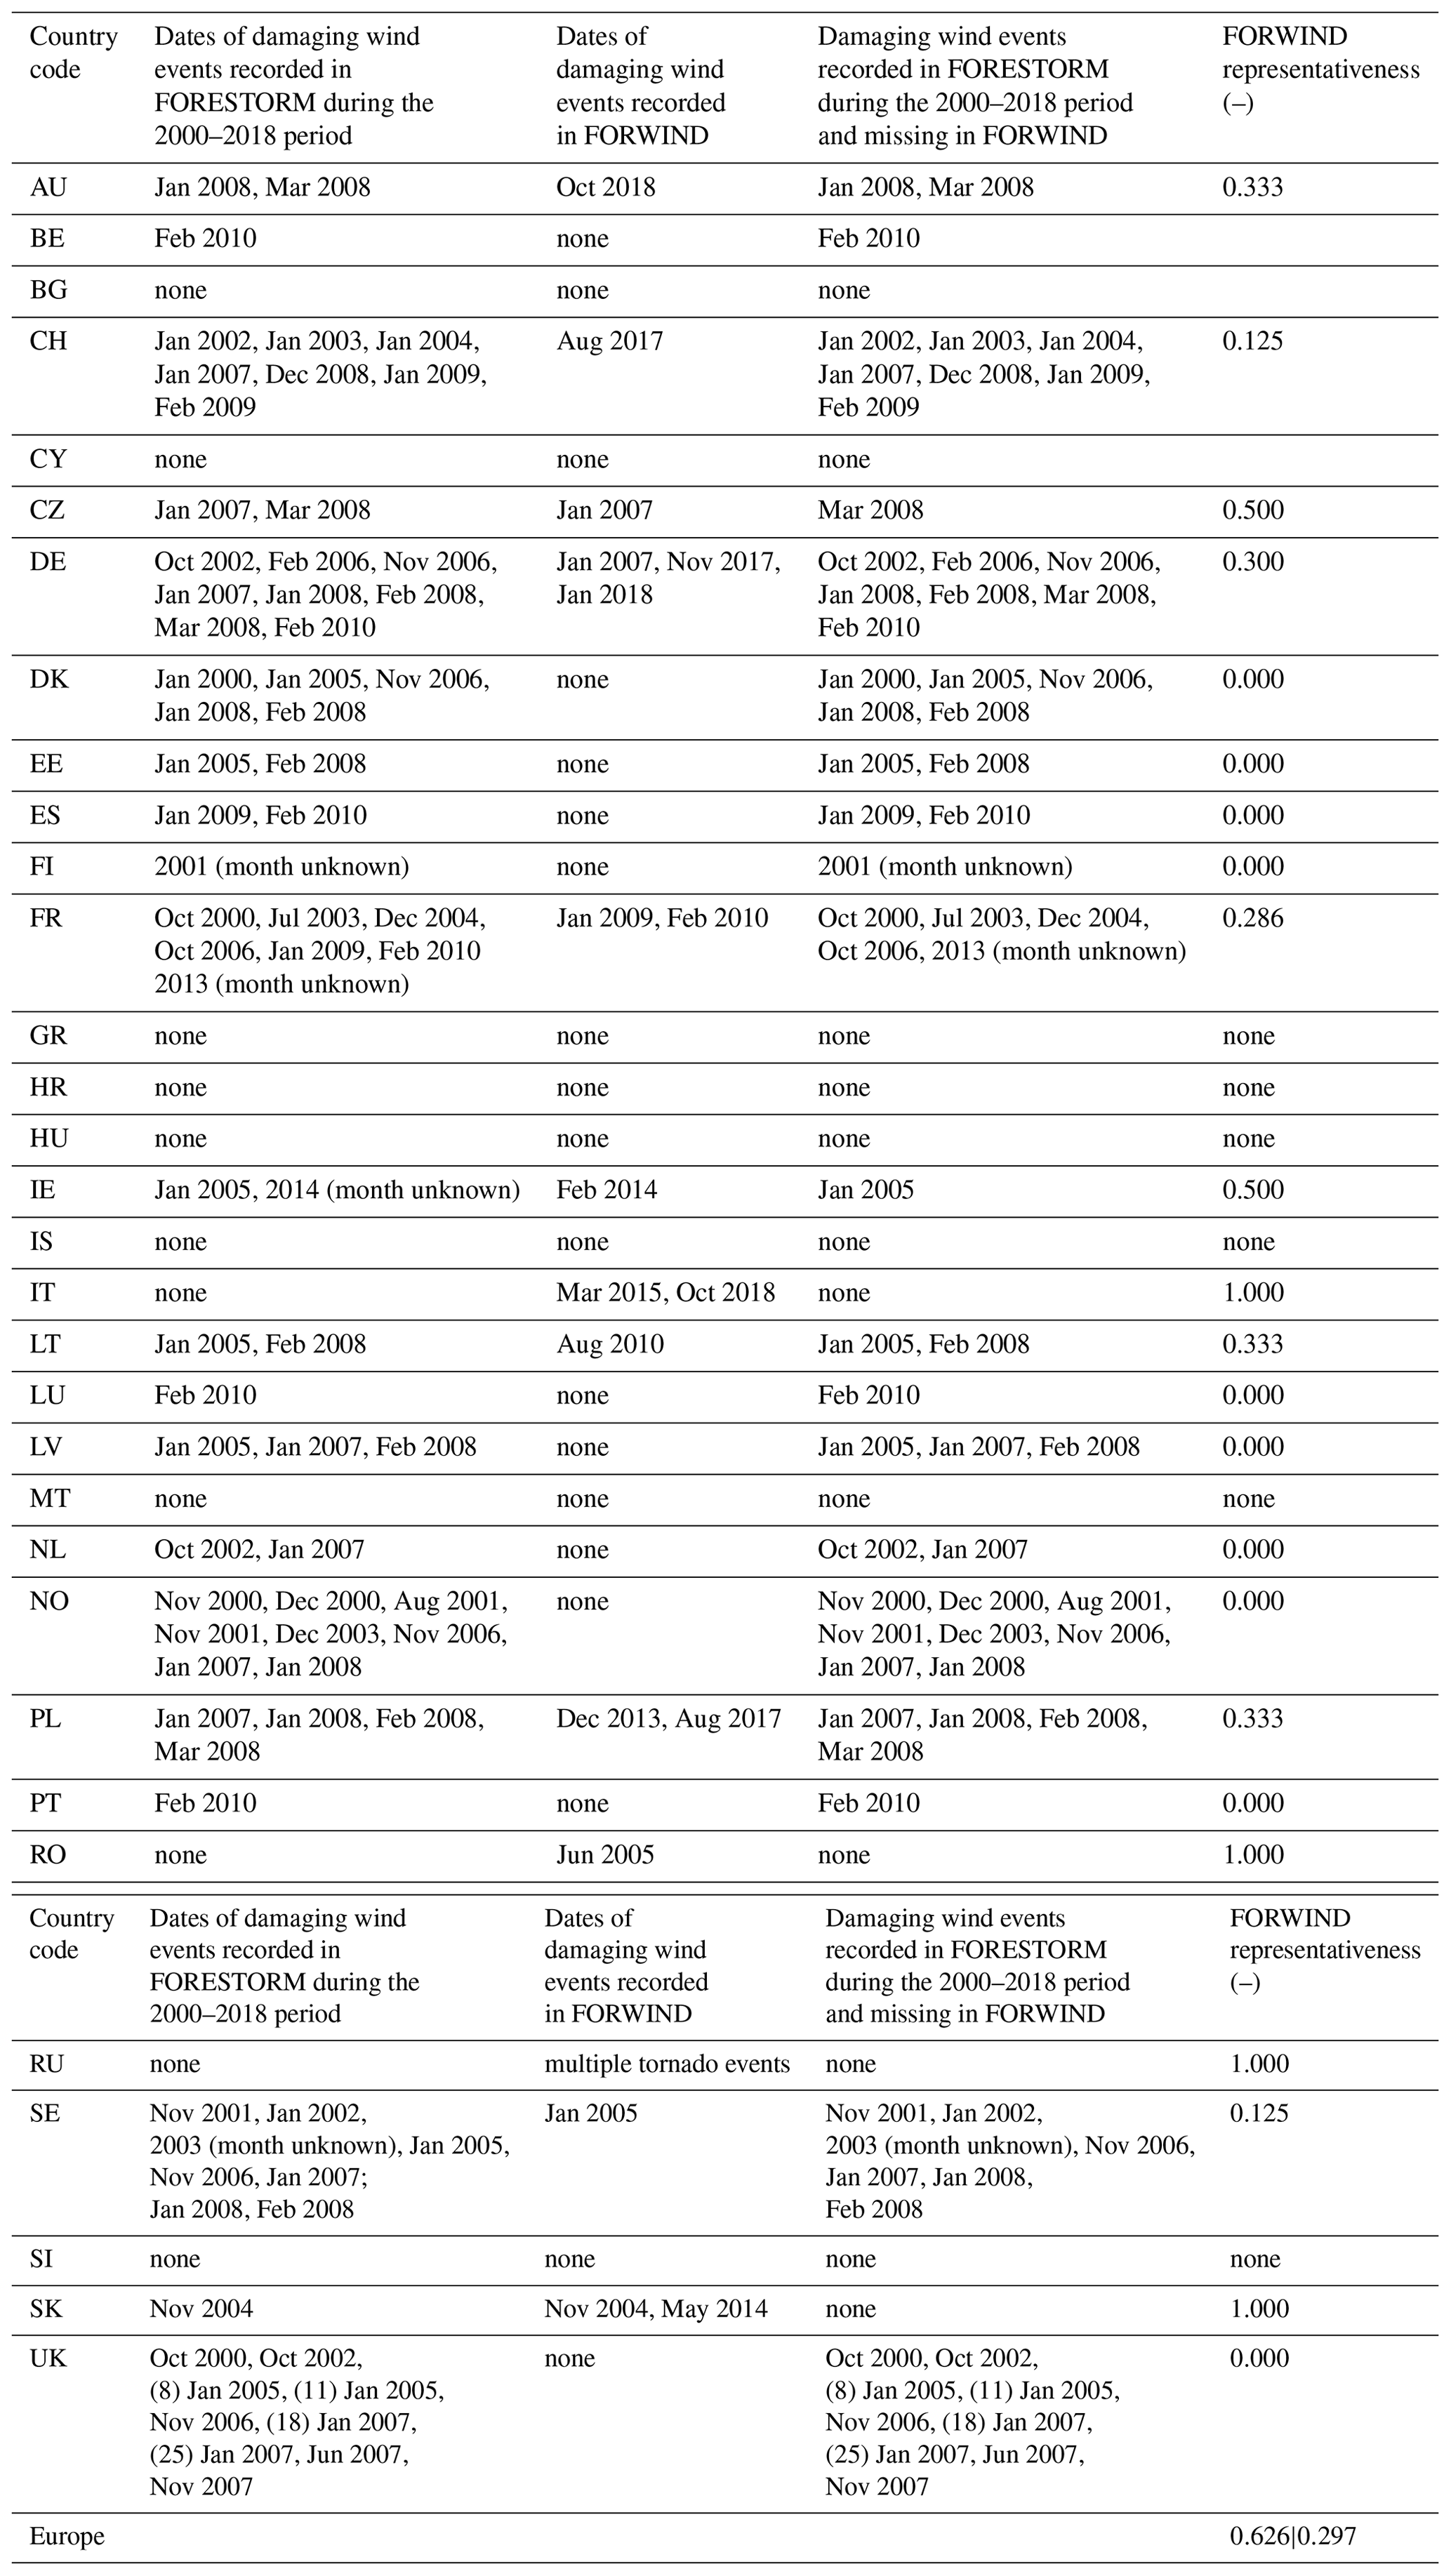
Overall, FORWIND includes 89 743 records, corresponding to a million hectares of forest area affected by wind disturbances during the 2000–2018 period. Each record should not be viewed as independent as a single storm may cause multiple, geographically disjunct disturbances. At a European level, the median forest disturbance patch caused by wind measures 1.07 ha (Table 4). However, there is substantial variability across disturbances and countries likely driven by the high heterogeneity of forest and landscape characteristics. Figure 1 shows the spatial and temporal variations of records in the FORWIND database. In order to better visualize the data, we summed the areas affected by wind disturbances in 0.5∘ cells (Fig. 1a). A similar aggregation was used to show the timing of the disturbances, here expressed as the year in which the most area was disturbed within a given cell (Fig. 1b). The current release of FORWIND includes wind disturbances that occurred in Austria, Switzerland, the Czech Republic, France, Germany, Ireland, Italy, Lithuania, Poland, Romania, Russia, Slovakia and Sweden. The major windstorms that occurred over the last 2 decades are included in FORWIND: Gudrun in 2005 (Sweden), Kyrill (Germany) in 2007, Klaus in 2009 (France), Xynthia in 2010 (Germany) and Vaia in 2018 (Italy). The high spatial detail of FORWIND is illustrated in Fig. 2 for some key windstorms. According to the institutions responsible for the data acquisition, the wind disturbances recorded in FORWIND exhaustively represent the damaged forest areas caused by those specific events. However, some known damaging wind events are currently missing in the database. In order to provide a more comprehensive assessment of the representativeness of FORWIND, for each country we derived the ratio between the number of wind events included and the number of all wind events that occurred and are known to have caused forest damage (Table 5). The number of known damaging events is derived by summing up the number of distinct events recorded in FORESTORM (http://www.iefc.net/storm/, last access: 20 December 2019) and FORWIND during the 2000–2018 period. Therefore, the temporal representativeness ranges between 0 (all known wind disturbances are missing in FORWIND) and 1 (all known wind disturbances are included in FORWIND). Estimates of representativeness ranges between 0.13 and 1 amongst the countries included in FORWIND, with an average value of 0.63 at the European level (see Table 5). However, when countries currently missing in FORWIND are also accounted for, the average representativeness decreases to 0.30. These values should be viewed with caution as the estimated number of total damaging wind events resulting from FORWIND and FORESTORM could likely deviate from the actual ones. Future efforts should be aimed at populating FORWIND with the damaging wind events known to be missing.
Table 4Statistics of wind disturbance records collected in the FORWIND database aggregated at country level and for all of Europe.
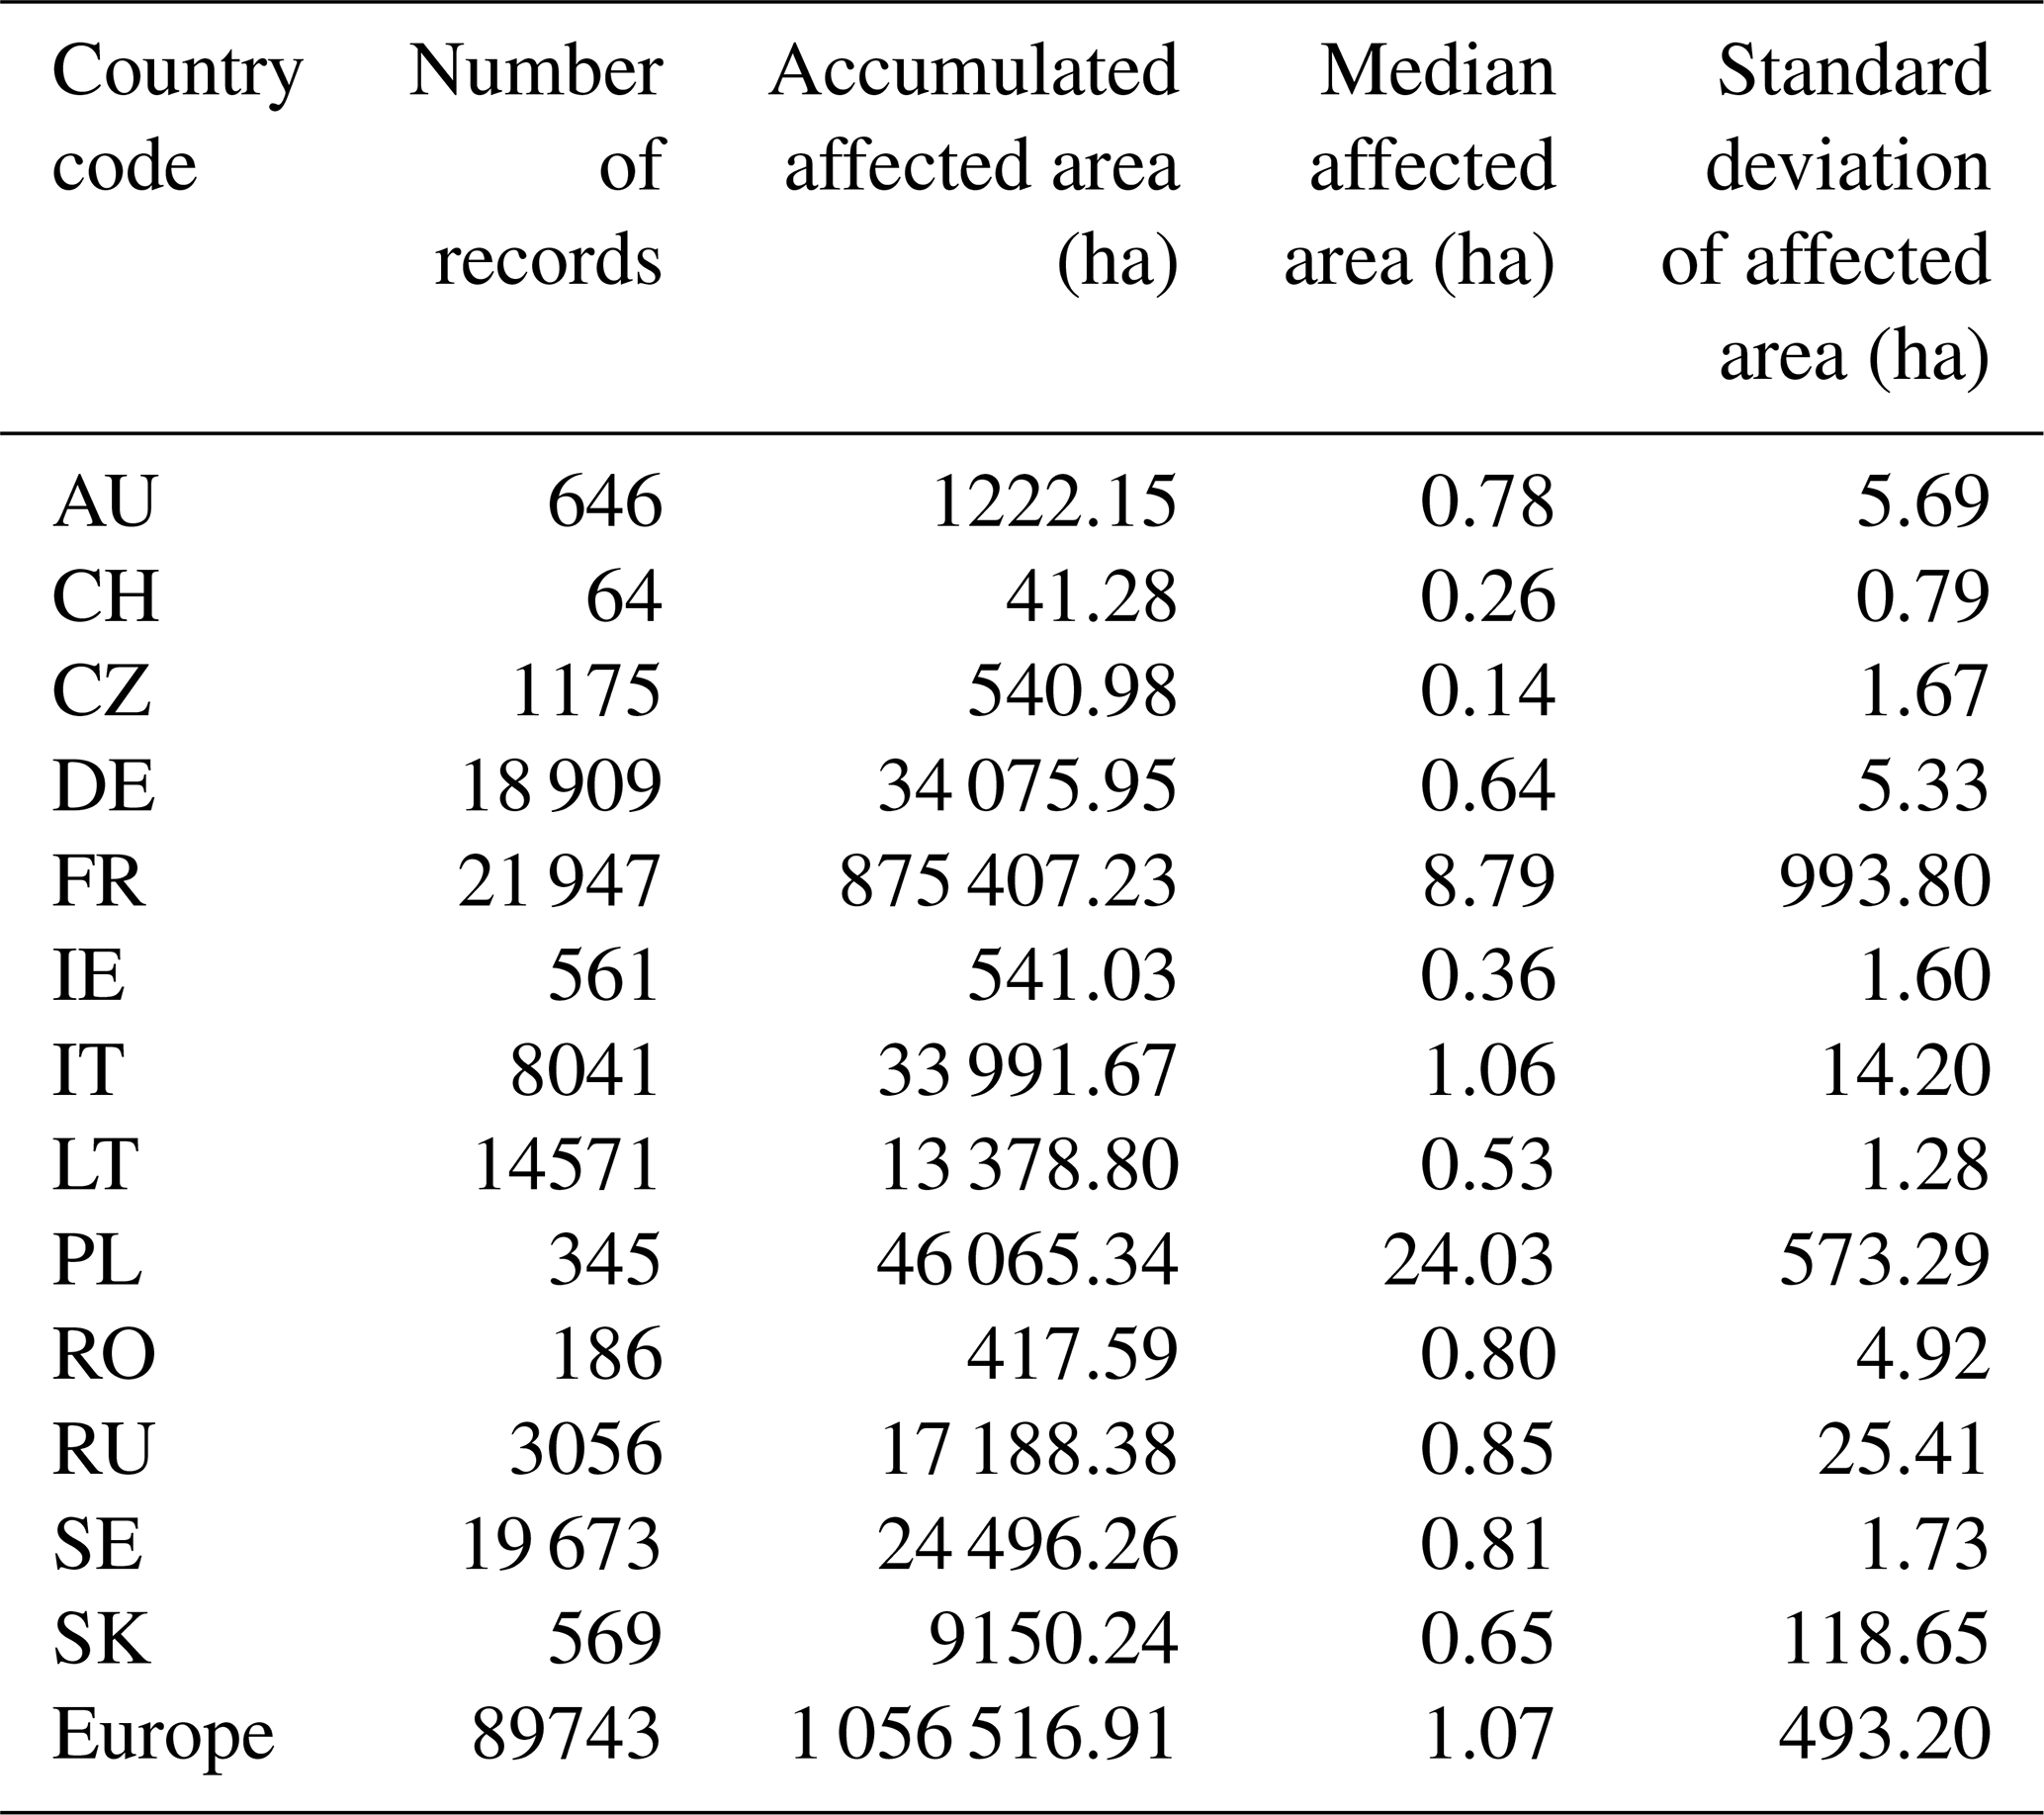
Table 5Representativeness of FORWIND. The first estimate of representativeness at the European level accounts for damaging wind events that occurred during the 2000–2018 period in the countries currently included in FORWIND. The second estimate of representativeness at the European level accounts for all damaging events occurring during the 2000–2018 period, including those countries currently missing in FORWIND.
The lack of alternative datasets with the same spatially explicit mapping of wind disturbances as in FORWIND does not allow for a standard validation exercise. Therefore, we evaluated the validity of FORWIND based on the plausibility of the collected spatial delineations of wind disturbances with respect to two satellite-based proxies of forest disturbances and estimates of forest damage reported in national inventories.
4.1 FORWIND versus Landsat-based forest cover loss
FORWIND was initially compared with satellite-based estimates of forest cover loss derived from the Global Forest Change maps (Hansen et al., 2013) (GFC, https://earthenginepartners.appspot.com/science-2013-global-forest, last access: 20 December 2019). GFC maps characterize the annual forest coverage at global scale during the period 2000–2018 at 30 m spatial resolution based on time series analysis of Landsat images. Forest cover loss is defined as an area that has changed from a state of forest to non-forest following a given disturbance event (natural or anthropogenic). The change detection is based on the variation in the spectral properties of the land surface. Windstorm events in Europe often occur in autumn and at the beginning of winter, when the availability of cloud-free images is typically much more limited than in summer. Hence, satellite retrievals of forest cover loss may miss the exact timing of the disturbance. Therefore, the GFC-based forest cover loss may only record wind disturbances the year after the event occurred. In addition, fallen trees following a windstorm or tornado often maintain their leaves for months. This may lead to limited or no change in land reflectance properties, even when cloud-free images are available. Therefore, satellite-based products may underestimate forest cover loss in the short-term (interannual scale). In order to account for these effects, we considered the forest cover loss by summing up the forest loss over the year of a given event together with that of the following year (lag-01). The loss estimate was quantified with respect to the pre-event conditions (the forest cover in the year before the event). To reduce potential contamination effects from other disturbances in the resulting total forest cover loss, we removed areas affected by fires the year following a wind event. Information on forest areas affected by fires were retrieved from the European Forest Fire Information System (EFFIS, http://effis.jrc.ec.europa.eu/, last access: 20 December 2019). Insect outbreaks, which may be triggered by large numbers of dead trees following wind disturbances (Stadelmann et al., 2013), generally lead to a slow change in tree cover, which may only marginally affect the 1-year temporal lag used for our estimates of forest cover loss. Furthermore, forest logging following a wind event can be considered a secondary effect of the strong winds, as it is often employed to reduce the risk of other forest disturbances (specifically insect outbreaks and fires). Therefore, the resulting estimates of forest cover loss for the selected areas should reflect wind disturbances first and foremost. We emphasize that Landsat-derived estimates of forest cover loss are affected by the uncertainty in satellite retrievals and do not represent the true impacts. However, their suitability for detecting forest disturbances over large scale has been widely recognized (Curtis et al., 2018; Hansen et al., 2013) and, therefore, they are here considered a good proxy of forest loss.
For each selected FORWIND record we computed the area of affected forest based on the spatial delineation of the polygon and the corresponding Landsat-derived forest cover loss and calculated the correlation between the two sets of estimates. In order to account for the spatial dependence structure of FORWIND data, correlation values were derived for 100 subsets of 1000 records randomly selected from the entire dataset. The final estimate of correlation was then quantified as the average of the correlation values derived from the 100 subsets.
Results for the whole dataset are shown in Fig. 3a. Overall, we found a modest but significant Spearman rank correlation coefficient (ρk=0.48; p value < 10−3), which supports the validity of FORWIND in mapping areas subject to changes of forest coverage due to wind disturbances. We point out that for this calculation we did not mask the data based on the degree of damage because such information is available only in some countries. However, a similar correlation analysis performed by rescaling the recorded areas based in their damage degree (for those records that report the information) led to higher correlation values up to 0.54. We further tested the sensitivity of our results to the temporal lag used to quantify the forest cover loss. To achieve this, we complemented the previous analysis (lag-01) using Landsat-based forest cover loss estimated for the year of the event only (lag-0) and the following year only (lag-1). In order to investigate possible scaling relations, the correlation analysis was performed accounting for the FORWIND records with a spatial extent above a given threshold derived from the percentiles 0, 0.25, 0.50 and 0.75 of the full dataset (corresponding to about 0, 0.5, 1 and 3.5 ha, respectively). Results show that correlation values between FORWIND affected areas and lag-0 forest cover loss tends to slightly decrease with an increasing size of the wind disturbance (Fig. 3b). The opposite pattern is observed for correlation values with lag-1 forest cover loss. The forest cover loss accumulated over the 2 years considered (lag-01) appears dominated by the contribution of lag-1 forest cover loss. We argue that such contrasting tendencies may be linked to the scale and climatology of extreme winds. Wind-related forest impacts of limited areal extent originate from local windstorms or tornadoes that may occur throughout the year. For these events, most of the damage is probably well captured by lag-0 effects, as it is more likely that cloud-free images are available after the event. In contrast, the larger and more damaging windstorms, which affect larger forest areas, typically occur in autumn and early winter (decreasing the likelihood of cloud-free images after the storm and before the end of the year). For these events, the inclusion of the lag-1 effect is key to characterize the impact on forest cover.

Figure 3Validation of the FORWIND database. (a) Density plot of FORWIND-affected area versus Landsat-derived forest cover loss, both expressed in logarithmic scale and for lag-01 effects. The colour reflects the number of records, and the legends report the Spearman rank correlation coefficient (ρk), the significance (p value) and the sample size (n). (b) Spearman rank correlation coefficients for different affected area thresholds (on the x axis) and different lagged effects are displayed in colour bars. Lagged effects considered include the forest cover loss cumulated over the event of a given year together with that of the following year (lag-01), forest cover loss estimated for the year event only (lag-0) and forest cover loss estimated for the following year only (lag-1). Panels (c) and (d) are the same as (a) and (b) but for the MODIS-derived Global Disturbance Index instead of the Landsat-derived forest cover loss. (e) Scatter plot of damaged growing stock volume estimated from FORWIND (on the x axis) and FORESTORM (on the y axis) for five windstorms: Slovakia in 2004 (SK2004), Sweden in 2005 (SE2005 – Gudrun), Germany in 2007 (GE2007 – Kyrill), the Czech Republic in 2007 (CZ2007 – Kyrill) and France in 2009 (FR2009 – Klaus). FORWIND estimates are derived using GlobBiomass-derived estimates of GSVs and reported damage degree information. Panel (f) is the same as (e) but with estimates of GSVs derived from Forest Europe national inventories and assuming a 100 % damage degree for all FORWIND records.
4.2 FORWIND versus MODIS Global Disturbance Index
FORWIND was also compared with an independent dataset of satellite-based estimates of forest disturbance as expressed by the MODIS-based Global Disturbance Index (Mildrexler et al., 2009) (MGDI, http://files.ntsg.umt.edu/data/NTSG_Products/MGDI/, last access: 20 December 2019). MGDI maps quantify the overall annual forest disturbance globally for the period 2004–2012 at 500 m spatial resolution. The disturbance retrieval is based on the variations in the enhanced vegetation index and land surface temperature following a given sudden change in forest cover. Consistent with the previous Landsat-based analysis – the total change in MGDI potentially related to a given wind disturbance was computed as the accumulated net change in MGDI over the event year and the following year (lag-01). The change was quantified with respect to the pre-event conditions (MGDI in the year before the event). The technique used to disentangle the fire signal, as well as the correlation and sensitivity analyses with respect to the temporal lags and wind disturbance size, were performed analogously to the previous validation exercise (Sect. 4.1).
Overall, we found a low but significant correlation coefficient (ρk=0.27; p value < 10−3) (Fig. 3c). The lower correlation compared to the Landsat-based dataset is presumably due to the coarser spatial resolution of MGDI that probably does not fully capture the changes in land surface properties due to wind disturbances (Mildrexler et al., 2009). This seems to be supported by the generally increasing correlation values up to 0.31 for wind disturbances of 1 ha consistently across the different temporal lags (Fig. 3d).
4.3 FORWIND versus FORESTORM
FORWIND data were finally compared with estimates of damaged growing stock volume (GSV) that are recorded at country level in the FORESTORM database for five windstorm events: Slovakia in 2004, Sweden in 2005 (windstorm Gudrun), Germany in 2007 (windstorm Kyrill), the Czech Republic in 2007 (windstorm Kyrill) and France in 2009 (windstorm Klaus). We derived the damaged GSV by multiplying the estimated GSV by the percentage damaged, both of which are reported in FORESTORM. An analogous metric was derived from FORWIND data by first calculating, for each FORWIND record, the amount of GSV lost by multiplying the areal average GSV by the damage level reported for the record. As the damage level was only reported for windstorm Klaus, for the other events we assumed a damage level equal to the average level reported for windstorm Klaus weighted on the spatial extent of each record. The GSV was retrieved from the GlobBiomass dataset (Santoro et al., 2018; https://doi.org/10.1594/PANGAEA.894711), which is based on multiple remote sensing products and is considered the state-of-the-art global biomass product. This satellite-based GSV estimate refers to the year 2010 and has a spatial resolution of 100 m. The damage to GSV were then summed by event and country. Event-scale FORWIND damaged GSVs were then compared with estimates derived from FORESTORM.
Overall, results show that the magnitude of damage estimated from FORWIND and FORESTORM are largely different, except for windstorm Klaus in 2009 in France, for which we found a very good agreement (Fig. 3e). For most of the events, however, FORESTORM tends to systematically give higher forest damage estimates than FORWIND, with differences exceeding 90 %. We note that such differences persist when we derive FORWIND estimates of damaged GSV assuming a 100 % damage degree for all records (not shown). Therefore, the uncertainty in the damage degree in FORWIND does not substantially affect the difference between FORWIND and FORESTORM. We recognize that estimates of forest damage based on FORWIND are fully dependent on the GSV derived from GlobBiomass. Indeed, any deviations of the mapped GSV from the true forest state are inherently translated into our damaged GSV estimates. In particular, the GSV map refers to the year 2010; therefore, it is very likely that it largely reflects the biomass conditions following, rather than preceding, the windstorm events (all five events considered in this validation exercise occurred before 2010).
In order to disentangle such source of bias, we derived country-scale estimates of average GSVs for the year 2000 (pre-event conditions) from the State of Europe's Forest dataset (Forest Europe, 2015) (https://www.foresteurope.org/docs/SoeF2015/OUTPUTTABLES.pdf, last access: 20 December 2019). We then derived the damaged GSVs by multiplying Forest Europe-derived GSVs by the total forest area affected for each of the considered wind events by assuming a 100 % degree of damage. Furthermore, as wind disturbance typically affects taller forest patches and probably more productive trees compared to the country-scale average, we rescaled previous estimates of damaged GSVs based on the ratio between the average tree height computed over wind-affected areas and the average tree height computed over all of whole vegetated land in the country. Tree height values where retrieved from 1 km spaceborne light detection and ranging (lidar) data acquired in 2005 by the Geoscience Laser Altimeter System (GLAS) aboard ICESat (Ice, Cloud and land Elevation Satellite), (https://webmap.ornl.gov/wcsdown/dataset.jsp?ds_id=10023, last access: 20 December 2019) (Simard et al., 2011).
Similar to the previous results, we found higher values of damaged GSVs in FORESTORM than in our estimates based on the integration of FORWIND and country values of GSVs (Fig. 3f), except for windstorm Klaus. We recognize that FORWIND could miss some wind damage occurrences, for instance due to incomplete detection of wind disturbance from aerial photointerpretation or difficulties in mapping inaccessible areas by ground surveys. However, according to the institutions responsible for the data acquisition, the forest areas affected by the windstorm events considered in this validation exercise were exhaustively mapped. Therefore, possible residual omissions are expected to only marginally affect our results. We, therefore, argue that a possible source of error may be associated with the FORESTORM database. Estimates of forest damage from FORESTORM originate from different sources and are collected by multiple actors. Hence, the loss figures should be viewed in light of their potential biases, including a possible overestimation of the true impacts.
For demonstration purposes, we show a series of possible applications of the FORWIND database. We recognize that the examples described in the following sections are an oversimplification of the relationships observed in nature and of the biomechanical processes that may cause wind disturbances or that can be triggered by wind disturbances. More sophisticated approaches could be employed to better explore and predict the forest response functions to wind disturbances. For example, multiple variables, susceptibility factors and drivers (e.g. tree species, tree dimension, management regimes, planting patterns, soil depth and snow cover) contribute concurrently to modulate the forest response to wind disturbances (Hart et al., 2019; Klaus et al., 2011; Mitchell, 2013), and their contribution should be analysed in a multidimensional space (e.g. Sect. 5.1 and 5.2). Therefore, the approaches described here should not be considered a reference methodology but only as informative applications for exploring the usefulness of the FORWIND database.
5.1 Scaling relations of severity of wind disturbances
The exploration of the relations between forest dynamics and scale can reveal important information on ecosystem spatial organization by addressing preservation of information integrity in upscaling and downscaling procedures of land surface parameterization for ecological modelling applications (Forzieri and Catani, 2011). Here, we explore – in a simplified approach – the scaling relations of the degree of damage of wind disturbances collected in FORWIND. To achieve this we estimated, for each record, the cover fractions of different plant functional types (PFTs) including broadleaf deciduous (BrDe), broadleaf evergreen (BrEv), needleleaf deciduous (NeDe) and needleleaf evergreen (NeEv). Cover fractions were retrieved from the annual land cover maps of the European Space Agency's Climate Change Initiative (ESA-CCI, https://www.esa-landcover-cci.org/, last access: 20 December 2019). The degree of damage of each record was then spatially averaged over the sampled interquartile range of affected areas (bin size of 0.25 ha). The spatial averages were computed separately for each PFT, utilizing their cover fractions as weights. Quadratic polynomial functions were finally used to fit the observations and retrieve the relationship between the degree of damage and affected area for the considered PFTs.
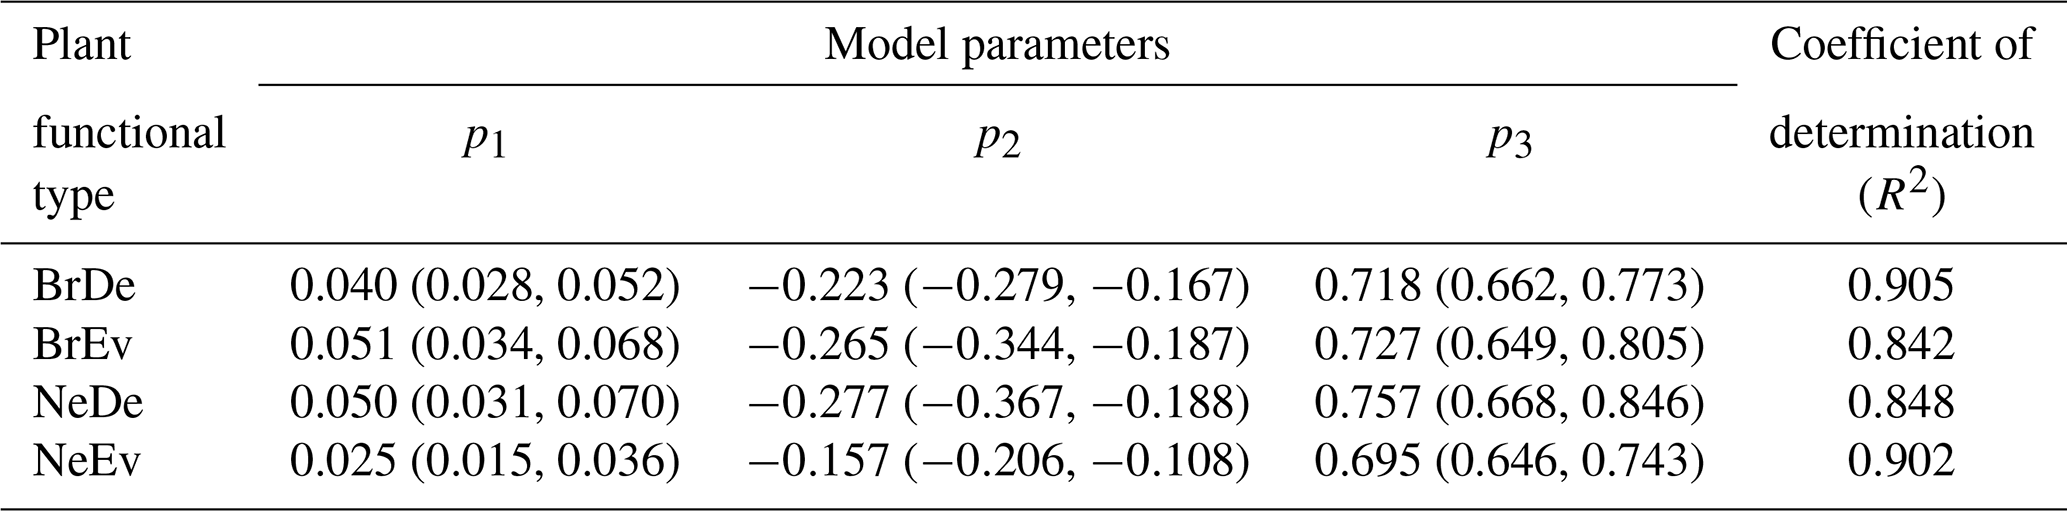
Results show that all considered PFTs generally have a higher degree of damage for wind disturbances with small spatial extent (Fig. 4a). This may reflect a better delineation of small affected areas when the damage is typically higher and homogeneous. Furthermore, the declining scaling relations suggest potential spatially varying dampening effects of wind severity due to landscape heterogeneity over large areas compared to more homogeneous patterns in small forest patches. Model fitting shows reasonably good performances, with R2 ranging between 0.84 and 0.90 across the PFTs (Table 6). Compared to the other PFTs, NeEv generally has a higher degree of damage that is related to the affected area by a quasi-monotonic pattern. The relationships found for the other PFTs show a stronger link between the degree of damage and affected area compared to NeEv, particularly over the range with larger samples (affected areas < 2 ha, Fig. 4b), as visualized by the steeper slopes of the fitting functions. For BrDe, BrEv and NeDe a prominent parabolic pattern emerges distinctly driven by records with a large spatial extent and a relatively high degree of damage.
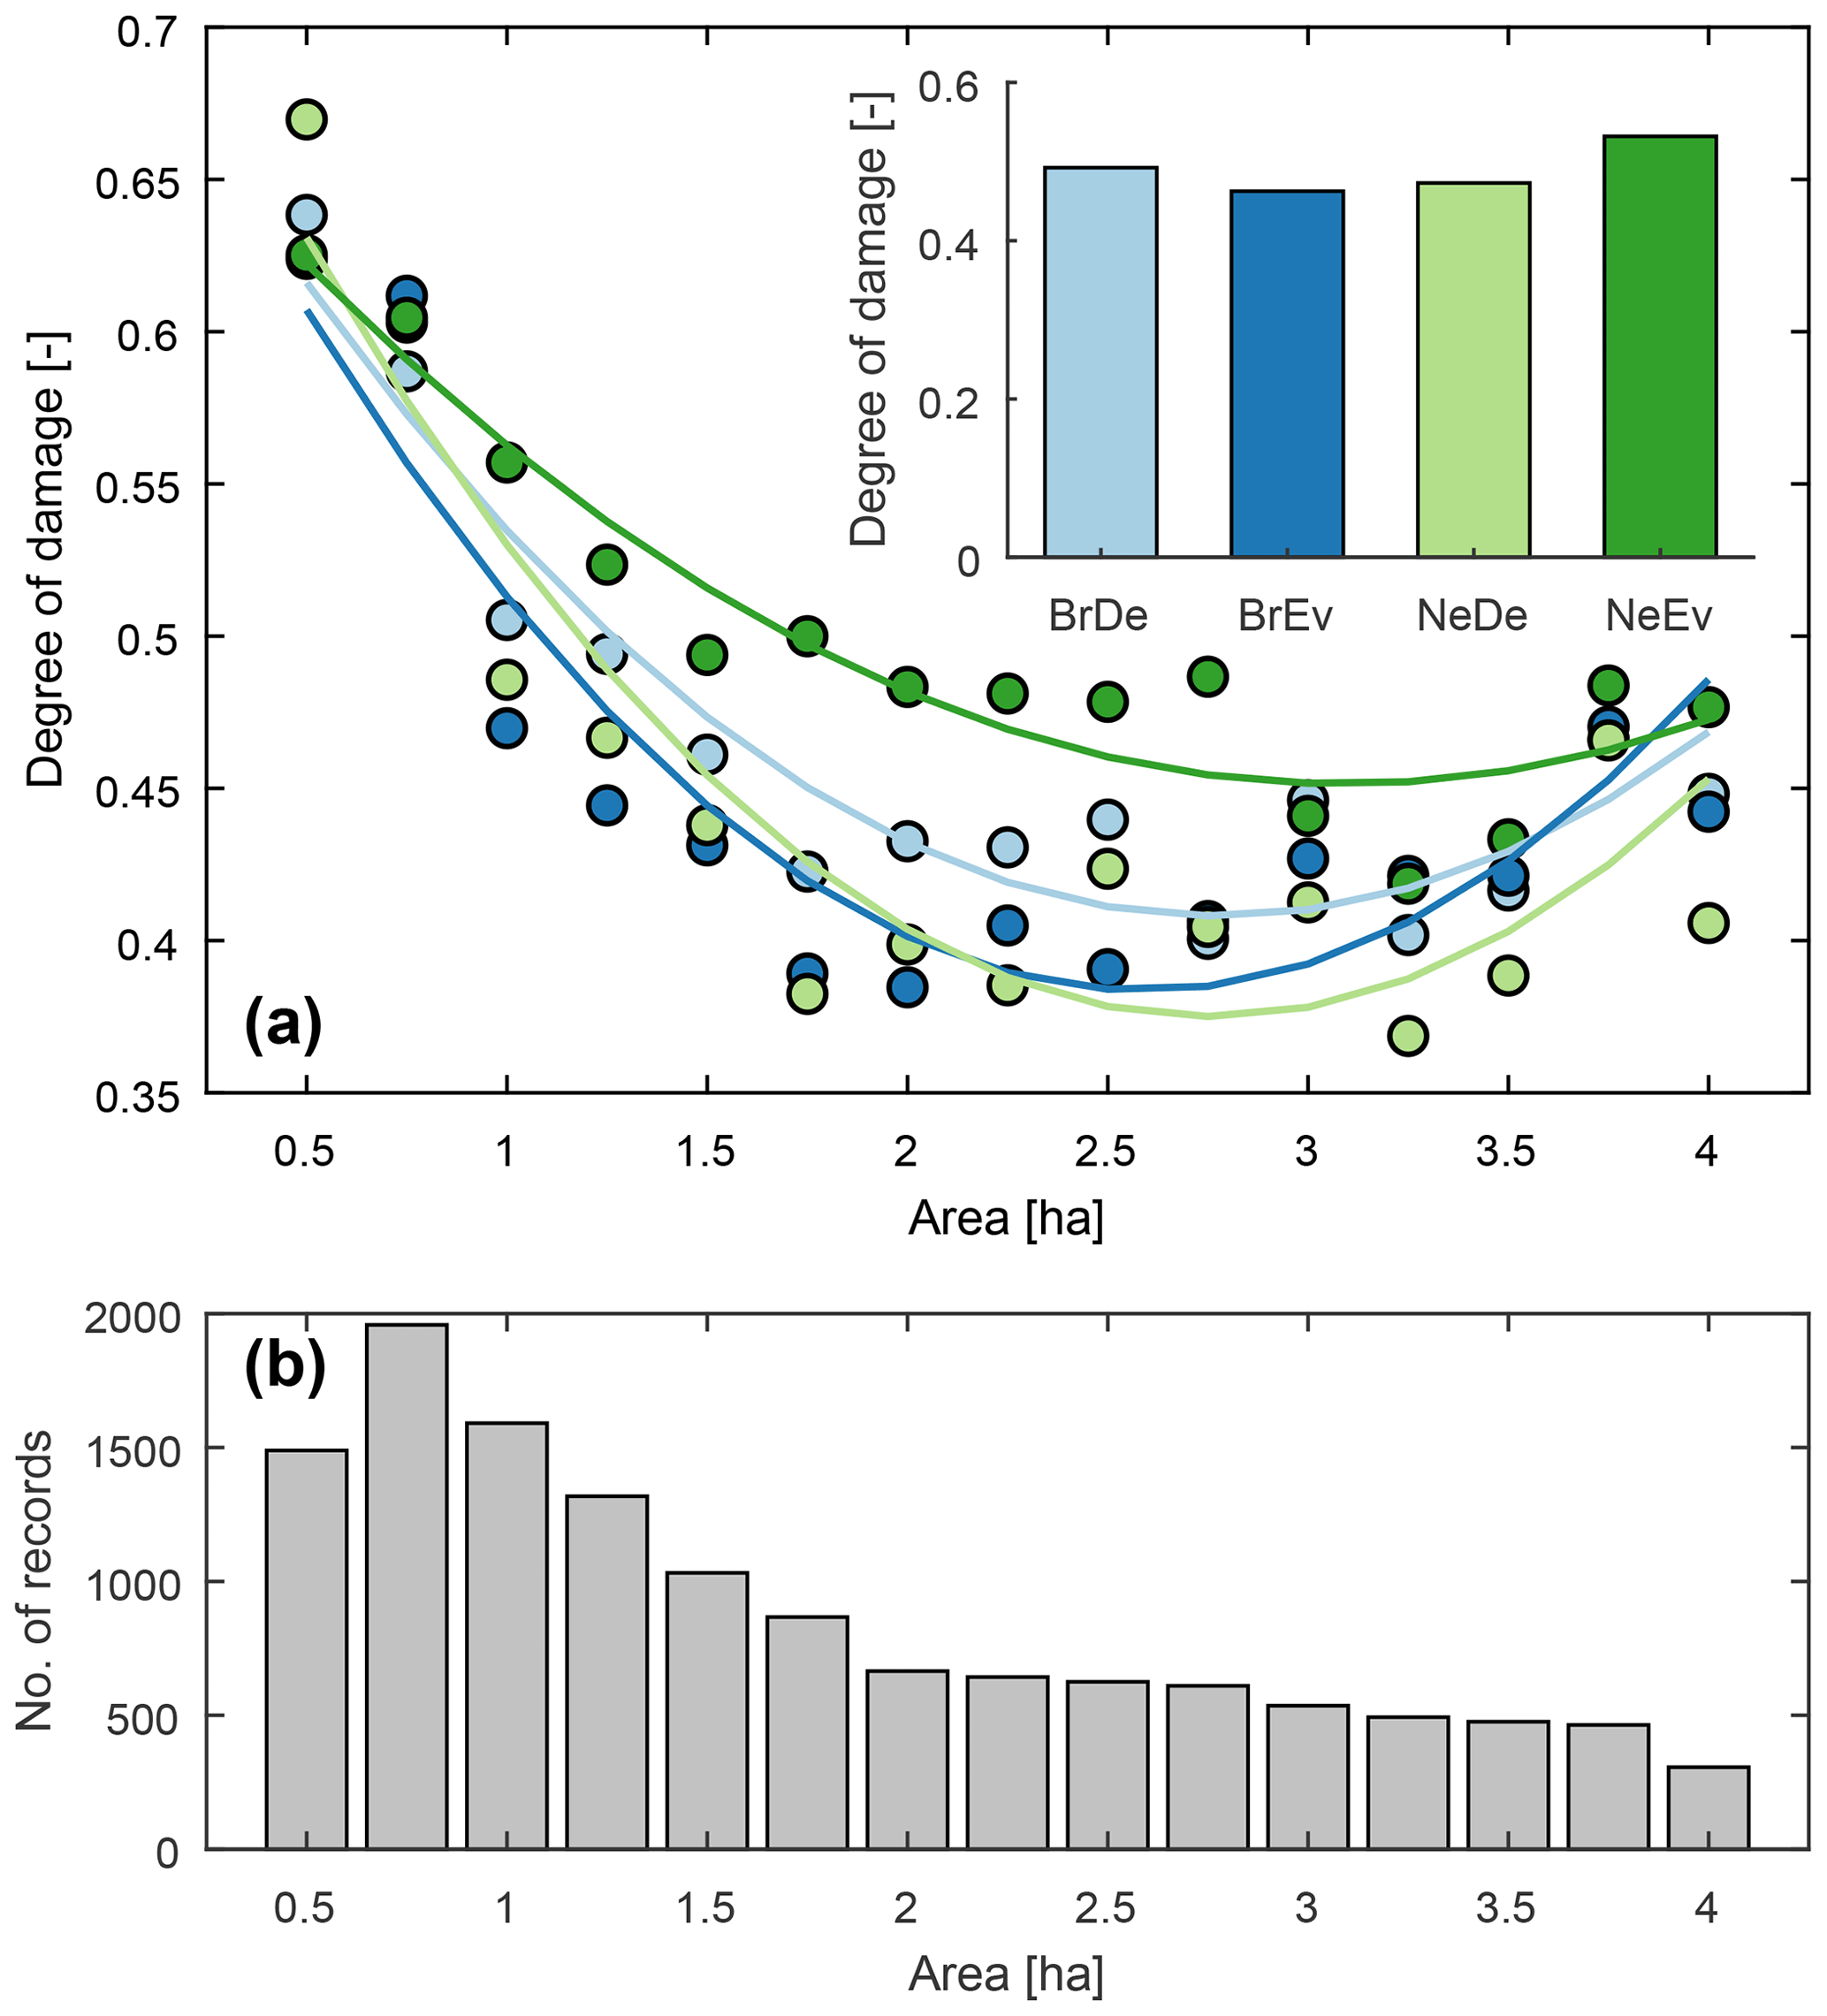
Figure 4Scaling relations of the degree of damage. (a) Relation between the area affected by wind disturbance (on the x axis) and degree of damage (on the y axis) as derived from the FORWIND database for different PFTs, including broadleaf deciduous (BrDe), broadleaf evergreen (BrEv), needleleaf deciduous (NeDe) and needleleaf evergreen (NeEv). PFT-specific averaged values, visualized in circles of different colour, were derived using bins that spanned the sampled range and using their cover fractions as weights. The fitted quadratic polynomial functions are shown by a continuous line, while their parameters and performances are reported in Table 5. The inset box shows the average degree of damage computed separately for each PFT using the whole set of records. (b) Frequency distribution of the samples (on the y axis) over the gradient of area affected by wind disturbance (on the x axis).
Table 6Parameters and performance of fitting regression models expressing the degree of damage as a function of the area affected. The relationship between the degree of damage (y) and the area affected by wind disturbance (x) is expressed by the following general quadratic polynomial function: , where p1, p2 and p3 are the coefficients of the equation. Coefficients are listed in the table with their 95 % confidence interval in brackets. Model performance is quantified in terms of coefficient of determination (R2). Models and the corresponding parameters and performance are evaluated separately for broadleaf deciduous (BrDe), broadleaf evergreen (BrEv), needleleaf deciduous (NeDe) and needleleaf evergreen (NeEv) data.
5.2 Forest vulnerability to wind disturbances
The vulnerability of forests to natural disturbances is a key determinant of risk and reflects the propensity of a forest to be adversely affected when exposed to hazardous events (IPCC, 2014). Vulnerability is largely controlled by local environmental conditions, such as climate and forest characteristics, which regulate the sensitivity of ecological processes to disturbance agents (Lindenmayer et al., 2011; Seidl et al., 2016; Turner, 2010). Here, we employ FORWIND records to quantify the forest vulnerability as a function of the fraction of evergreen needleleaf forest and annual maximum wind speed. The fraction of NeEv was derived from the ESA-CCI product aggregated at 0.5∘ spatial resolution. Annual maximum wind speeds were computed from NCEP/NCAR Reanalysis 2 data (Saha et al., 2010) (NCEP2, https://www.esrl.noaa.gov/psd/data/gridded/data.ncep.reanalysis2.html, last access: 20 December 2019). Daily average wind data at 0.5∘ spatial resolution were acquired and the two horizontal components combined to derive the magnitude of the wind vector. For each cell, the fraction of NeEv and the annual maximum wind concomitant with a wind disturbance were then selected from the time series and used in our experiment as potential drivers of vulnerability (Fig. 5a and c). The values of fraction of NeEv and annual maximum wind speed (predictors) were linked with the corresponding FORWIND affected area (response variable) within each 0.5∘ cell. The high spatial variability of the considered metrics and the potential effects of additional environmental factors not considered in this exercise may potentially mask the functional relations between the response variable and predictors. In order to reduce such potential sources of noise, response variables and predictors were spatially averaged over the sampled range of the predictors (bin sizes of 10 % and 2 m s−1 for the fraction of NeEv and annual maximum wind speed, respectively).
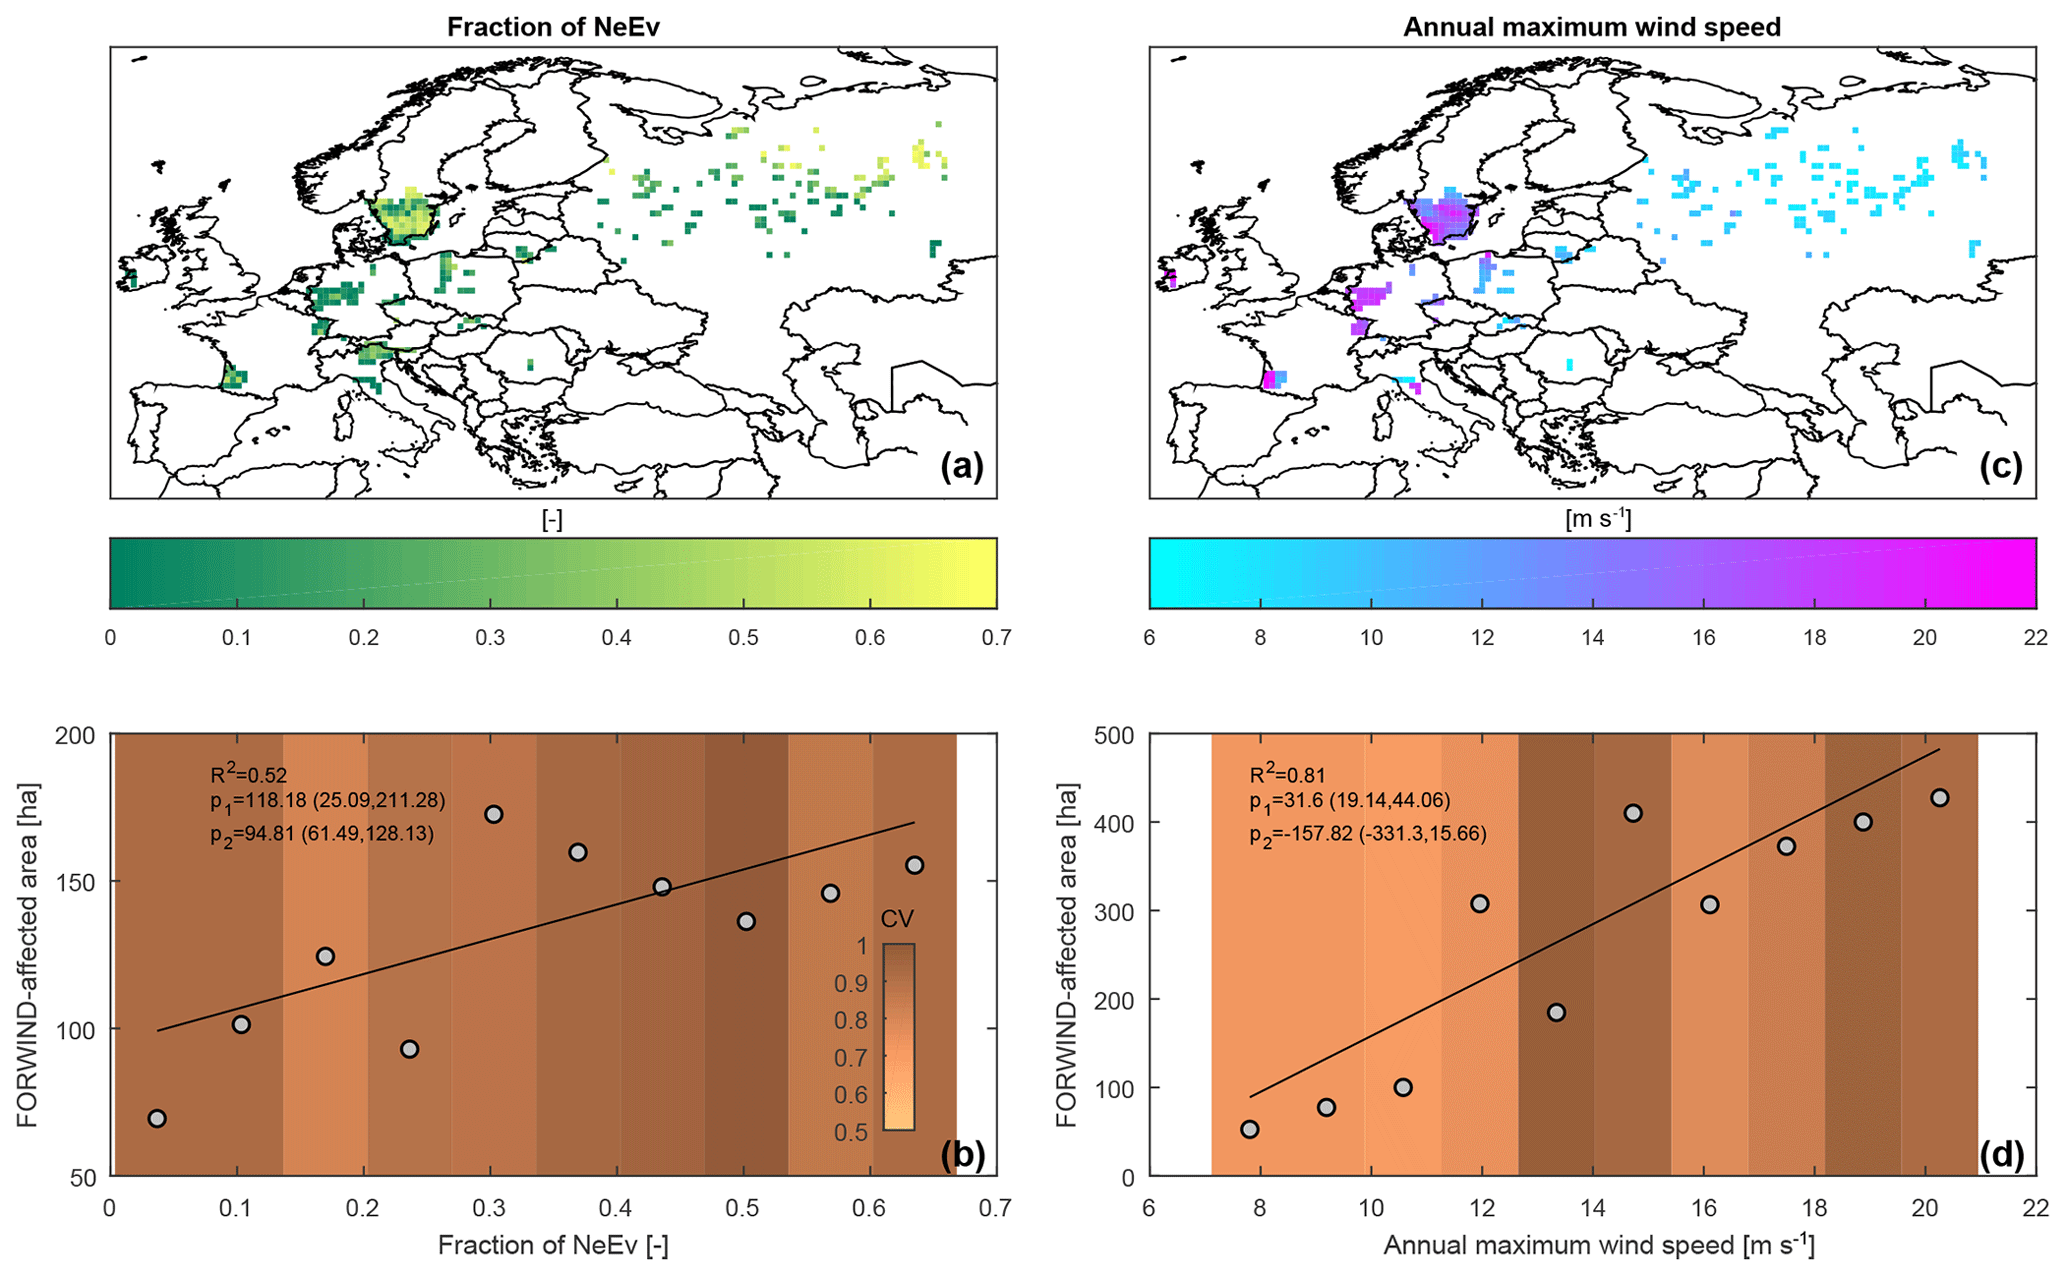
Figure 5Susceptibility factors and drivers of forest vulnerability to wind disturbances. (a) Spatial map of the fraction of evergreen needleleaf forest (NeEv). (b) Relation between the fraction of NeEv (on the x axis) and area affected by wind disturbances (on the y axis) as derived from the FORWIND database. Averaged values, shown in grey circles, were derived using bins that spanned the sampled range. Colour patterns reflect the coefficient of variation within each bin. The fitted linear regression model is shown with a black line, and the coefficient of determination (R2), slope (p1) and intercept (p2) are reported in the labels. The 95 % confidence interval for each of the coefficients is shown in brackets. (c) Spatial map of annual maximum wind speed; panel (d) is the same as (b) but for annual maximum wind speed in place of the fraction of NeEv. The grid cells in (a) and (c) where no wind disturbances occurred over the 2000–2018 period are masked out.
Wind disturbance areas manifest a substantial variability, as evident from the generally high values of the coefficient of variation. However, when data are spatially averaged at bin level, simple linear regression models show a reasonably good fit, with R2 values of 0.52 and 0.81 for the fraction of NeEv and annual maximum wind speed, respectively. Emerging patterns are largely consistent with expectations and previous studies. An increasing fraction of NeEv leads to an increase in wind disturbance area (growing rate of 12 ha of affected forest per 0.1 increase in NeEv fraction, Fig. 5b). The emerging relation is likely driven by the relatively high abundance of Picea abies in the sampled forest areas. This tree species is typically characterized by shallower rooting systems, often due to the type of soils on which it is planted (Mason and Valinger, 2013). Combined with the limited flexibility of its branches (Mayhead, 1973) and relatively low rupture strength of its trunk (Lavers, 1969) this makes Picea abies prone to uprooting and breakage by strong winds (Colin et al., 2009; Nicoll et al., 2006). A similar pattern emerges with respect to annual maximum wind speed (Seidl et al., 2011). Wind disturbance area tends to increase with rising wind speed (growing rate of 32 ha of affected forest per 1 m s−1 increase in wind speed, Fig. 5d). Maximum wind speeds are the primary determinant of wind disturbances. However, we point out that the coarse spatial and temporal resolution on NCEP2 data largely underestimate the speed of wind gusts and may completely miss peak winds originating from tornados. This is clearly evident from the range of values of annual maximum wind speed (6–22 m s−1), which are far lower than the wind speeds reported in country-scale inventories of forest disturbance (e.g. 42 m s−1 for windstorm Gudrun, FORESTORM) and in the Extreme Wind Storms (XWS) catalogue (Roberts et al., 2014) (http://www.europeanwindstorms.org/, last access: 20 December 2019) (e.g. 39 m s−1 for windstorm Gudrun, XWS).
5.3 Remote sensing detection and attribution of wind disturbances
Natural disturbances are accelerating globally, but their full impact is not quantified because we lack an adequate monitoring system. Remote sensing offers a means to quantify the frequency and extent of disturbances over landscape-to-global scales (McDowell et al., 2015). For instance, some pioneering studies have begun producing classification maps of various forest disturbance agents based on remote sensing data (Cohen et al., 2016; Hermosilla et al., 2015; Potapov et al., 2015; White et al., 2017). However, the attribution of forest change to windstorms remains challenging. Previous systematic monitoring has been performed only over limited areal extents and showed considerable uncertainty (Baumann et al., 2014; Schroeder et al., 2017) mostly due to the limited number of sampled wind-affected areas available for training and testing classification algorithms (Schroeder et al., 2017). In this respect, FORWIND data can be used to enhance our capability to detect and attribute forest damage due to windstorms from remote sensing data. Here, we tested different types of classification trees in combination with a Sentinel-2 imagery and the FORWIND database to automatically map wind disturbances that occurred following windstorm Vaia in October 2018 in the Dolomites in northern Italy (Pirotti et al., 2016). Google Earth Engine was used to create a single image composite from a stack of cloud-free pixels (11 and 28 images acquired before and after the windstorm event, respectively). The median was used as a reducer over the vector of pixel values derived from each image, after masking cloudy pixels using the cloud probability raster delivered from atmospheric, terrain and cirrus correction of the Sen2Cor processor (Louis et al., 2018). Further masking was applied to process only pixels covered by forest, using the 2018 estimated forest cover map from the Global Forest Change 2000–2018 dataset (Hansen et al., 2013). Binary classification, i.e. damaged versus non-damaged, was applied over a set of 1000 completely damaged areas retrieved from FORWIND and 1000 non-damaged areas. Half of these were used for training and validation, the other half for unbiased testing of the model performance. The feature vector used for predictors included reflectance values recorded by Sentinel-2 after radiometric and atmospheric correction (i.e. bottom of atmosphere) and a tasselled cap (TC) transform of reflectance bands to the brightness, greenness and wetness domain. The TC was added as it is reasonable that wind-affected areas will provide a higher degree of brightness and lower degree of greenness with respect to undisturbed areas (Baumann et al., 2014). Several machine learning algorithms were employed, including Random Forest, Extremely Randomized Forest, Gradient Boosting Machines, Deep Neural Networks and Stacked Ensemble, all trained and cross-validated based on K-fold validation with K=5 (Click et al., 2016).
Results, based on the best performing classification model (Random Forest), provided very promising accuracy, with an F1 score of 0.97, 27 false positives and 1 false negative over 915 pixels used for testing (507 undamaged and 408 damaged). Figure 6 shows mapped probability of wind occurrence – with blue to red, respectively, representing zero to one probability of a heavily hit area in the Veneto region. Based on visual comparison with ground data, the automatic classification is able to capture the spatial patterns of wind damage. It is worth noting that damage in forest–non-forest nexus is less accurate due to pixel mixing. Another point worth further investigation is that data may be defined as false positives from binary classification but could actually be true positives that were not mapped due to human error. On the other hand, false negatives may be true negatives in the sense that small patches of standing trees might be present in mapped areas due to the understandable minimum level of detail that must be adopted.
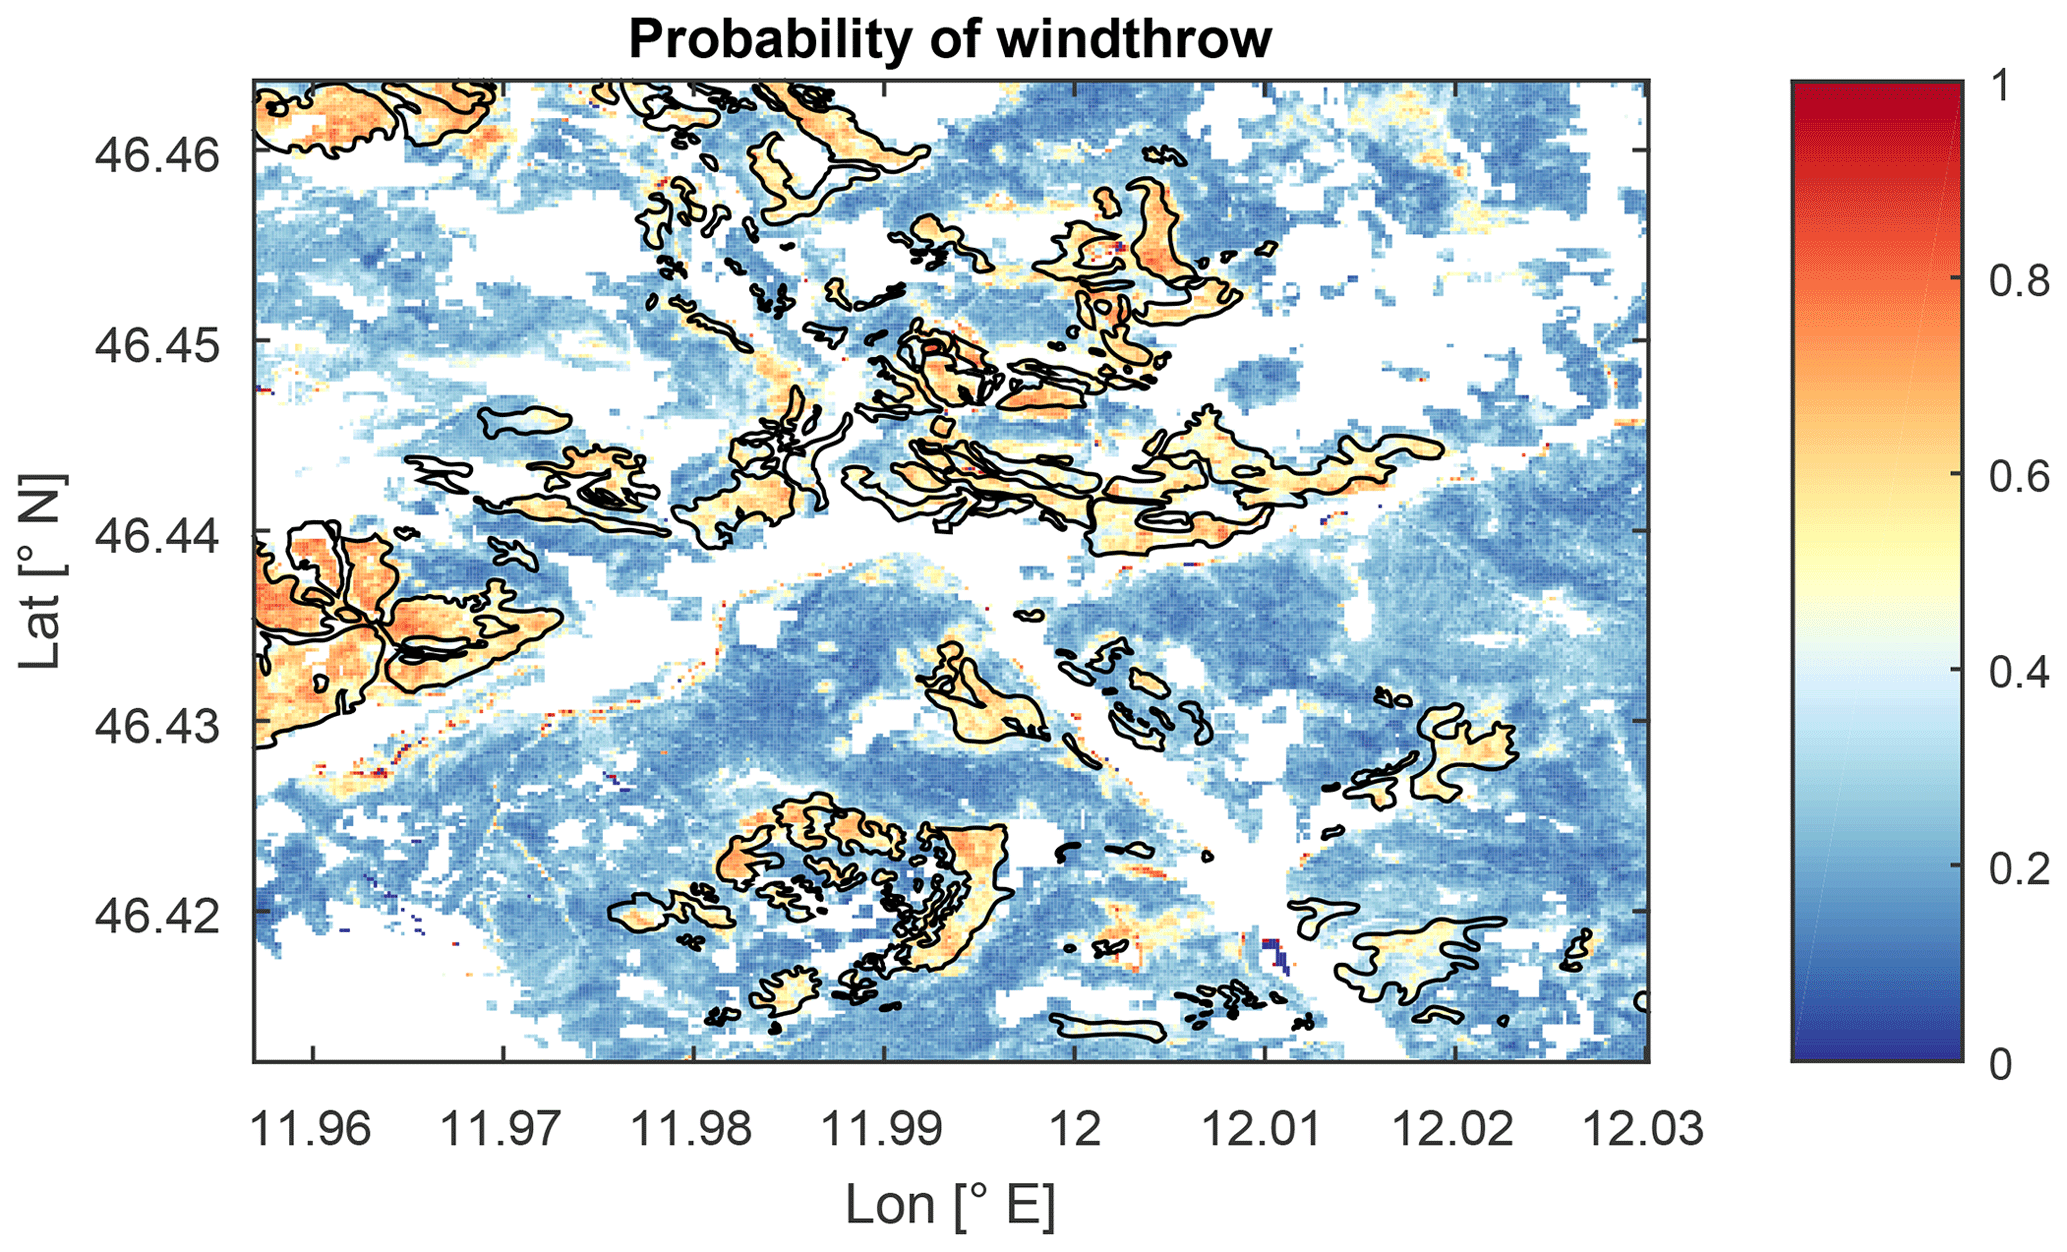
Figure 6Remote sensing classification of windthrows. Probability of windthrow obtained from random forest classification of Sentinel-2 reflectance bands and their tasselled cap transformation in a sampled area of the Dolomites in northern Italy affected by windstorm Vaia in October 2018. Black polygons show the actual wind disturbances.
5.4 Representation of wind disturbances in Land Surface Models
Land surface models (LSM) are key components of Earth System Models that are widely applied to support policy-relevant assessments on the impact of climate change on terrestrial ecosystems (Quéré et al., 2018). Recently, windstorm effects have been incorporated in LSMs (Chen et al., 2018). However, these models are hampered by the lack of harmonized spatially explicit information on windstorms required as input for robust model parameterization and large-scale representation of wind disturbance. In such contexts, the FORWIND database represents a valuable source of harmonized wind-affected forest areas for improving model calibration and/or evaluation. To illustrate such possible applications, FORWIND was used as an independent data source to evaluate the LSM ORCHIDEE (revision r4262), which simulates windthrow damage and was parameterized with observations prior to the FORWIND time frame.
ORCHIDEE r4262 was parameterized to the extent possible with observed parameter values. Nevertheless, tuning windthrow parameters remained necessary for gustiness, maximum damage rate (which is a parameter to account for the large simulations units, i.e. 2500 km2, in ORCHIDEE versus the small scale at which storm damage occurs) and the relaxation factor for the damage function (Rf in Eq. 12 in Chen et al., 2018, which is the parameter that converts the difference between the critical and actual wind speed into a damage rate). To achieve this, Swedish data from 1981 to 2000 (Nilsson et al., 2004), a period characterized by the absence of major storms in Sweden, was selected. Tuned parameters reproduced the annual storm damage in Sweden between 1981 to 2000 with a root-mean-square error of 1.3 Mm3 yr−1, as well as the observed damage from windstorm Gudrun in 2005 (75 Mm3 of reported damage versus 77 Mm3 of simulated damage) (Chen et al., 2018). Subsequently, the parameter values obtained by tuning ORCHIDEE against the damage rate in the absence of major storms in Sweden were used to simulate windthrow over the entire European domain starting in the year 2000.
The model simulated a total annual damage of 30 Mm3 yr−1 of wood timber over an area of 2 Mkm2 averaging 0.15 m3 ha−1 yr−1, which is in line with the reported value of 0.13 m3 ha−1 yr−1 between 1951 and 2000 (Schelhaas et al., 2003) and the projected 0.15 m3 ha−1 yr−1 between 2000 and 2020 (Seidl et al., 2014). According to ORCHIDEE, storms affected a total of 50 000 km2 between 2000 and 2015, where damage area was obtained by dividing the damaged timber volume (m3 m−2) by the sum of the damaged and remaining timber volume (m3 m−2) and multiplying by pixel surface area. At first sight these results strongly contrast with the 14 000 km2 of storm-damaged area archived in the FORWIND database between 2000 and 2015, but it should be noted that FORWIND was estimated to represent just 30 % of the European storms since 2000 (see Table 5). Extrapolating FORWIND to the European domain suggests that based on the observations, the area affected by windstorms could exceed 38 000 km2.
Differences in spatial and temporal definitions between ORCHIDEE and FORWIND were partly accounted for by extracting storm damage estimates from ORCHIDEE only when the storm was included in FORWIND. Following this, the ORCHIDEE model appears to overestimate the damage rate in years with small storms but failed to estimate the damage rate of windstorm Klaus in 2009 (Fig. 7). This suggests that the tuned relaxation factor for the damage function (Rf=6), which allows for individual tree damage at actual wind speeds below the critical wind speed, is too high. As a consequence ORCHIDEE simulates too much small-scale damage at wind speeds below the critical value, while the maximum damage rate in ORCHIDEE is too low. Furthermore, ORCHIDEE could only partially represent the effects of forest stand edges on the propagation of wind disturbance. Indeed, damage due to windstorm Klaus was particularly amplified due to the amount of damage arising at vulnerable forest stand edges and then propagating through the uniform Pinus radiata stands (Hart et al., 2019; Kamimura et al., 2015).
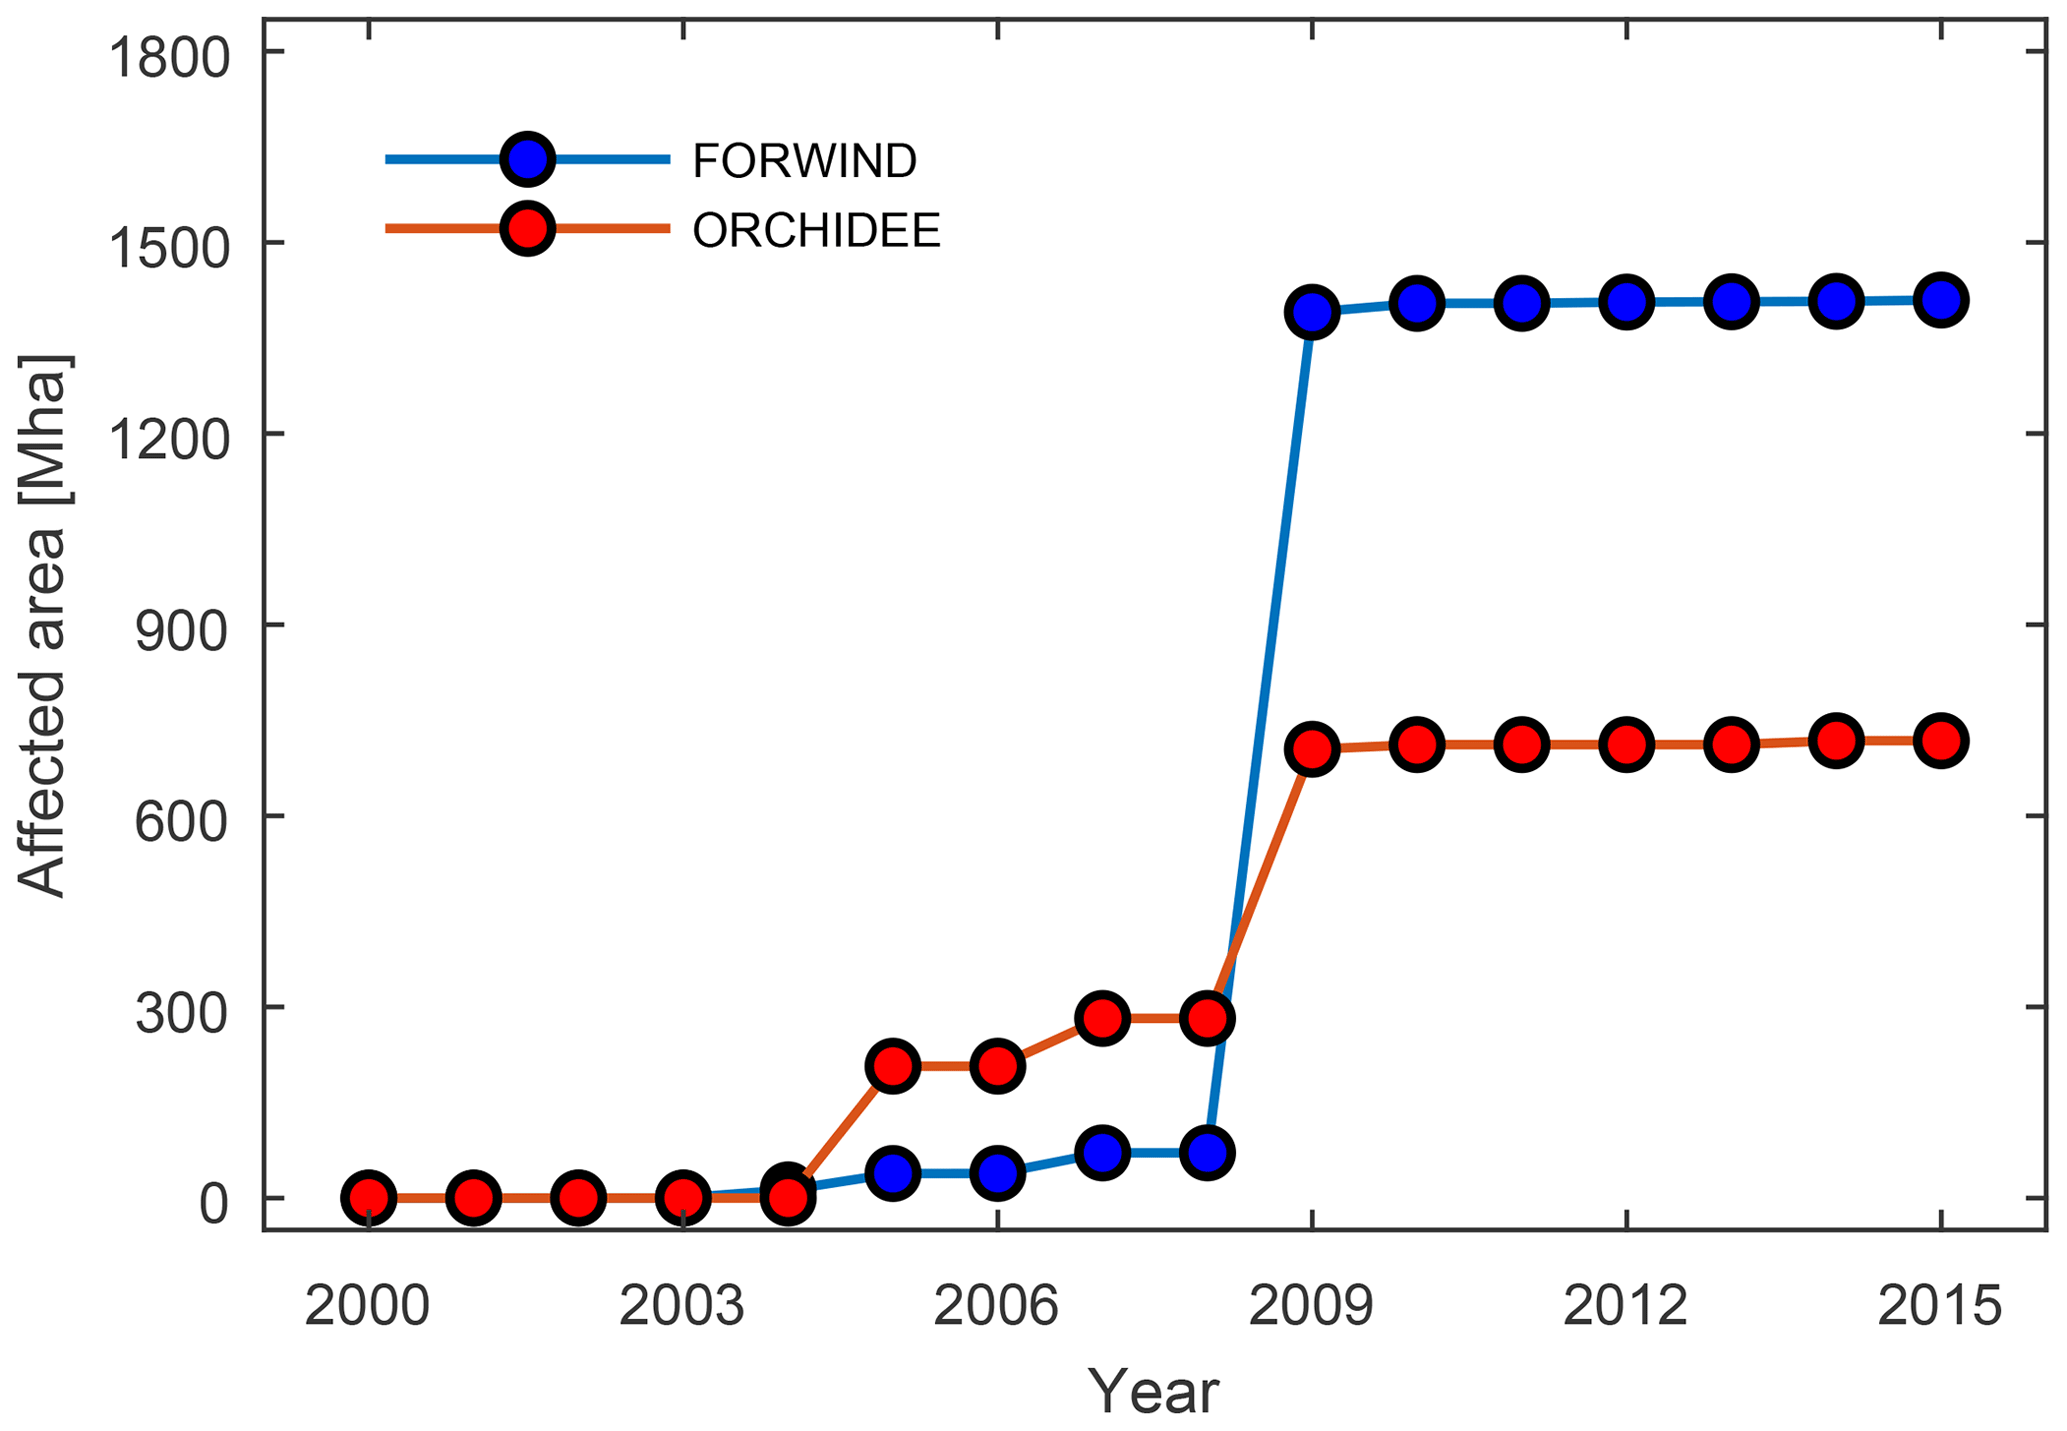
Figure 7Observed and simulated cumulated forest area damaged by windstorms between 2000 and 2015 over Europe. The observed damage area was extracted from the FORWIND dataset (shown in blue), whereas the simulated area comes from ORCHIDEE r4262 with Rf=6 (shown in red).
These results show that evaluating the capacity of land surface models to project storm damage hinges on our ability to precisely define the storm events recorded in the databases and our ability to use this information to estimate key model parameters such as the relaxation factor and the maximum damage rate.
5.5 Indirect effects of wind damage on slope instability
FORWIND may also be employed to improve the predictive performances of slope stability models that rely on water–soil interactions and soil mechanics. Vegetation affects terrain properties in a variety of way, including the modification of hydraulic conductivity, the regulation of evapotranspiration and the increase in soil strength by apparent root cohesion (Amundson et al., 2015; De Baets et al., 2008). This, in turn, may strongly condition terrain response to external forcing, such as intense rainfall and seismic shaking, leading to mass wasting in the form of shallow landslides and soil erosion (Moos et al., 2016; Ruiz-Colmenero et al., 2013).
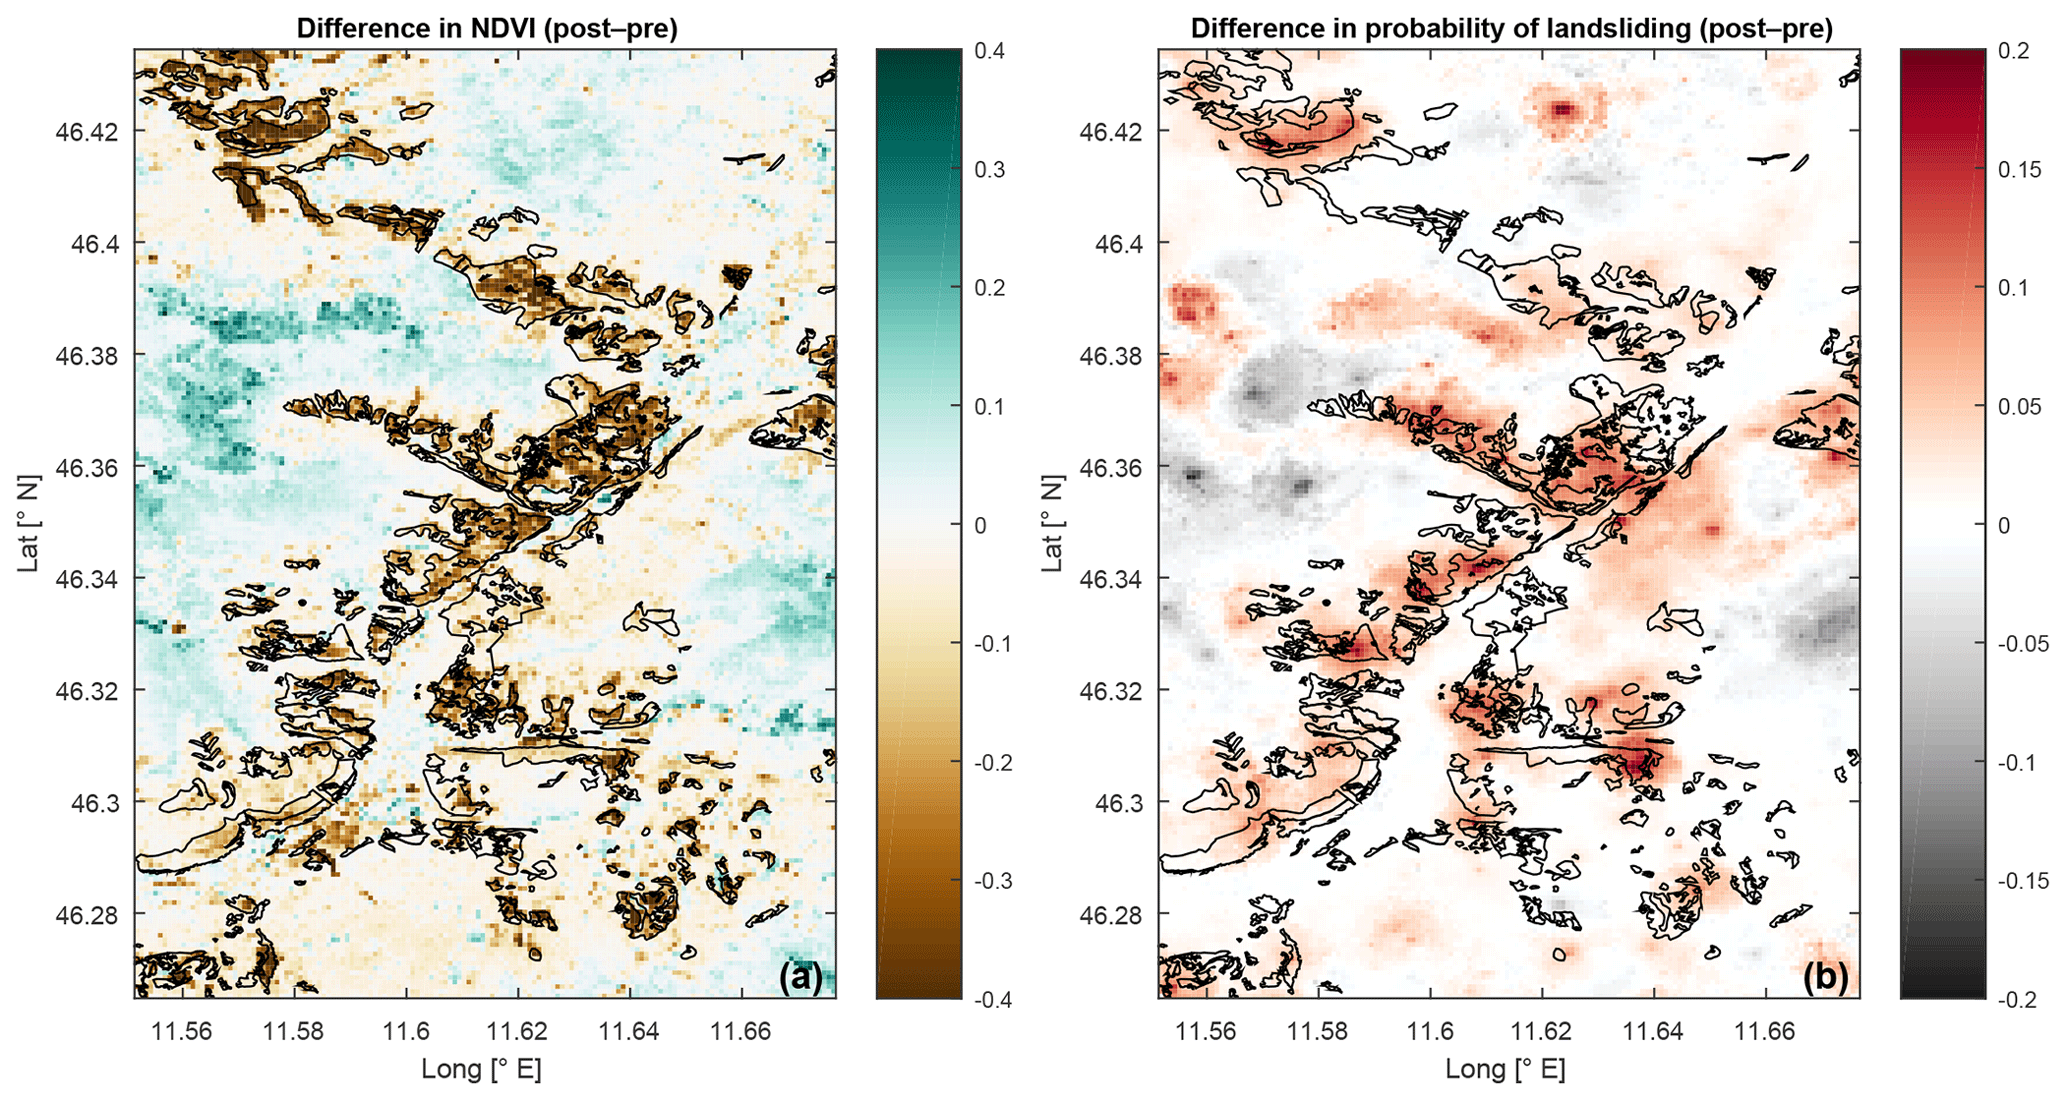
Figure 8Analysis of the indirect effects of wind damage on slope instability. Changes in NDVI and probability of landsliding following windstorm Vaia of October 2018 in the Dolomites in northern Italy, shown in (a) and (b), respectively. Black polygons show the actual wind disturbances.
We have tested the capability of FORWIND to provide data for assimilation in shallow landslide hazard models and for model validation by selecting the dataset relative to windstorm Vaia in October 2018 in the Dolomites in northern Italy and using it to model indirect effects of wind disturbance on slope stability. A multivariate machine learning model for shallow landslide susceptibility has been trained and applied on pre-storm terrain attributes to reveal relative probability of occurrence and then applied again to post-storm conditions to measure the effects of forest disturbance on the hazard. The terrain attributes considered in the analysis include elevation, slope angle, slope curvature variability, local rainfall patterns, geo-mechanical classes, potential soil saturation, contributing area and pre- and post-storm Normalized Difference Vegetation Index (NDVI) maps from Landsat 8 level-2 imagery. The dataset was trained by a Random Undersampling (RUS) Boosted Random Forest regressor (Catani et al., 2013) on a validated shallow-landslide dataset derived from the Italian National catalogue IFFI (Trigila et al., 2013). The training process highlights that NDVI, typically considered a good proxy of biomass density, is ranked second in terms of explained variance and seems to strongly condition landslide susceptibility in the Dolomites. The FORWIND database collects dated and graded information on wind damage to forests that directly correlates to marked changes in NDVI values, as can be observed in Fig. 8a. The effects of the damage recorded in the FORWIND dataset are measurable by comparing the levels of susceptibility before and after the occurrence of windstorm Vaia (Fig. 8b). As can be appreciated in the map, the red areas, which reveal a marked increase in the probability of landslides, match the FORWIND polygons very well and clearly indicate the usefulness of the wind damage geographical databases in slope hazard prediction and modelling. In Fig. 8b, we also note some omission and commission errors. They, however, can be easily explained by noting that vegetation stripping (or vegetation scantiness) is only one of the factors contributing to landslides. Therefore, wherever Vaia has damaged forests but slopes are very gentle, no shallow landslides can be generated. On the other hand, outside FORWIND polygons landslides may still develop, due to the prevailing action of other factors, such as unfavourable geological conditions or strong concentrated rainfall.
The use of FORWIND data in landslide modelling is not limited to the cross-validation of biomass volume changes but can also be extended to the usage of the dataset as an additional predictor in multi-variate statistics. We noted that the overlapping of FORWIND polygons and NDVI stress (brown) areas shows few exceptions. In such areas, the two factors seem to behave independently. In particular, locations where wind damage does not correspond to a NDVI change might reveal cases where the possible storm effects on soil stability are not captured by satellite-based variations in biomass content and must be accounted for by a different metric. That, in turn, opens the way to important future developments in the usage of wind-driven damage datasets in slope stability forecasting.
The data used in this study are freely available at (https://doi.org/10.6084/m9.figshare.9555008; Forzieri et al., 2019) and will be periodically updated with new and historical events. To this effect, the authors welcome further data contributions and commit to properly acknowledging them.
Modern and forthcoming Earth observation systems (McDowell et al., 2015), new generation of land surface models (Bonan and Doney, 2018), recent developments of cloud computing platforms (Gorelick et al., 2017) and machine learning approaches (Reichstein et al., 2019) are offering unprecedented opportunities to explore and predict ecosystem dynamics at an increasing spatio-temporal resolution and sophistication level. In light of such progress, it is of paramount importance to implement robust calibration and validation procedures based on reliable ground observations. In order to capture the variability of ecosystem response across wide environmental gradients, reference ground truth needs to be collected over large spatial scales. In this context, FORWIND represents an essential dataset to improve our capacity to detect, understand and predict wind disturbances and quantify their impact on forest ecosystems and the land–atmosphere system. The FORWIND database is the first Pan-European collection of spatially delineated forest areas affected by wind disturbances and includes all major events that occurred over the 2000–2018 period. Future research should aim to further populate FORWIND with missing damaging wind events.
GF designed the study. MP performed the data harmonization. MG assisted in data integration tasks. MM, CNik, MR, JT, DS, CNis, DJ, BG, FG, RC, AW, FP, FM, SI, WLS, KS, KZK, PSJ, MM, FS, LK, IH, MN, PW,and GC collected forest disturbance data. FP ran the classification models. FC ran the slope instability model. YYC and SL ran the ORCHIDEE model. GF analysed the data and wrote the manuscript with contributions from all co-authors.
The authors declare that they have no conflict of interest.
This research has been supported by the European Commission, Joint Research Centre (project FOREST@RISK).
This paper was edited by Scott Stevens and reviewed by Rupert Seidl and one anonymous referee.
Amundson, R., Heimsath, A., Owen, J., Yoo, K., and Dietrich, W. E.: Hillslope soils and vegetation, Geomorphology, 234, 122–132, https://doi.org/10.1016/j.geomorph.2014.12.031, 2015.
Baumann, M., Ozdogan, M., Wolter, P. T., Krylov, A., Vladimirova, N., and Radeloff, V. C.: Landsat remote sensing of forest windfall disturbance, Remote Sens. Environ., 143, 171–179, https://doi.org/10.1016/j.rse.2013.12.020, 2014.
Bender, M. A., Knutson, T. R., Tuleya, R. E., Sirutis, J. J., Vecchi, G. A., Garner, S. T., and Held, I. M.: Modeled Impact of Anthropogenic Warming on the Frequency of Intense Atlantic Hurricanes, Science, 327, 454–458, https://doi.org/10.1126/science.1180568, 2010.
Bonan, G. B. and Doney, S. C.: Climate, ecosystems, and planetary futures: The challenge to predict life in Earth system models, Science, 359, eaam8328, https://doi.org/10.1126/science.aam8328, 2018.
Catani, F., Lagomarsino, D., Segoni, S., and Tofani, V.: Landslide susceptibility estimation by random forests technique: sensitivity and scaling issues, Nat. Hazards Earth Syst. Sci., 13, 2815–2831, https://doi.org/10.5194/nhess-13-2815-2013, 2013.
Chen, Y.-Y., Gardiner, B., Pasztor, F., Blennow, K., Ryder, J., Valade, A., Naudts, K., Otto, J., McGrath, M. J., Planque, C., and Luyssaert, S.: Simulating damage for wind storms in the land surface model ORCHIDEE-CAN (revision 4262), Geosci. Model Dev., 11, 771–791, https://doi.org/10.5194/gmd-11-771-2018, 2018.
Click, C., Malohlava, M., Candel, A., Roark, H., and Parmar, V.: Gradient Boosted Models with H2O, H2O.ai, Inc., Mountain View, CA, USA, 2016.
Cohen, W. B., Yang, Z., Stehman, S. V., Schroeder, T. A., Bell, D. M., Masek, J. G., Huang, C., and Meigs, G. W.: Forest disturbance across the conterminous United States from 1985–2012: The emerging dominance of forest decline, Forest Ecol. Manage., 360, 242–252, https://doi.org/10.1016/j.foreco.2015.10.042, 2016.
Colin, F., Vinkler, I., Riou-Nivert, P., Renauld, J.-P., Hervé, J.-C., Bock, J., and Piton, B.: Facteurs de risque de chablis dans les peuplements forestiers: les leçons tirées des tempêtes de 1999, in: La forêt face aux tempêtes, edited by: Birot, Y., Landmann, G., and Bonhême, I., Editions Quae, INRA, Versailles, France, 177–228, 2009.
Curtis, P. G., Slay, C. M., Harris, N. L., Tyukavina, A., and Hansen, M. C.: Classifying drivers of global forest loss, Science, 361, 1108–1111, https://doi.org/10.1126/science.aau3445, 2018.
De Baets, S., Poesen, J., Reubens, B., Wemans, K., De Baerdemaeker, J., and Muys, B.: Root tensile strength and root distribution of typical Mediterranean plant species and their contribution to soil shear strength, Plant Soil, 305, 207–226, https://doi.org/10.1007/s11104-008-9553-0, 2008.
FAOSTAT: Forestry Production and Trade, available at: http://www.fao.org/faostat/en/#data/FO/visualize, last access: 24 October 2019.
Forest Europe: State of Europe's Forests 2015 Report, Forest Europe, available at: https://foresteurope.org/state-europes-forests-2015-report/ (last access: 23 November 2018), 2015.
Forzieri, G. and Catani, F.: Scale-dependent relations in land cover biophysical dynamics, Ecol. Model., 222, 3285–3290, https://doi.org/10.1016/j.ecolmodel.2011.06.010, 2011.
Forzieri, G., Pecchi, M., Girardello, M., Mauri, A., Klaus, M., Nikolov, C., Rüetschi, M., Gardiner, B., Tomaštík, J., Small, D., Nistor, C., Jonikavicius, D., Spinoni, J., Feyen, L., Giannetti, F., Comino, R., Wolynski, A., Pirotti, F., Maistrelli, F., Ionut, S., Lucas-Stephanie, W., Stefan, K., Zieba-Kulawik, K., Strejczek-Jazwinska, P., Mokroš, M., Stefan, F., Krejci, L., Haidu, I., Nilsson, M., Wezyk, P., Catani, F., Chen, Y.-Y., Luyssaert, S., Chirici, G., Cescatti, A., and Beck, P. S. A.: A spatially-explicit database of wind disturbances in European forests over the period 2000–2018, https://doi.org/10.6084/m9.figshare.9555008.v2, 2019.
Gardiner, B., Blennow, K., Carnus, J.-M., Fleischer, P., Ingemarson, F., Landmann, G., Lindner, M., Marzano, M., Nicoll, B., Orazio, C., Peyron, J.-L., Reviron, M.-P., Schelhaas, M.-J., Schuck, A., Spielmann, M., and Usbeck, T.: Destructive Storms in European Forests: Past and forthcoming Impacts, European Forest Institute, Joensuu, Finland, 2010.
Gorelick, N., Hancher, M., Dixon, M., Ilyushchenko, S., Thau, D., and Moore, R.: Google Earth Engine: Planetary-scale geospatial analysis for everyone, Remote Sens. Environ., 202, 18–27, https://doi.org/10.1016/j.rse.2017.06.031, 2017.
Gregow, H., Laaksonen, A., and Alper, M. E.: Increasing large scale windstorm damage in Western, Central and Northern European forests, 1951–2010, Scient. Rep., 7, 46397, https://doi.org/10.1038/srep46397, 2017.
Hansen, M. C., Potapov, P. V., Moore, R., Hancher, M., Turubanova, S. A., Tyukavina, A., Thau, D., Stehman, S. V., Goetz, S. J., Loveland, T. R., Kommareddy, A., Egorov, A., Chini, L., Justice, C. O., and Townshend, J. R. G.: High-Resolution Global Maps of 21st-Century Forest Cover Change, Science, 342, 850–853, https://doi.org/10.1126/science.1244693, 2013.
Hart, E., Sim, K., Kamimura, K., Meredieu, C., Guyon, D., and Gardiner, B.: Use of machine learning techniques to model wind damage to forests, Agr. Forest Meteorol., 265, 16–29, https://doi.org/10.1016/j.agrformet.2018.10.022, 2019.
Hermosilla, T., Wulder, M. A., White, J. C., Coops, N. C., and Hobart, G. W.: Regional detection, characterization, and attribution of annual forest change from 1984 to 2012 using Landsat-derived time-series metrics, Remote Sens. Environ., 170, 121–132, https://doi.org/10.1016/j.rse.2015.09.004, 2015.
IPCC: Climate Change 2014: Impacts, Adaptation, and Vulnerability, Part A: Global and Sectoral Aspects, in: Contribution of Working Group II to the Fifth Assessment Report of the Intergovernmental Panel on Climate Change, UK and New York, NY, USA, 2014.
Kamimura, K., Gardiner, B., Dupont, S., Guyon, D., and Meredieu, C.: Mechanistic and statistical approaches to predicting wind damage to individual maritime pine (Pinus pinaster) trees in forests, Can. J. Forest Res., 46, 88–100, https://doi.org/10.1139/cjfr-2015-0237, 2015.
Kempeneers, P., Sedano, F., Seebach, L., Strobl, P., and San-Miguel-Ayanz, J.: Data Fusion of Different Spatial Resolution Remote Sensing Images Applied to Forest-Type Mapping, IEEE T. Geosci. Remote Sens., 49, 4977–4986, https://doi.org/10.1109/TGRS.2011.2158548, 2011.
Klaus, M., Holsten, A., Hostert, P., and Kropp, J. P.: Integrated methodology to assess windthrow impacts on forest stands under climate change, Forest Ecol. Manage., 261, 1799–1810, https://doi.org/10.1016/j.foreco.2011.02.002, 2011.
Knutson, T. R., McBride, J. L., Chan, J., Emanuel, K., Holland, G., Landsea, C., Held, I., Kossin, J. P., Srivastava, A. K., and Sugi, M.: Tropical cyclones and climate change, Nat. Geosci., 3, 157–163, https://doi.org/10.1038/ngeo779, 2010.
Kurz, W. A., Dymond, C. C., Stinson, G., Rampley, G. J., Neilson, E. T., Carroll, A. L., Ebata, T., and Safranyik, L.: Mountain pine beetle and forest carbon feedback to climate change, Nature, 452, 987–990, https://doi.org/10.1038/nature06777, 2008.
Lavers, G. M. (Gwendoline M.: The strength properties of timbers, 2nd Edn., metric units, H.M.S.O., London, available at: http://capitadiscovery.co.uk/brighton-ac/items/131652 (last access: 18 December 2019), 1969.
Lindenmayer, D. B., Hobbs, R. J., Likens, G. E., Krebs, C. J., and Banks, S. C.: Newly discovered landscape traps produce regime shifts in wet forests, P. Natl. Acad. Sci. USA, 108, 15887–15891, https://doi.org/10.1073/pnas.1110245108, 2011.
Louis, J., Devignot, O., and Pessiot, L.: S2 MPC – L2A Product Definition Document, available at: http://step.esa.int/thirdparties/sen2cor/2.3.1/[L2A-PDD] S2-PDGS-MPC-L2A-PDD [14.2].pdf (last access: 5 February 2020), 2018.
Martínez-Alvarado, O., Gray, S. L., Catto, J. L., and Clark, P. A.: Sting jets in intense winter North-Atlantic windstorms, Environ. Res. Lett., 7, 024014, https://doi.org/10.1088/1748-9326/7/2/024014, 2012.
Masek, J. G., Hayes, D. J., Joseph Hughes, M., Healey, S. P., and Turner, D. P.: The role of remote sensing in process-scaling studies of managed forest ecosystems, Forest Ecol. Manage., 355, 109–123, https://doi.org/10.1016/j.foreco.2015.05.032, 2015.
Mason, B. and Valinger, E.: Managing forests to reduce storm damage, in: Living with Storm Damage to Forests: What Science Can Tell Us, edited by: Gardiner, B., Schuck, A., Schelhaas, M.-J., Orazio, C., Blennow, K., and Nicoll, B., European Forest Institute, Joensuu, Finland, 89–98, 2013.
Mayhead, G. J.: Some drag coefficients for british forest trees derived from wind tunnel studies, Agricult. Meteorol., 12, 123–130, https://doi.org/10.1016/0002-1571(73)90013-7, 1973.
McDowell, N. G., Coops, N. C., Beck, P. S. A., Chambers, J. Q., Gangodagamage, C., Hicke, J. A., Huang, C., Kennedy, R., Krofcheck, D. J., Litvak, M., Meddens, A. J. H., Muss, J., Negrón-Juarez, R., Peng, C., Schwantes, A. M., Swenson, J. J., Vernon, L. J., Williams, A. P., Xu, C., Zhao, M., Running, S. W., and Allen, C. D.: Global satellite monitoring of climate-induced vegetation disturbances, Trends Plant Sci., 20, 114–123, https://doi.org/10.1016/j.tplants.2014.10.008, 2015.
Mildrexler, D. J., Zhao, M., and Running, S. W.: Testing a MODIS Global Disturbance Index across North America, Remote Sens. Environ., 113, 2103–2117, https://doi.org/10.1016/j.rse.2009.05.016, 2009.
Mitchell, S. J.: Wind as a natural disturbance agent in forests: a synthesis, Forestry, 86, 147–157, https://doi.org/10.1093/forestry/cps058, 2013.
Moos, C., Bebi, P., Graf, F., Mattli, J., Rickli, C., and Schwarz, M.: How does forest structure affect root reinforcement and susceptibility to shallow landslides?, Earth Surf. Proc. Land., 41, 951–960, https://doi.org/10.1002/esp.3887, 2016.
Nicoll, B. C., Gardiner, B. A., Rayner, B., and Peace, A. J.: Anchorage of coniferous trees in relation to species, soil type, and rooting depth, Can. J. Forest Res., 36, 1871–1883, https://doi.org/10.1139/x06-072, 2006.
Nilsson, C., Stjernquist, I., Bärring, L., Schlyter, P., Jönsson, A. M., and Samuelsson, H.: Recorded storm damage in Swedish forests 1901–2000, Forest Ecol. Manage., 199, 165–173, https://doi.org/10.1016/j.foreco.2004.07.031, 2004.
Pekkarinen, A., Reithmaier, L., and Strobl, P.: Pan-European forest/non-forest mapping with Landsat ETM+ and CORINE Land Cover 2000 data, ISPRS J. Photogram. Remote Sens., 64, 171–183, https://doi.org/10.1016/j.isprsjprs.2008.09.004, 2009.
Phiri, D. and Morgenroth, J.: Developments in Landsat Land Cover Classification Methods: A Review, Remote Sensing, 9, 967, https://doi.org/10.3390/rs9090967, 2017.
Pirotti, F., Sunar, F., and Piragnolo, M.: Benchmark Of Machine Learning Methods For Classification Of A SENTINEL-2 Image, in: ISPRS – International Archives of the Photogrammetry, Remote Sensing and Spatial Information Sciences, Vol. XLI-B7, 335–340, Copernicus GmbH, Göttingen, 2016.
Potapov, P. V., Turubanova, S. A., Tyukavina, A., Krylov, A. M., McCarty, J. L., Radeloff, V. C., and Hansen, M. C.: Eastern Europe's forest cover dynamics from 1985 to 2012 quantified from the full Landsat archive, Remote Sens. Environ., 159, 28–43, https://doi.org/10.1016/j.rse.2014.11.027, 2015.
Quéré, C. L., Andrew, R. M., Friedlingstein, P., Sitch, S., Hauck, J., Pongratz, J., Pickers, P. A., Korsbakken, J. I., Peters, G. P., Canadell, J. G., Arneth, A., Arora, V. K., Barbero, L., Bastos, A., Bopp, L., Chevallier, F., Chini, L. P., Ciais, P., Doney, S. C., Gkritzalis, T., Goll, D. S., Harris, I., Haverd, V., Hoffman, F. M., Hoppema, M., Houghton, R. A., Hurtt, G., Ilyina, T., Jain, A. K., Johannessen, T., Jones, C. D., Kato, E., Keeling, R. F., Goldewijk, K. K., Landschützer, P., Lefèvre, N., Lienert, S., Liu, Z., Lombardozzi, D., Metzl, N., Munro, D. R., Nabel, J. E. M. S., Nakaoka, S., Neill, C., Olsen, A., Ono, T., Patra, P., Peregon, A., Peters, W., Peylin, P., Pfeil, B., Pierrot, D., Poulter, B., Rehder, G., Resplandy, L., Robertson, E., Rocher, M., Rödenbeck, C., Schuster, U., Schwinger, J., Séférian, R., Skjelvan, I., Steinhoff, T., Sutton, A., Tans, P. P., Tian, H., Tilbrook, B., Tubiello, F. N., Laan-Luijkx, I. T. van der, Werf, G. R. van der, Viovy, N., Walker, A. P., Wiltshire, A. J., Wright, R., Zaehle, S., and Zheng, B.: Global Carbon Budget 2018, Earth Syst. Sci. Data, 10, 2141–2194, https://doi.org/10.5194/essd-10-2141-2018, 2018.
Reichstein, M., Camps-Valls, G., Stevens, B., Jung, M., Denzler, J., Carvalhais, N., and Prabhat: Deep learning and process understanding for data-driven Earth system science, Nature, 566, 195–204, https://doi.org/10.1038/s41586-019-0912-1, 2019.
Roberts, J. F., Champion, A. J., Dawkins, L. C., Hodges, K. I., Shaffrey, L. C., Stephenson, D. B., Stringer, M. A., Thornton, H. E., and Youngman, B. D.: The XWS open access catalogue of extreme European windstorms from 1979 to 2012, Nat. Hazards Earth Syst. Sci., 14, 2487–2501, https://doi.org/10.5194/nhess-14-2487-2014, 2014.
Ruiz-Colmenero, M., Bienes, R., Eldridge, D. J., and Marques, M. J.: Vegetation cover reduces erosion and enhances soil organic carbon in a vineyard in the central Spain, Catena, 104, 153–160, https://doi.org/10.1016/j.catena.2012.11.007, 2013.
Saha, S., Moorthi, S., Pan, H.-L., Wu, X., Wang, J., Nadiga, S., Tripp, P., Kistler, R., Woollen, J., Behringer, D., Liu, H., Stokes, D., Grumbine, R., Gayno, G., Wang, J., Hou, Y.-T., Chuang, H.-Y., Juang, H.-M. H., Sela, J., Iredell, M., Treadon, R., Kleist, D., Van Delst, P., Keyser, D., Derber, J., Ek, M., Meng, J., Wei, H., Yang, R., Lord, S., Van Den Dool, H., Kumar, A., Wang, W., Long, C., Chelliah, M., Xue, Y., Huang, B., Schemm, J.-K., Ebisuzaki, W., Lin, R., Xie, P., Chen, M., Zhou, S., Higgins, W., Zou, C.-Z., Liu, Q., Chen, Y., Han, Y., Cucurull, L., Reynolds, R. W., Rutledge, G., and Goldberg, M.: The NCEP Climate Forecast System Reanalysis, B. Am. Meteorol. Soc., 91, 1015–1057, https://doi.org/10.1175/2010BAMS3001.1, 2010.
Santoro, M., Cartus, O., Mermoz, S., Bouvet, A., Le Toan, T., Carvalhais, N., Rozendaal, D., Herold, M., Avitabile, V., Quegan, S., Carreiras, J., Rauste, Y., Balzter, H., Schmullius, C., and Seifert, F. M.: A detailed portrait of the forest aboveground biomass pool for the year 2010 obtained from multiple remote sensing observations, in: EGU General Assembly Conference Abstracts, vol. 20, p. 18932, available at: http://adsabs.harvard.edu/abs/2018EGUGA..2018932S (last access: 2 May 2019), 2018.
Schelhaas, M.-J., Nabuurs, G.-J., and Schuck, A.: Natural disturbances in the European forests in the 19th and 20th centuries, Global Change Biol., 9, 1620–1633, https://doi.org/10.1046/j.1365-2486.2003.00684.x, 2003.
Schroeder, T. A., Schleeweis, K. G., Moisen, G. G., Toney, C., Cohen, W. B., Freeman, E. A., Yang, Z., and Huang, C.: Testing a Landsat-based approach for mapping disturbance causality in U.S. forests, Remote Sens. Environ., 195, 230–243, https://doi.org/10.1016/j.rse.2017.03.033, 2017.
Seidl, R., Schelhaas, M.-J., and Lexer, M. J.: Unraveling the drivers of intensifying forest disturbance regimes in Europe, Global Change Biol., 17, 2842–2852, https://doi.org/10.1111/j.1365-2486.2011.02452.x, 2011.
Seidl, R., Schelhaas, M.-J., Rammer, W., and Verkerk, P. J.: Increasing forest disturbances in Europe and their impact on carbon storage, Nat. Clim. Change, 4, 806–810, https://doi.org/10.1038/nclimate2318, 2014.
Seidl, R., Müller, J., Hothorn, T., Bässler, C., Heurich, M., and Kautz, M.: Small beetle, large-scale drivers: how regional and landscape factors affect outbreaks of the European spruce bark beetle, J. Appl. Ecol., 53, 530–540, https://doi.org/10.1111/1365-2664.12540, 2016.
Seidl, R., Thom, D., Kautz, M., Martin-Benito, D., Peltoniemi, M., Vacchiano, G., Wild, J., Ascoli, D., Petr, M., Honkaniemi, J., Lexer, M. J., Trotsiuk, V., Mairota, P., Svoboda, M., Fabrika, M., Nagel, T. A., and Reyer, C. P. O.: Forest disturbances under climate change, Nat. Clim. Change, 7, 395–402, https://doi.org/10.1038/nclimate3303, 2017.
Shikhov, A. and Chernokulsky, A.: A satellite-derived climatology of unreported tornadoes in forested regions of northeast Europe, Remote Sens. Environ., 204, 553–567, https://doi.org/10.1016/j.rse.2017.10.002, 2018.
Simard, M., Pinto, N., Fisher, J. B., and Baccini, A.: Mapping forest canopy height globally with spaceborne lidar, J. Geophys. Res.-Biogeo., 116, G04021, https://doi.org/10.1029/2011JG001708, 2011.
Stadelmann, G., Bugmann, H., Meier, F., Wermelinger, B., and Bigler, C.: Effects of salvage logging and sanitation felling on bark beetle (Ips typographus L.) infestations, Forest Ecol. Manage., 305, 273–281, https://doi.org/10.1016/j.foreco.2013.06.003, 2013.
Trigila, A., Frattini, P., Casagli, N., Catani, F., Crosta, G., Esposito, C., Iadanza, C., Lagomarsino, D., Mugnozza, G. S., Segoni, S., Spizzichino, D., Tofani, V., and Lari, S.: Landslide Susceptibility Mapping at National Scale: The Italian Case Study, in: Landslide Science and Practice: Volume 1: Landslide Inventory and Susceptibility and Hazard Zoning, edited by: Margottini, C., Canuti, P., and Sassa, K., Springer, Berlin, Heidelberg, 287–295, 2013.
Turner, M. G.: Disturbance and landscape dynamics in a changing world, Ecology, 91, 2833–2849, https://doi.org/10.1890/10-0097.1, 2010.
White, J. C., Wulder, M. A., Hermosilla, T., Coops, N. C., and Hobart, G. W.: A nationwide annual characterization of 25 years of forest disturbance and recovery for Canada using Landsat time series, Remote Sens. Environ., 194, 303–321, https://doi.org/10.1016/j.rse.2017.03.035, 2017.
Yamanoi, K., Mizoguchi, Y., and Utsugi, H.: Effects of a windthrow disturbance on the carbon balance of a broadleaf deciduous forest in Hokkaido, Japan, Biogeosciences, 12, 6837–6851, https://doi.org/10.5194/bg-12-6837-2015, 2015.
Ziemblińska, K., Urbaniak, M., Merbold, L., Black, T. A., Jagodziński, A. M., Herbst, M., Qiu, C., and Olejnik, J.: The carbon balance of a Scots pine forest following severe windthrow: Comparison of reforestation techniques, Agr. Forest Meteorol., 260–261, 216–228, https://doi.org/10.1016/j.agrformet.2018.06.012, 2018.