the Creative Commons Attribution 4.0 License.
the Creative Commons Attribution 4.0 License.
 | 28 Feb 2020
Global certified-reference-material- or reference-material-scaled nutrient gridded dataset GND13
Michio Aoyama
A global nutrient gridded dataset that might be the basis for studies of more accurate spatial distributions of nutrients in the global ocean was created and named GND13. During 30 cruises, reference materials of nutrients in seawater or their equivalents were used at all stations, and high-precision measurements were made. The precision of the nutrient analyses was better than 0.2 %. Data were collected from the hydrographic cruises in the JASMTEC R/V Mirai cruises, JMA cruise, CARINA, PACIFICA, and WGHC datasets from which nutrient data were available. Analyses were conducted at 243 crossover stations. Cruises that used certified reference materials or reference materials (CRMs/RMs) for seawater nutrient concentration measurements were used as a reference of an unbroken chain of comparison to determine correction factors which made nutrient concentrations obtained by other cruises SI traceable. Dissolved oxygen was secondarily quality-controlled using the same methodology as was used to create the nutrient gridded data product, but, lacking a traceable standard, the resulting oxygen data product is not SI traceable. Finally, a dataset of nitrate, phosphate, and silicate concentrations was created at latitude and longitude intervals of 0.5∘ and on 136 isobaric surfaces to depths of 6500 m as an SI-traceable dataset. This dataset has already been published at: https://doi.org/10.17596/0000001 (Aoyama, 2017).
- Article
(14674 KB) -
Supplement
(16187 KB) - BibTeX
- EndNote


Global oceanic biogeochemical cycles are being significantly altered by the direct and indirect impacts of human activities. It is therefore necessary to obtain accurate information about changes and trends of concentrations of inorganic carbon and dissolved inorganic nutrients in both shallow and deep ocean waters. For this information to be of practical use, it is critical that results from different laboratories can be compared with complete confidence. A global consensus about nutrient concentrations requires that there be access to certified reference materials (CRMs), and there must be a requirement or ethos for the use of these CRMs when oceanic nutrient concentrations are measured and subsequently when they are recorded in global databases, incorporated in climate models, and ultimately used to quantify changes to the Earth system.
The 2007 IPCC Report highlighted the problem inherent in comparing datasets by stating that “Uncertainties in deep ocean nutrient observations may be responsible for the lack of coherence in the nutrient changes. Sources of inaccuracy include the limited number of observations and the lack of compatibility between measurements from different laboratories at different times” (Bindoff et al., 2007). Analyses of nutrient concentrations from crossover stations have shown consistent disagreement of up to 10 % for deep water nutrient data during the last three decades (Aoyama et al., 2013; Tanhua et al., 2009). Results of interlaboratory comparison studies since 2003 have shown biases of a similar magnitude between some participant laboratories (Aoyama et al., 2007, 2008, 2010, 2016, 2018). This pattern indicates that analytical problems may be the main cause of the large discrepancies in reported deep water nutrient concentrations. The reported results imply that these biases are also present throughout the water column. These comparisons were based on only a small number of specific studies, but there are many oceanic nutrient datasets reported, published, and stored on international databases with no references to CRMs at all. Although this situation has improved somewhat since 2011 after a CRM of nutrients became available, it is still difficult to ascertain with total confidence any temporal changes in oceanic nutrient concentrations. We can now detect changes in deep ocean temperature (and hence heat content) (Levitus et al., 2009, 2012; Kouketsu et al., 2009; Rhein et al., 2013) because of the excellent comparability of temperature measurements over a number of years. Changes to the carbonate system parameters in the deep ocean have also been reported with comparability ensured by the use of CRMs (e.g., Wanninkhof et al., 2010). Similarly, changes in oceanic oxygen concentrations can now be determined (Stendardo and Gruber, 2012).
Reference materials (RMs) and CRMs for nutrients in seawater have been developed for oceanographic use. These currently include a Danish RM (Eurofins); the National Research Council of Canada's CRM (MOOS-3); a new RM developed by Korea (K-RMS); and one developed by KANSO, Japan. The reference material for nutrients in seawater produced by KANSO has been used in the interlaboratory comparison exercise organized by the Meteorological Research Institute, MRI, and jointly by the International Ocean Carbon Coordination Project, IOCCP, and Japan Agency for Marine-Earth Science and Technology, JAMSTEC, since 2003 (Aoyama et al., 2007, 2008, 2010, 2016, 2018). The results of the latest interlaboratory comparison exercise (IC), “IOCCP-JAMSTEC 2017/18 Inter-laboratory Calibration Exercise of a Certified Reference Material for Nutrients in Seawater”, are now available (Aoyama et al., 2018). It is clear from the current results (see Figs. 6, 7, and 8 in the 2017/2018 report) that the normalized cumulative distributions of nitrate and phosphate were better in 2018 than in previous years. The curves were flatter than the normalized cumulative distributions in previous IC exercises. This improvement for nitrate and phosphate measurements might be a reflection of the fact that the number of laboratories that use CRM/RMs was increasing during those years.
The implication is that comparability of silicate analyses among the laboratories did not improve between 2008 and 2018 to the same degree that it did for nitrate/phosphate, and the correction factors for silicate were indeed more variable and uncertain than the correction factors for nitrate and phosphate.
This difference of comparability between nitrate/phosphate and silicate analyses can be also seen in the results of correction factor estimation with uncertainty in this study. In particular, correction factors of silicate were more variable and were associated with greater uncertainty than the correction factors for nitrate and phosphate. Consensus standard deviations of nutrient concentrations of nitrate, phosphate, and silicate were 1 order of magnitude larger than the homogeneity of the currently available CRM/RMs and were about double the reported precision of measurements of the individual laboratories. These IC results therefore showed that use of CRMs should greatly improve the comparability of nutrient data among laboratories throughout the world. The current high level of analytical performance at many participating laboratories indicates that the use of certified reference materials would establish traceability. The use of CRMs/RMs during global cruises in the CLIVAR (Climate and Ocean: Variability, Predictability and Change), GO-SHIP (Global Ocean Ship-based Hydrographic Investigations Program), and GEOTRACES projects has been increasing, and the author has been using CRM/RMs during the cruises of the Japan Agency for Marine-Earth Science and Technology (JAMSTEC) R/V Mirai since 2003. Disagreements between cruises at depth tend to be smaller when reference materials are used.
On the other hand, the method for determining the dissolved oxygen concentration in seawater is generally the Carpenter method (Carpenter, 1965), which is an improvement on the Winkler method but is hereafter simply referred to as the Winkler method. In this Winkler method, manganese hydroxide “fixes” dissolved oxygen under alkaline conditions, and the “fixed” dissolved oxygen quantitatively oxidizes iodine ions to free iodine under acidic conditions. Titrating the free iodine with a sodium thiosulfate solution of known concentration indirectly quantifies the dissolved oxygen concentration.
The sodium thiosulfate solution concentration is determined by titration of a potassium iodate solution of known concentration (potassium iodate quantitatively oxidizes iodine ions to free iodine under acidic conditions). In Japan, SI-traceable certified reference potassium iodate standards are supplied by the National Meteorology Institute of Japan, National Institute of Advanced Industrial Science and Technology (NMIJ). Ocean Scientific International Ltd, OSIL, UK, and FUJIFILM Wako Pure Chemical Corporation, Japan, also provide potassium iodate solutions, which are used to standardize the thiosulfate solution in the widely used Winkler titration method. Therefore, dissolved oxygen concentrations measured around the world have some extent of comparability.
This article describes a global gridded dataset produced using CRM/RM-scaled SI-traceable nutrient concentrations based on key cruises that used CRM/RM and an unbroken chain of comparison. Several previous publications have provided synthesis results of data collected by several projects such as the Global Ocean Data Analysis Project (GLODAP, GLODAPv2, GLODAP v2 update), CARbon dioxide IN the Atlantic Ocean (CARINA) project, and PACIFic ocean Interior CArbon (PACIFICA) project (Key et al., 2010; Suzuki et al., 2013; Olsen et al., 2016, 2019). The time frame of this work is that cruises categorized as 1 were conducted between 2003 and 2013; all of the resulted data in this work are adjusted for the 2003–2013 time frame. Another positive attribute of this work is that the uncertainty of correction factors could be estimated.
The author also adds dissolved oxygen concentration data as an additional parameter of GND13 using the same technology to create nutrient gridded data, specifically the unbroken chain of comparison, which means obtained gridded data of dissolved oxygen are traceable to a set of data obtained from 30 key cruises identified in Sect. 2. As noted, this does not mean the oxygen product is SI traceable.
This article is an effort to establish a global nutrient dataset for which comparability and traceability in space and time are explicitly ensured based on the use of CRMs/RMs of nutrients in seawater. Another positive attribute of this work is that the uncertainty of correction factors could be estimated.
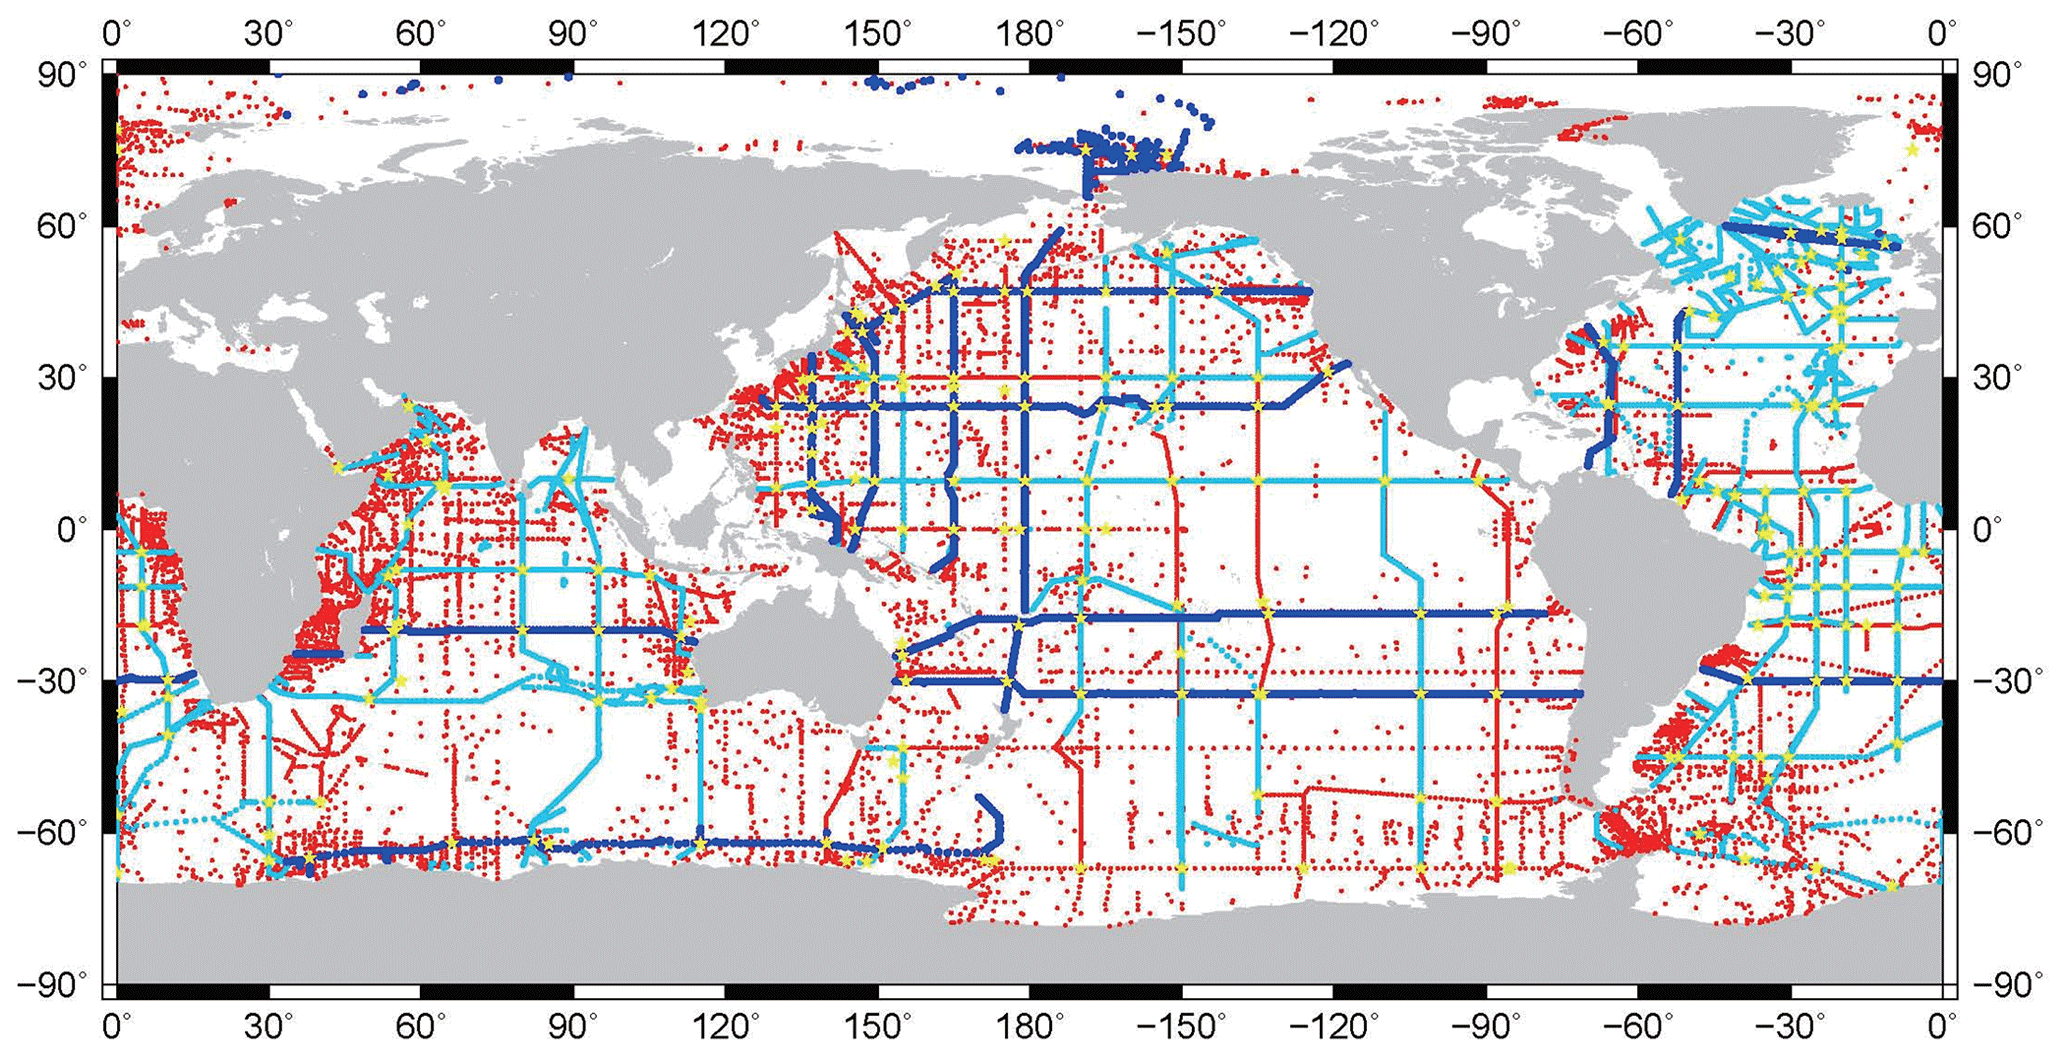
Figure 1Sampling locations where nitrate concentrations were measured and tracks of cruises that measured nitrate concentrations. Dark blue: category 1 cruises with CRM/RM or equivalent quality control. Light blue: category 2 cruises, WOCE/GO-SHIP cruises, but no CRM/RM used. Red: cruises in categories 3–7. Yellow points are crossover points.
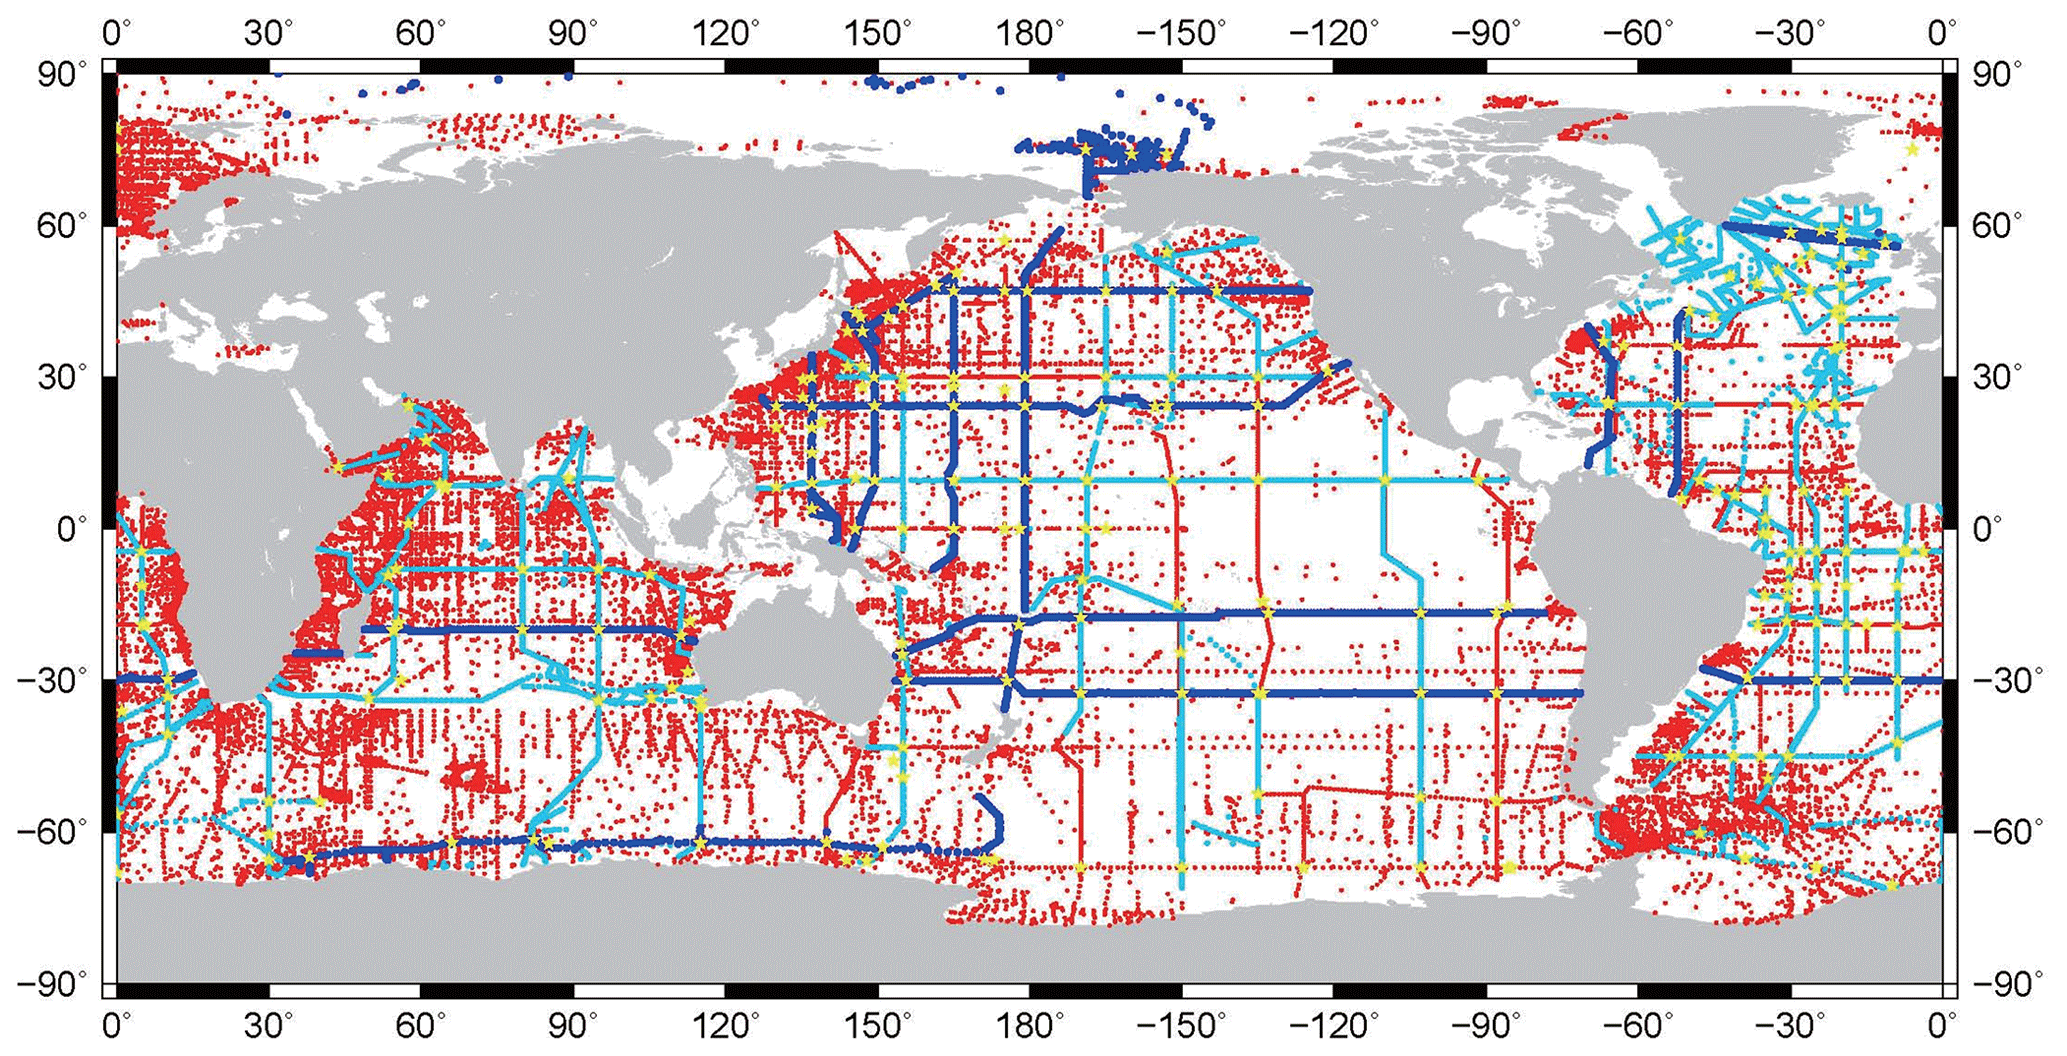
Figure 2Same as Fig. 1 but for phosphate.
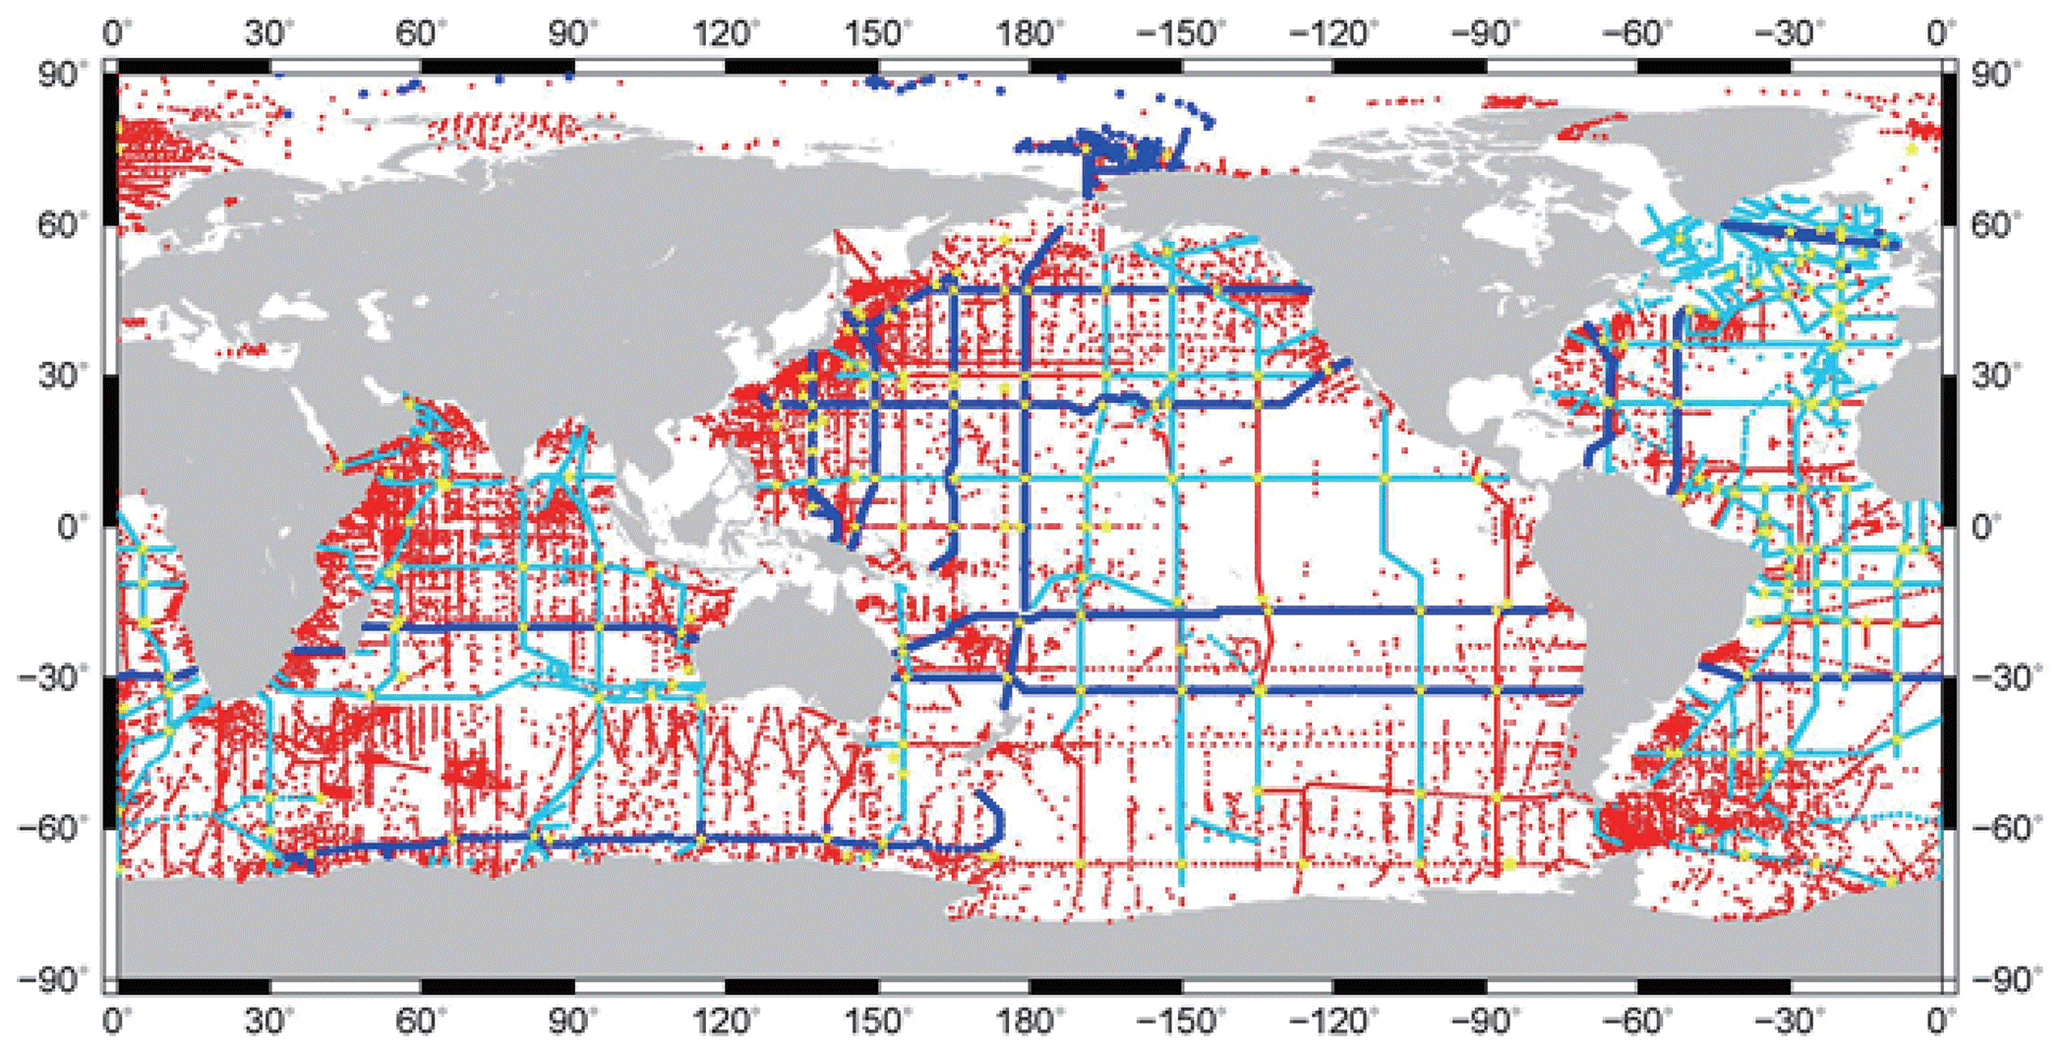
Figure 3Same as Fig. 1 but for silicate.
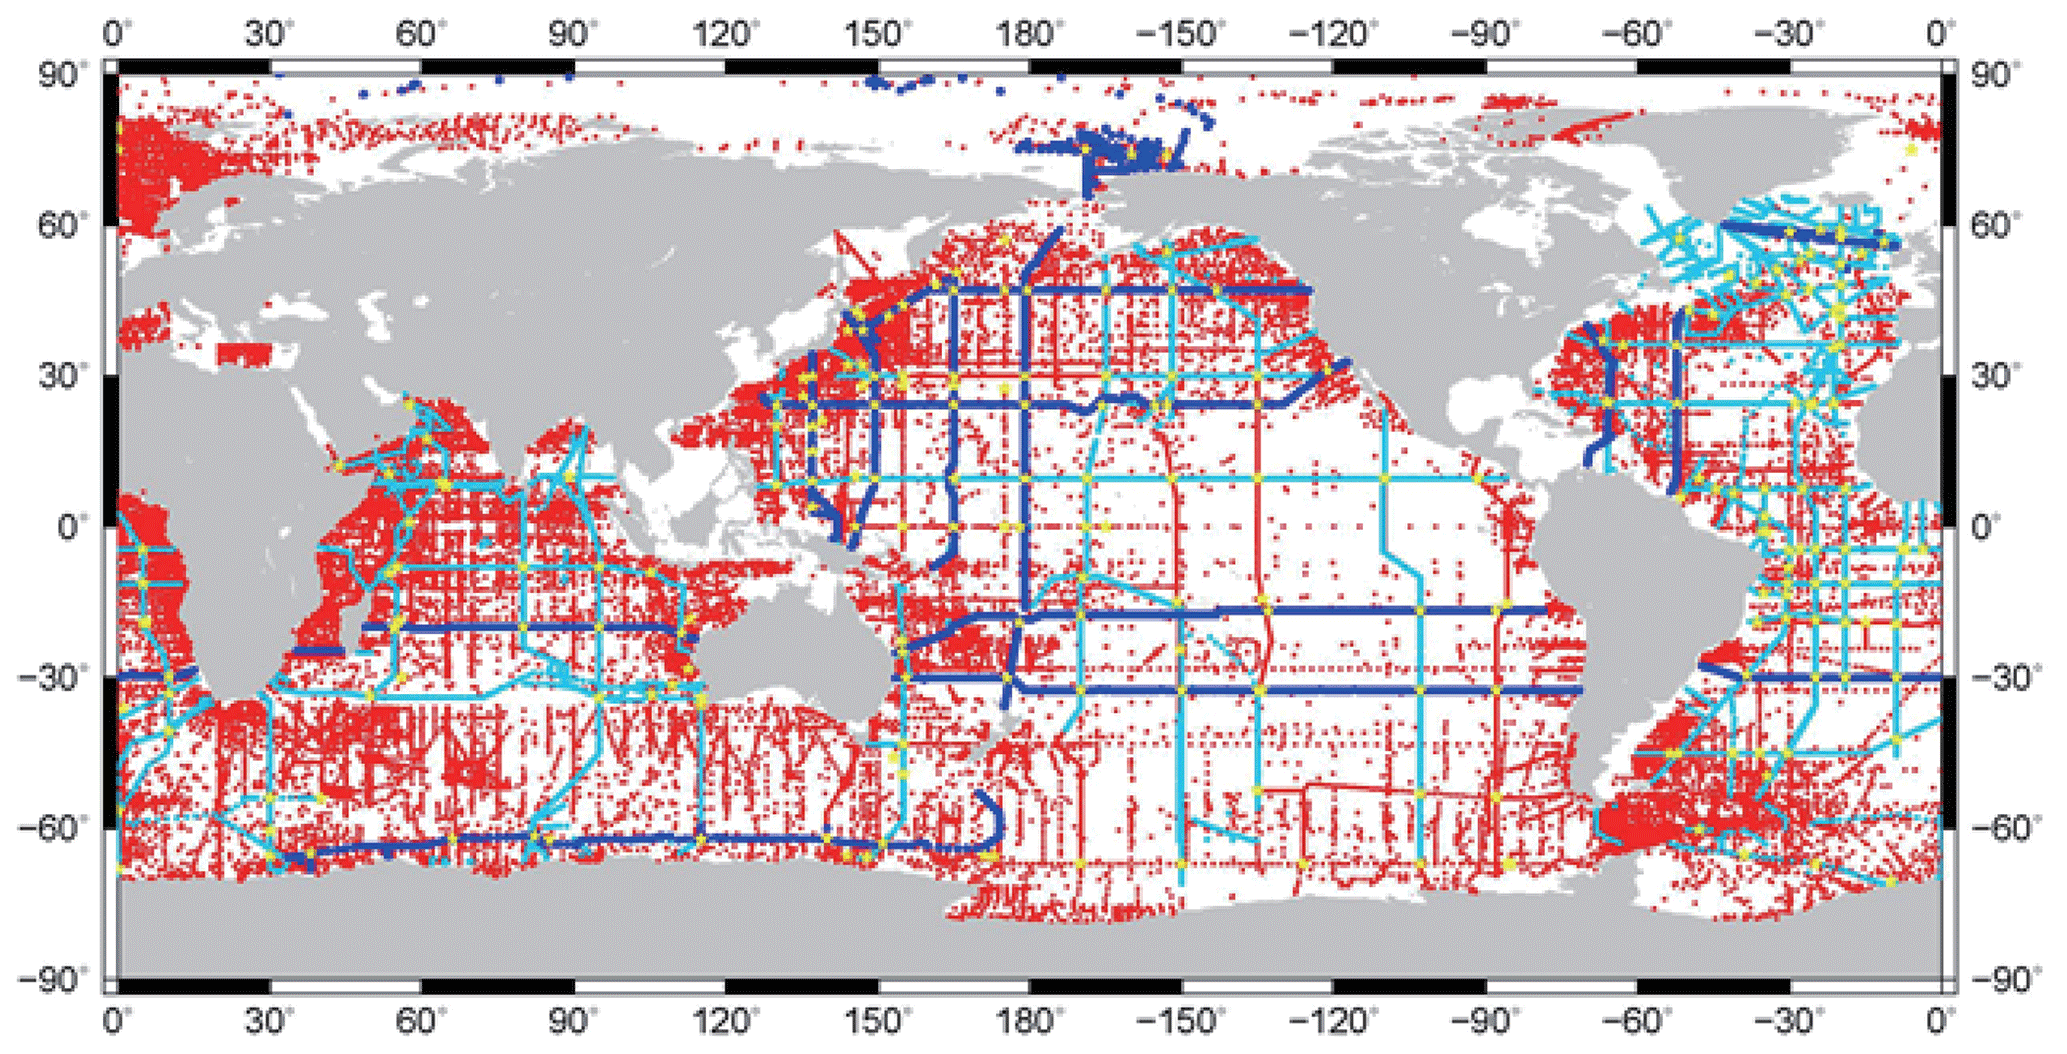
Figure 4Same as Fig. 1 but for oxygen.
Data from 30 cruises that used CRM/RM for quality control of nutrient concentrations in seawater were used to obtain an accurate baseline of the spatial distribution of nutrient concentrations in the ocean. The correction factors for those cruises were set to 1.00, indicating no adjustment is applied, because comparability of nutrient concentrations was ensured (Sato et al., 2010).
For oxygen data, the factors for 30 cruises were assumed to be 1.00 because gridded data of dissolved oxygen are aimed at being consistent with the data obtained from 30 key cruises.
2.1 Data collection and quality control
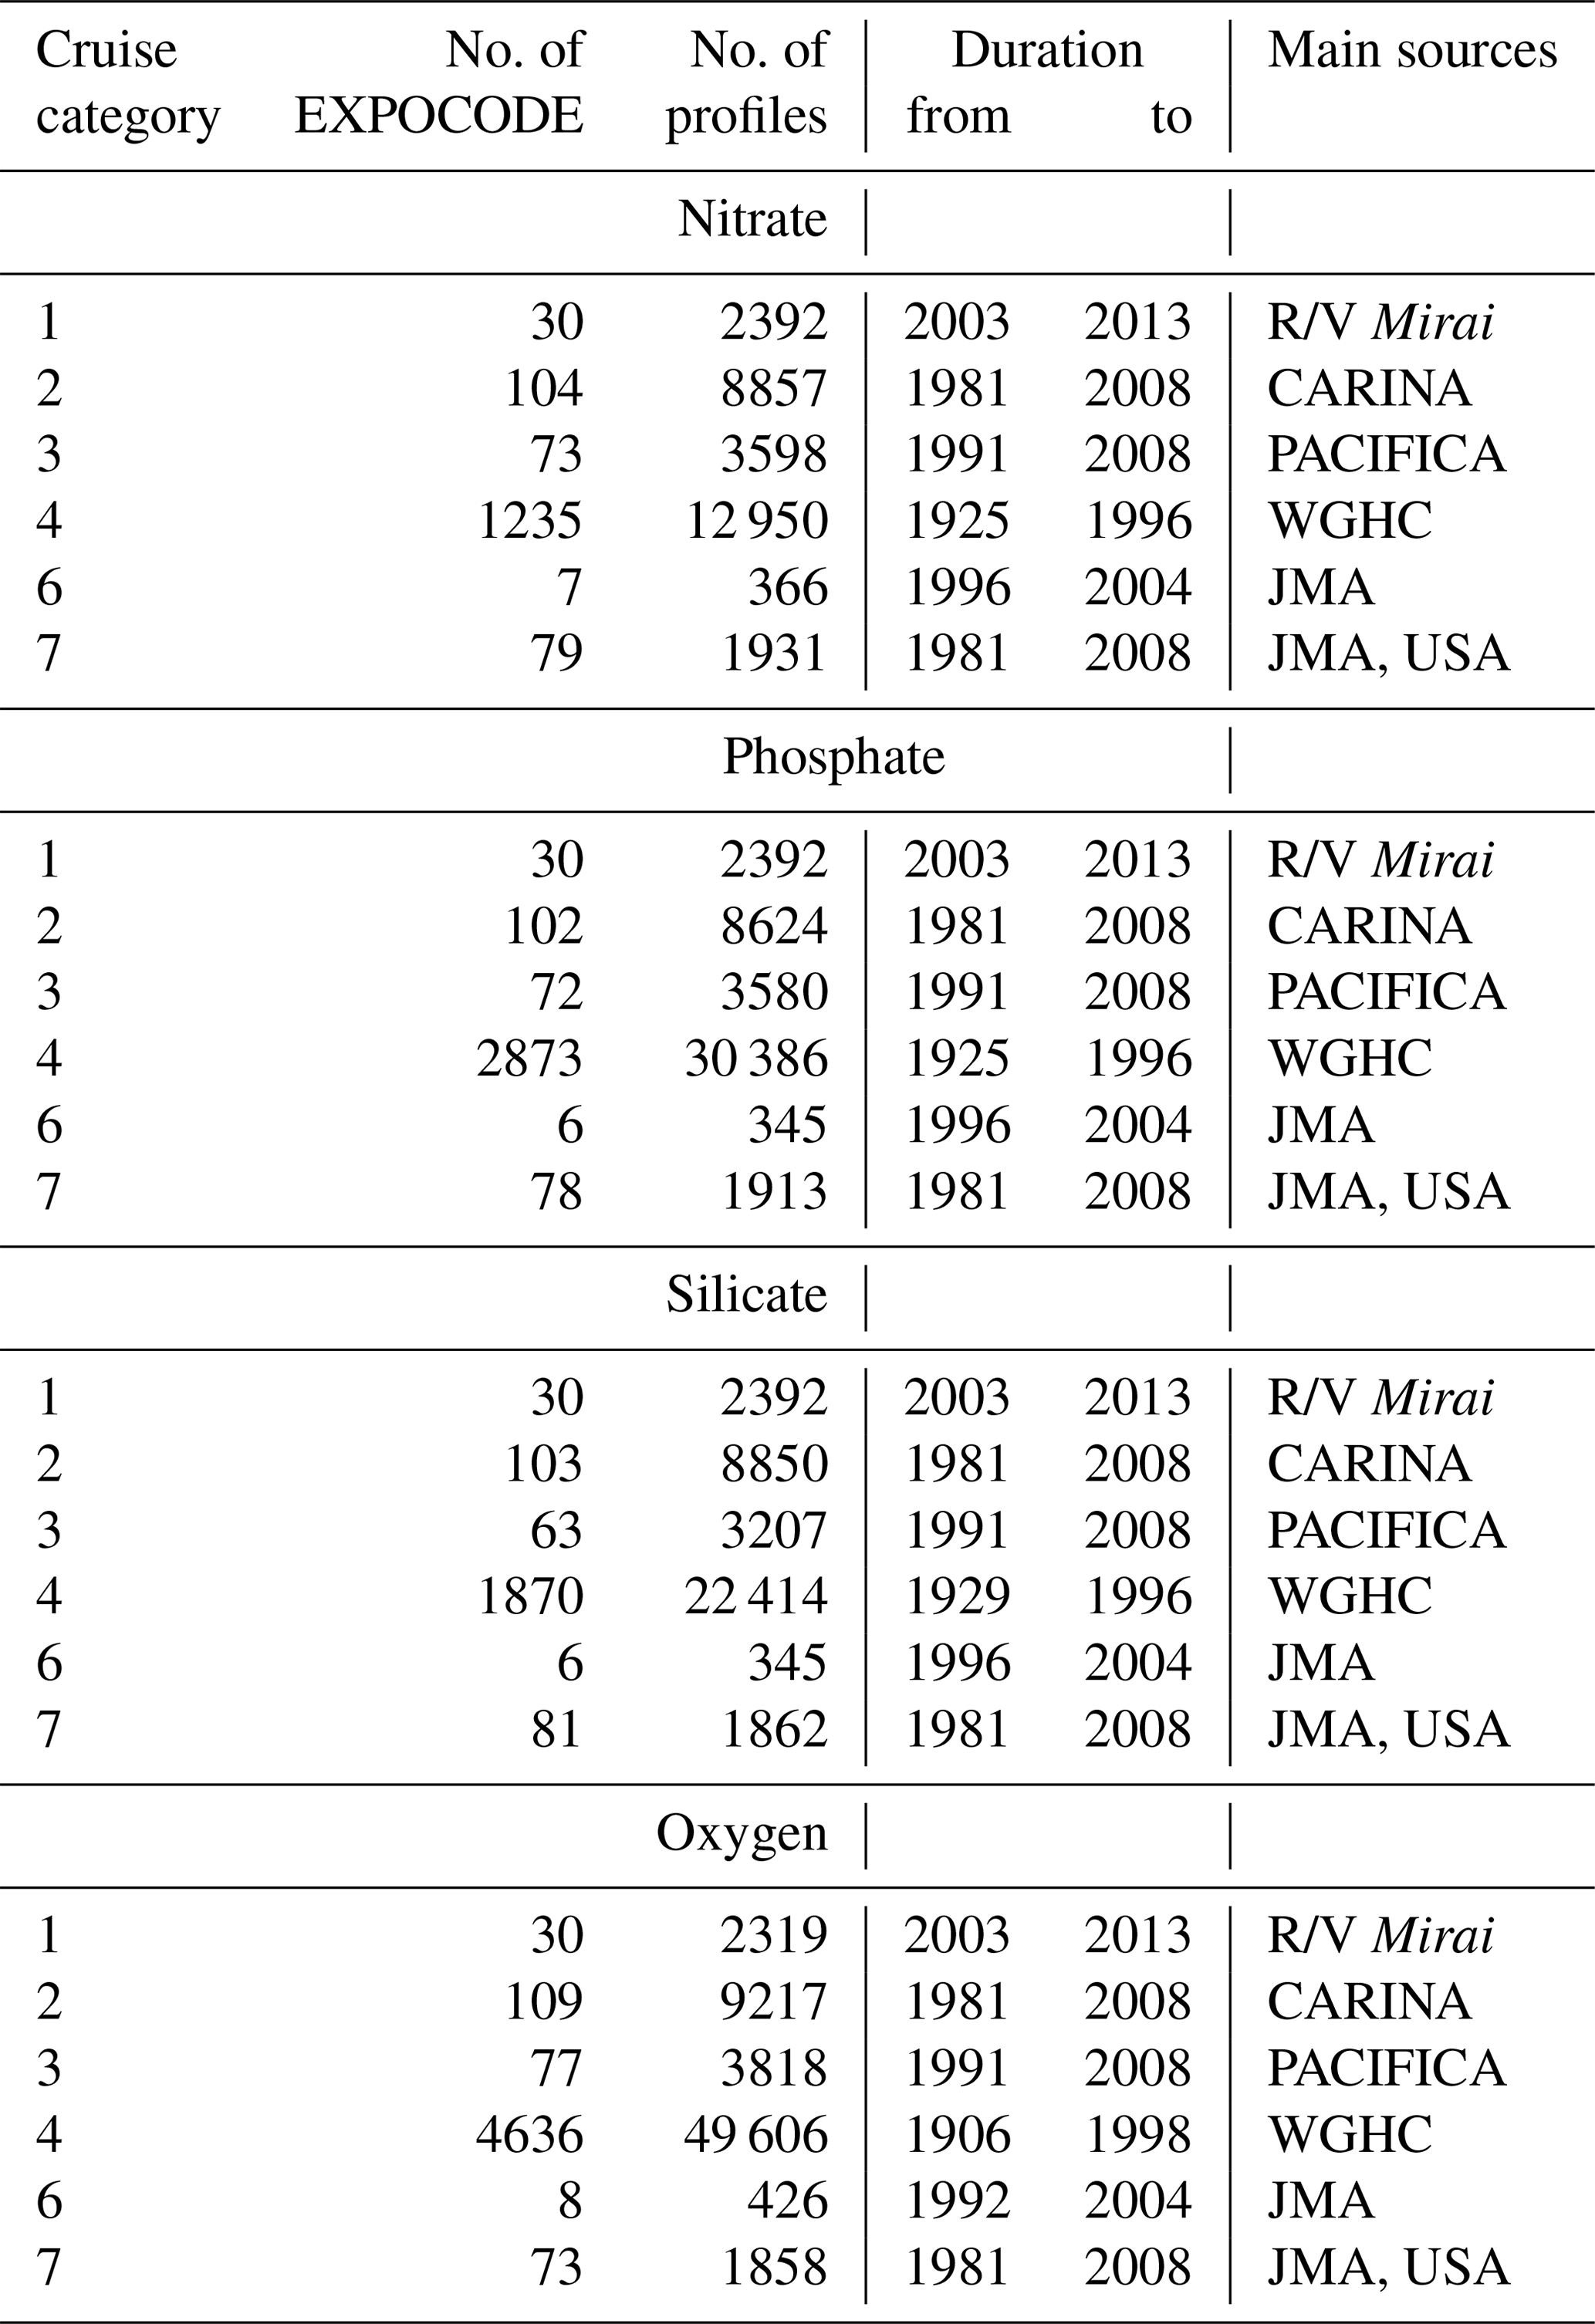
Nutrient data from the global ocean were collected from various sources and separated into categories from 1 to 7 (Table 1). Thirty cruises were assigned to category 1. Twenty-five of the 30 key cruises were carried out by R/V Mirai during 2003–2013. The author used RM/CRM on those cruises as working standards for nutrient measurements at all stations to ensure high quality and comparability among the stations and among the cruises. In the Atlantic Ocean, five cruises were also selected as category 1 because RMs were used on two of the five cruises. Since comparability of nutrient data between JAMSTEC R/V Mirai cruises during the period from 2003 to 2013 and NIOZ cruises conducted in 2005 and 2007 was explicitly confirmed through interlaboratory comparison studies for reference materials of nutrients in seawater conducted in 2006 and 2008 (Aoyama et al., 2008, 2010), these two cruises were also added to category 1 to increase coverage by category 1 cruises in the Atlantic Ocean. Most of the data in category 2 were obtained from the CARINA project dataset. Most of the data in category 3 were obtained from the PACIFICA project dataset for the period 1991–2008. Many data were obtained from the World Ocean Circulation Experiment (WOCE) Global Hydrographic Climatology (WGHC) (Gouretski and Koltermann, 2004) data product. That dataset includes data from many cruises during the period 1925–1996, and those data were assigned to category 4. Category 5 was intentionally blank for future use. Some cruises conducted by the Japan Meteorological Agency (JMA) were not included in the CARINA, PACIFICA, and WGHC datasets. They were therefore included in the dataset for this study and assigned to category 6. Data from about 80 cruises by the JMA and United States institutes that were not included in the above categories were assigned to category 7.
Figures 1–4 show the locations of all the stations where data were collected. In these figures, stations in category 1 are marked in dark blue, stations in category 2 are marked in light blue, and stations in categories 3–7 are marked in red. It is apparent from these figures that the category 1 cruises did not cover the whole ocean, but if category 1 and 2 data are used to create a global dataset, the spatial coverage increases to almost all of the ocean, and the resultant dataset is a high-quality global nutrient dataset.
It is important to do quality control before using this historical dataset because it contains questionable data. In the WOCE dataset and later, there are quality flags (Joyce et al., 1994). Only data associated with quality flag 2 (i.e., data quality is good) were therefore used in this study. In cases where the data did not have quality flags, e.g., for the historical data, a median filter whose criteria for outliers was 3 times the standard deviation was applied to identify questionable data. This median filter procedure was done to datasets after the nutrient data were divided into sets of data which were involved in a region whose size was about a 500 km×500 km square and whose thickness was 100–300 m in the deep ocean and 10–50 m in the shallow ocean. Questionable data were removed from the dataset before vertical integration, estimation of correction factors, and creation of the global gridded data product.
2.2 Crossover analysis
In general, stations from each cruise within 250 km of 243 points worldwide were selected if there were data from several stations from at least a cruise in category 1 and at least a cruise from category 2. In the Pacific sector of the Southern Ocean, to cover the regions not covered by category 1 and 2 cruises, categories 3–7 were used to construct crossovers. As an example, Fig. 5 shows the locations of the subset of P03 and P14 stations used for a crossover comparison for a crossover at 24.2∘ N and 179∘ E. This crossover is assigned the designation CR081E, and there were two category 1 cruises and two category 3–7 cruises. Figure S1 in the Supplement shows all station locations at the 243 crossovers. Figure 6 shows examples of vertical profiles of nitrate concentrations, phosphate concentrations, nitrate-to-phosphate concentration ratios, and silicate concentrations at crossover CR081. Figure 6 also shows climatological nutrient concentrations in the WGHC dataset and WOA05 dataset for comparison. There were two cruises conducted in 2005 and 2007, which were category 1 cruises, where RMs were used as working standards at all stations by the author. The results from those cruises were in good agreement with data collected within a 250 km radius, and the error bounds (i.e., uncertainties) overlapped completely. In contrast, concentrations from two cruises conducted in 1985 and 1993 were relatively scattered (Fig. 6). To estimate correction factors based on the 30 key cruises, vertical integration between depths of 1000 and 2000 m, 1500 and 2500, and 2000 and 3000 m for nitrate, phosphate, silicate, and oxygen were done at all stations within each of the 243 crossovers. This integration was done based on the Akima interpolation method (Akima, 1970). When the number of profiles of a cruise exceeded 3, the standard deviation of the integrated values was calculated as a metric of the uncertainty of the correction factor. Table 2 shows the valid number of profiles obtained by vertical integration from 1000 to 2000 m depths, from 1500 to 2500 m depths, and from 2000 to 3000 m depths for nitrate, phosphate, silicate, and oxygen concentrations at the P03–P14 crossover stations at 24.2∘ N and 179∘ E. As expected from the vertical profiles at the crossovers, the integrated values in units of micromoles per square meter (µmol m−2) for the two cruises in category 1 (e.g., 49MR0505_2_1 and 49MR0706_1_) agreed to within 2 standard deviations for all four parameters. The standard deviations of two category 2 cruises in 1985 and 1993 were relatively large in general, and there were systematic differences that have already been identified in previous synthesis work. Because there was assurance of comparability of nutrient concentrations among the 30 key cruises, the author set the correction factor for theses cruises to 1.00. Because the measurement uncertainties during these cruises were less than 0.5 % in general, the uncertainty of correction factors was assumed to be 0.00.
Table 2Summary of means and standard deviations of the coefficient of variation (CV), a ratio of the standard deviations of the integrated values to a mean of the integrated value, within a 250 km radius at crossovers for the four variables in each category.
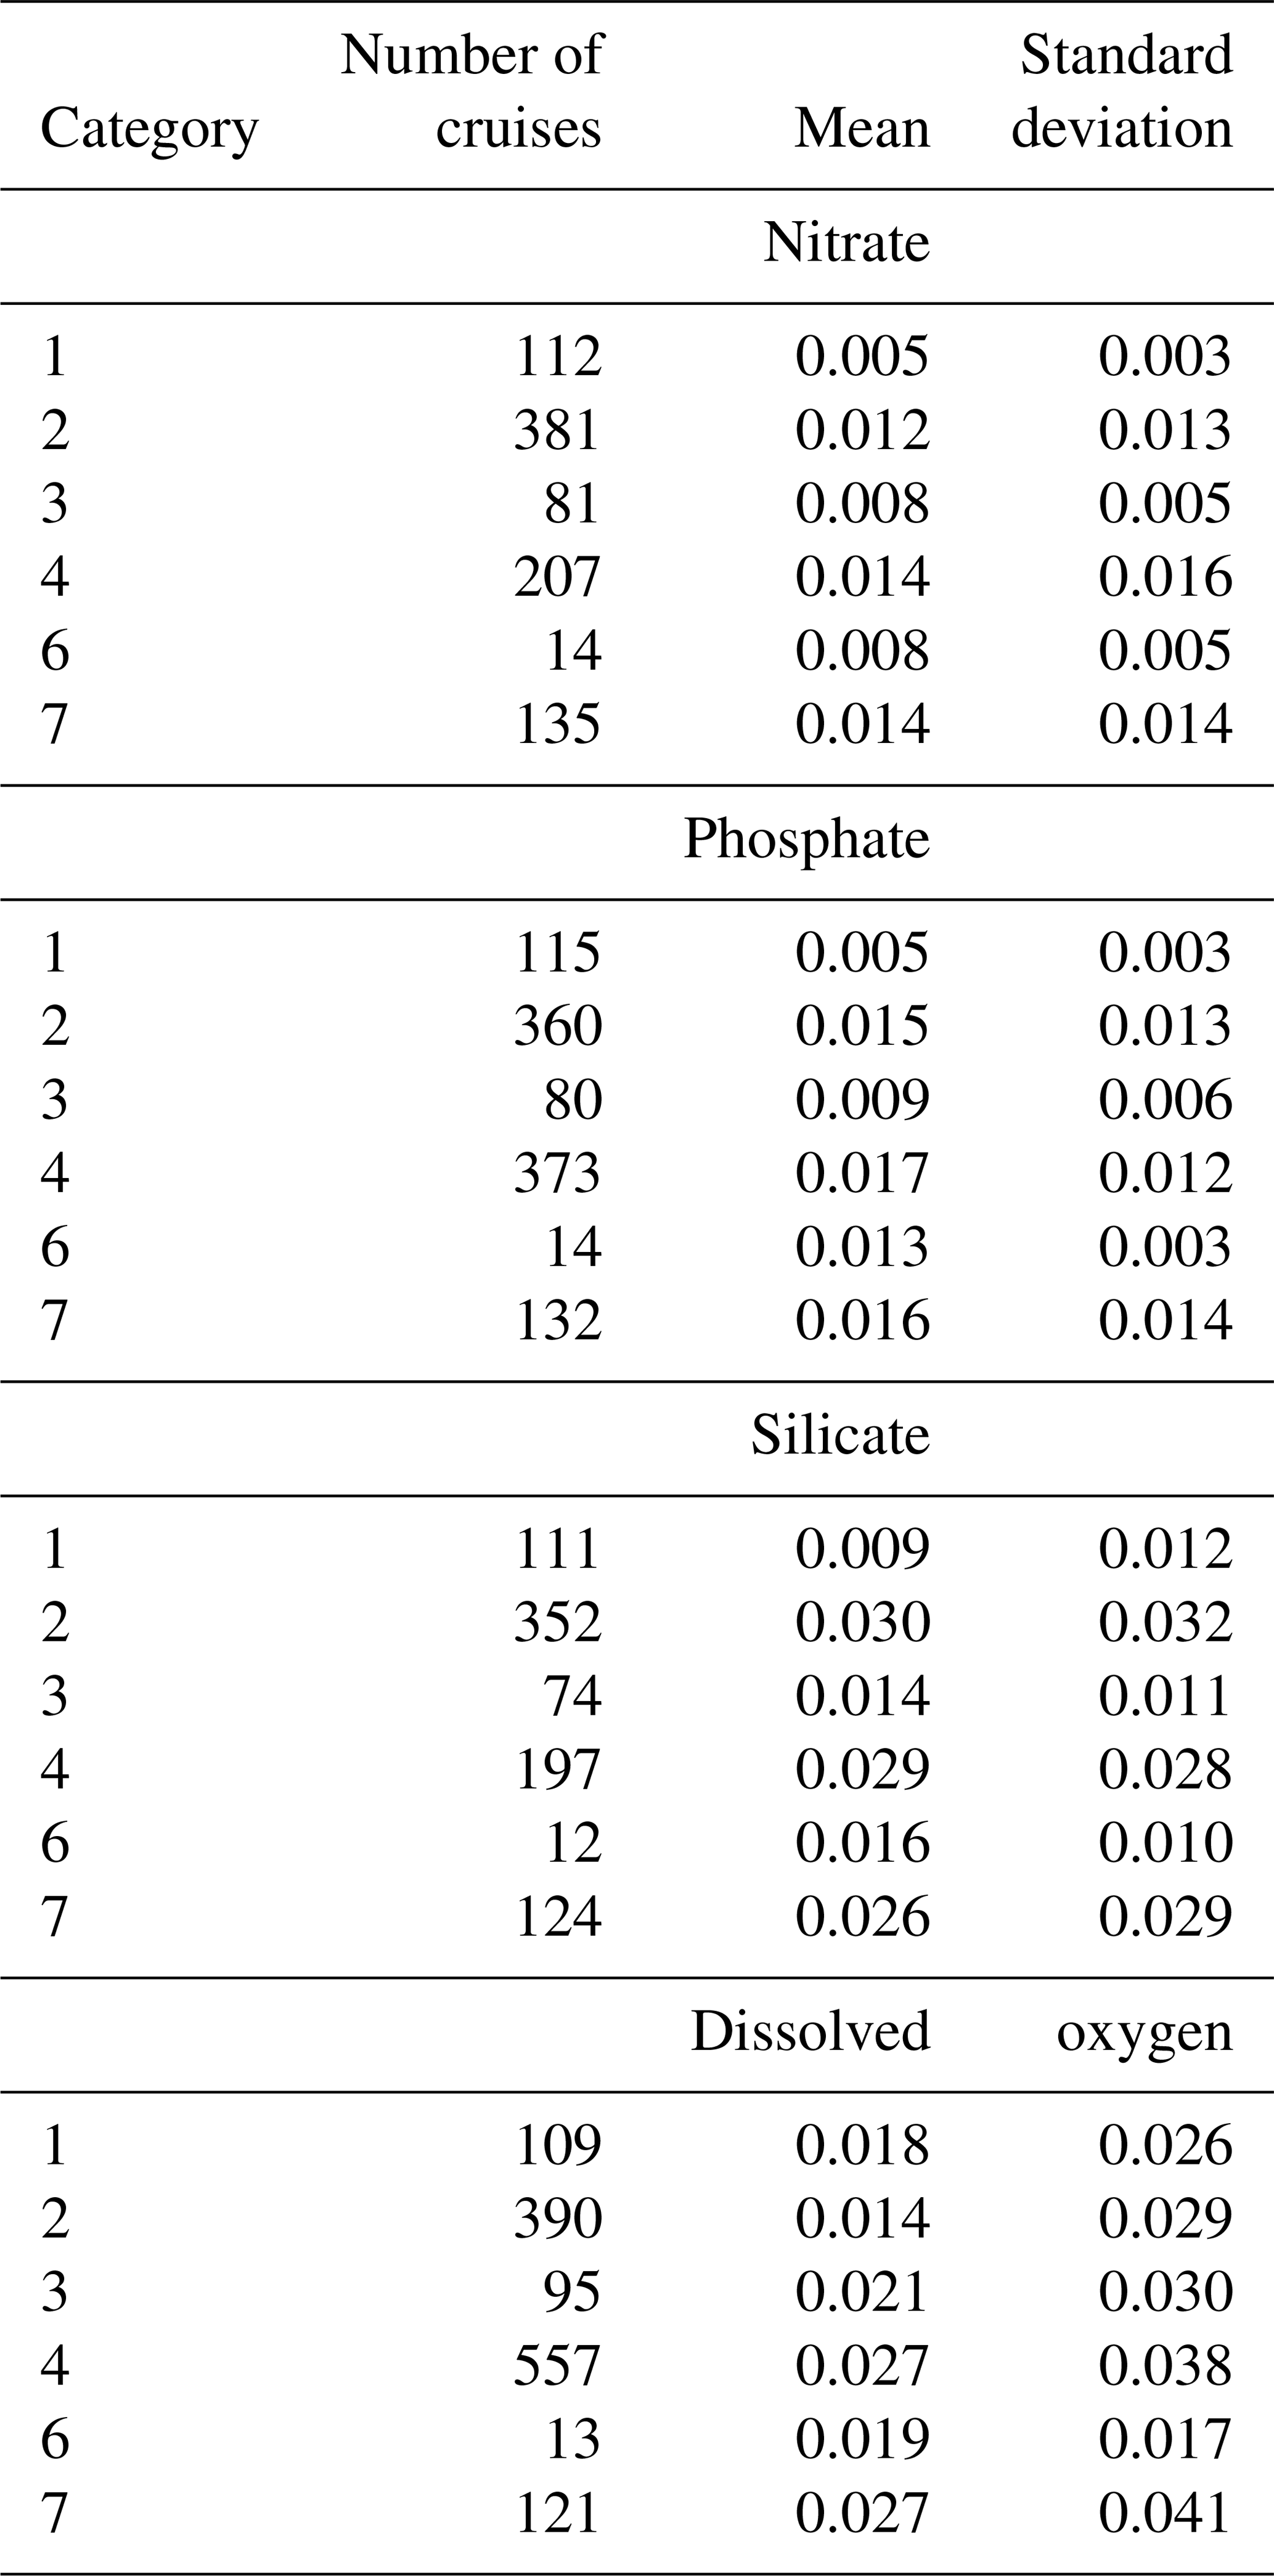
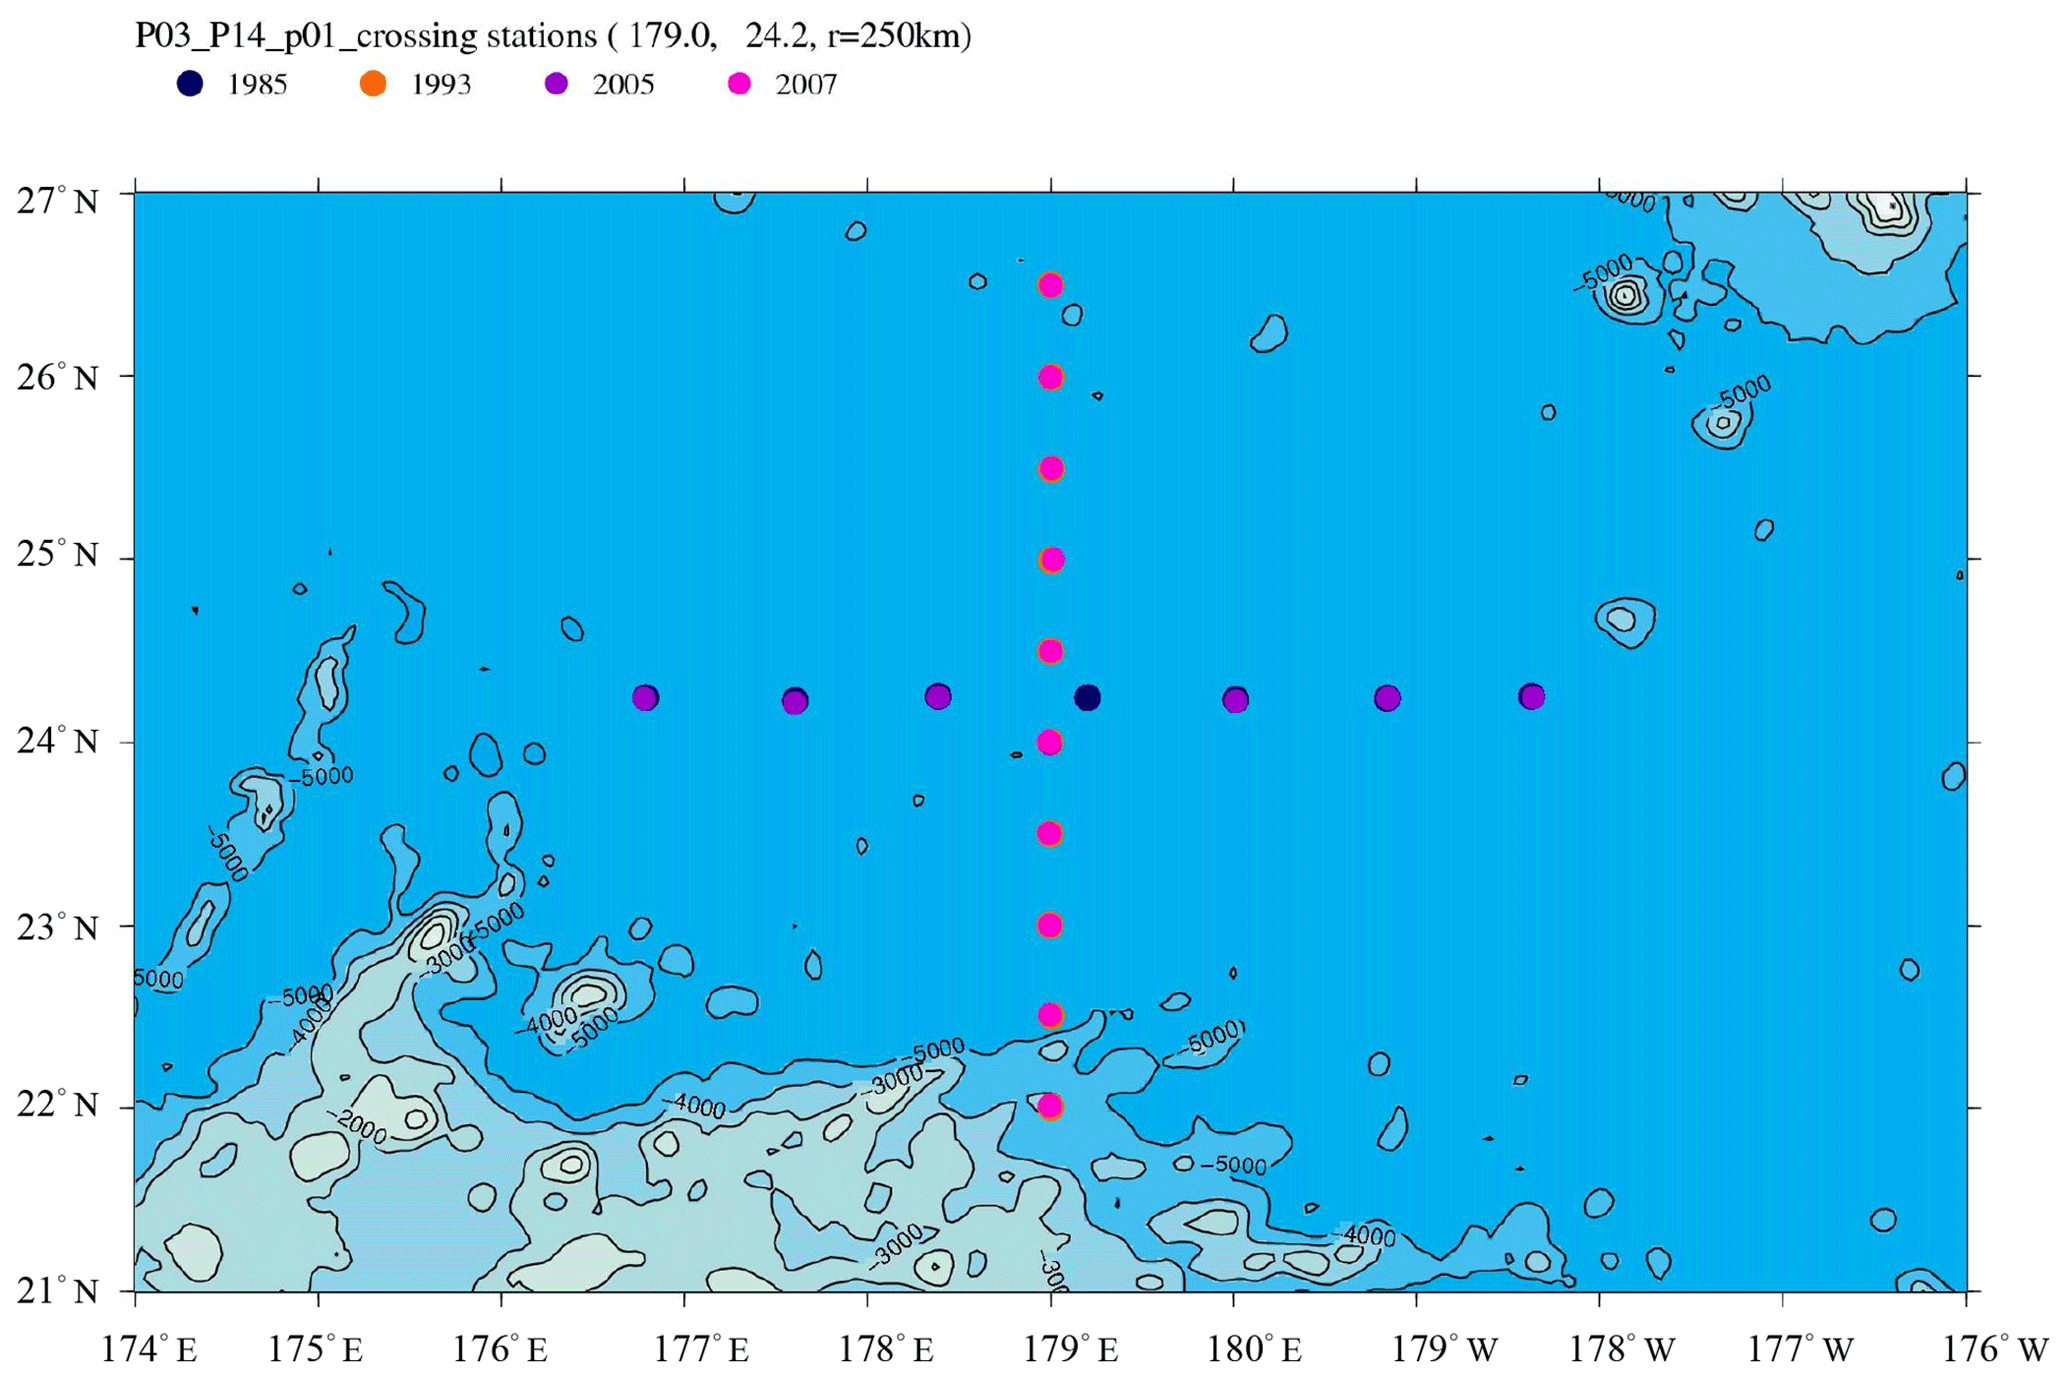
Figure 5Example of crossover stations for comparison at P03–P14 crossover.
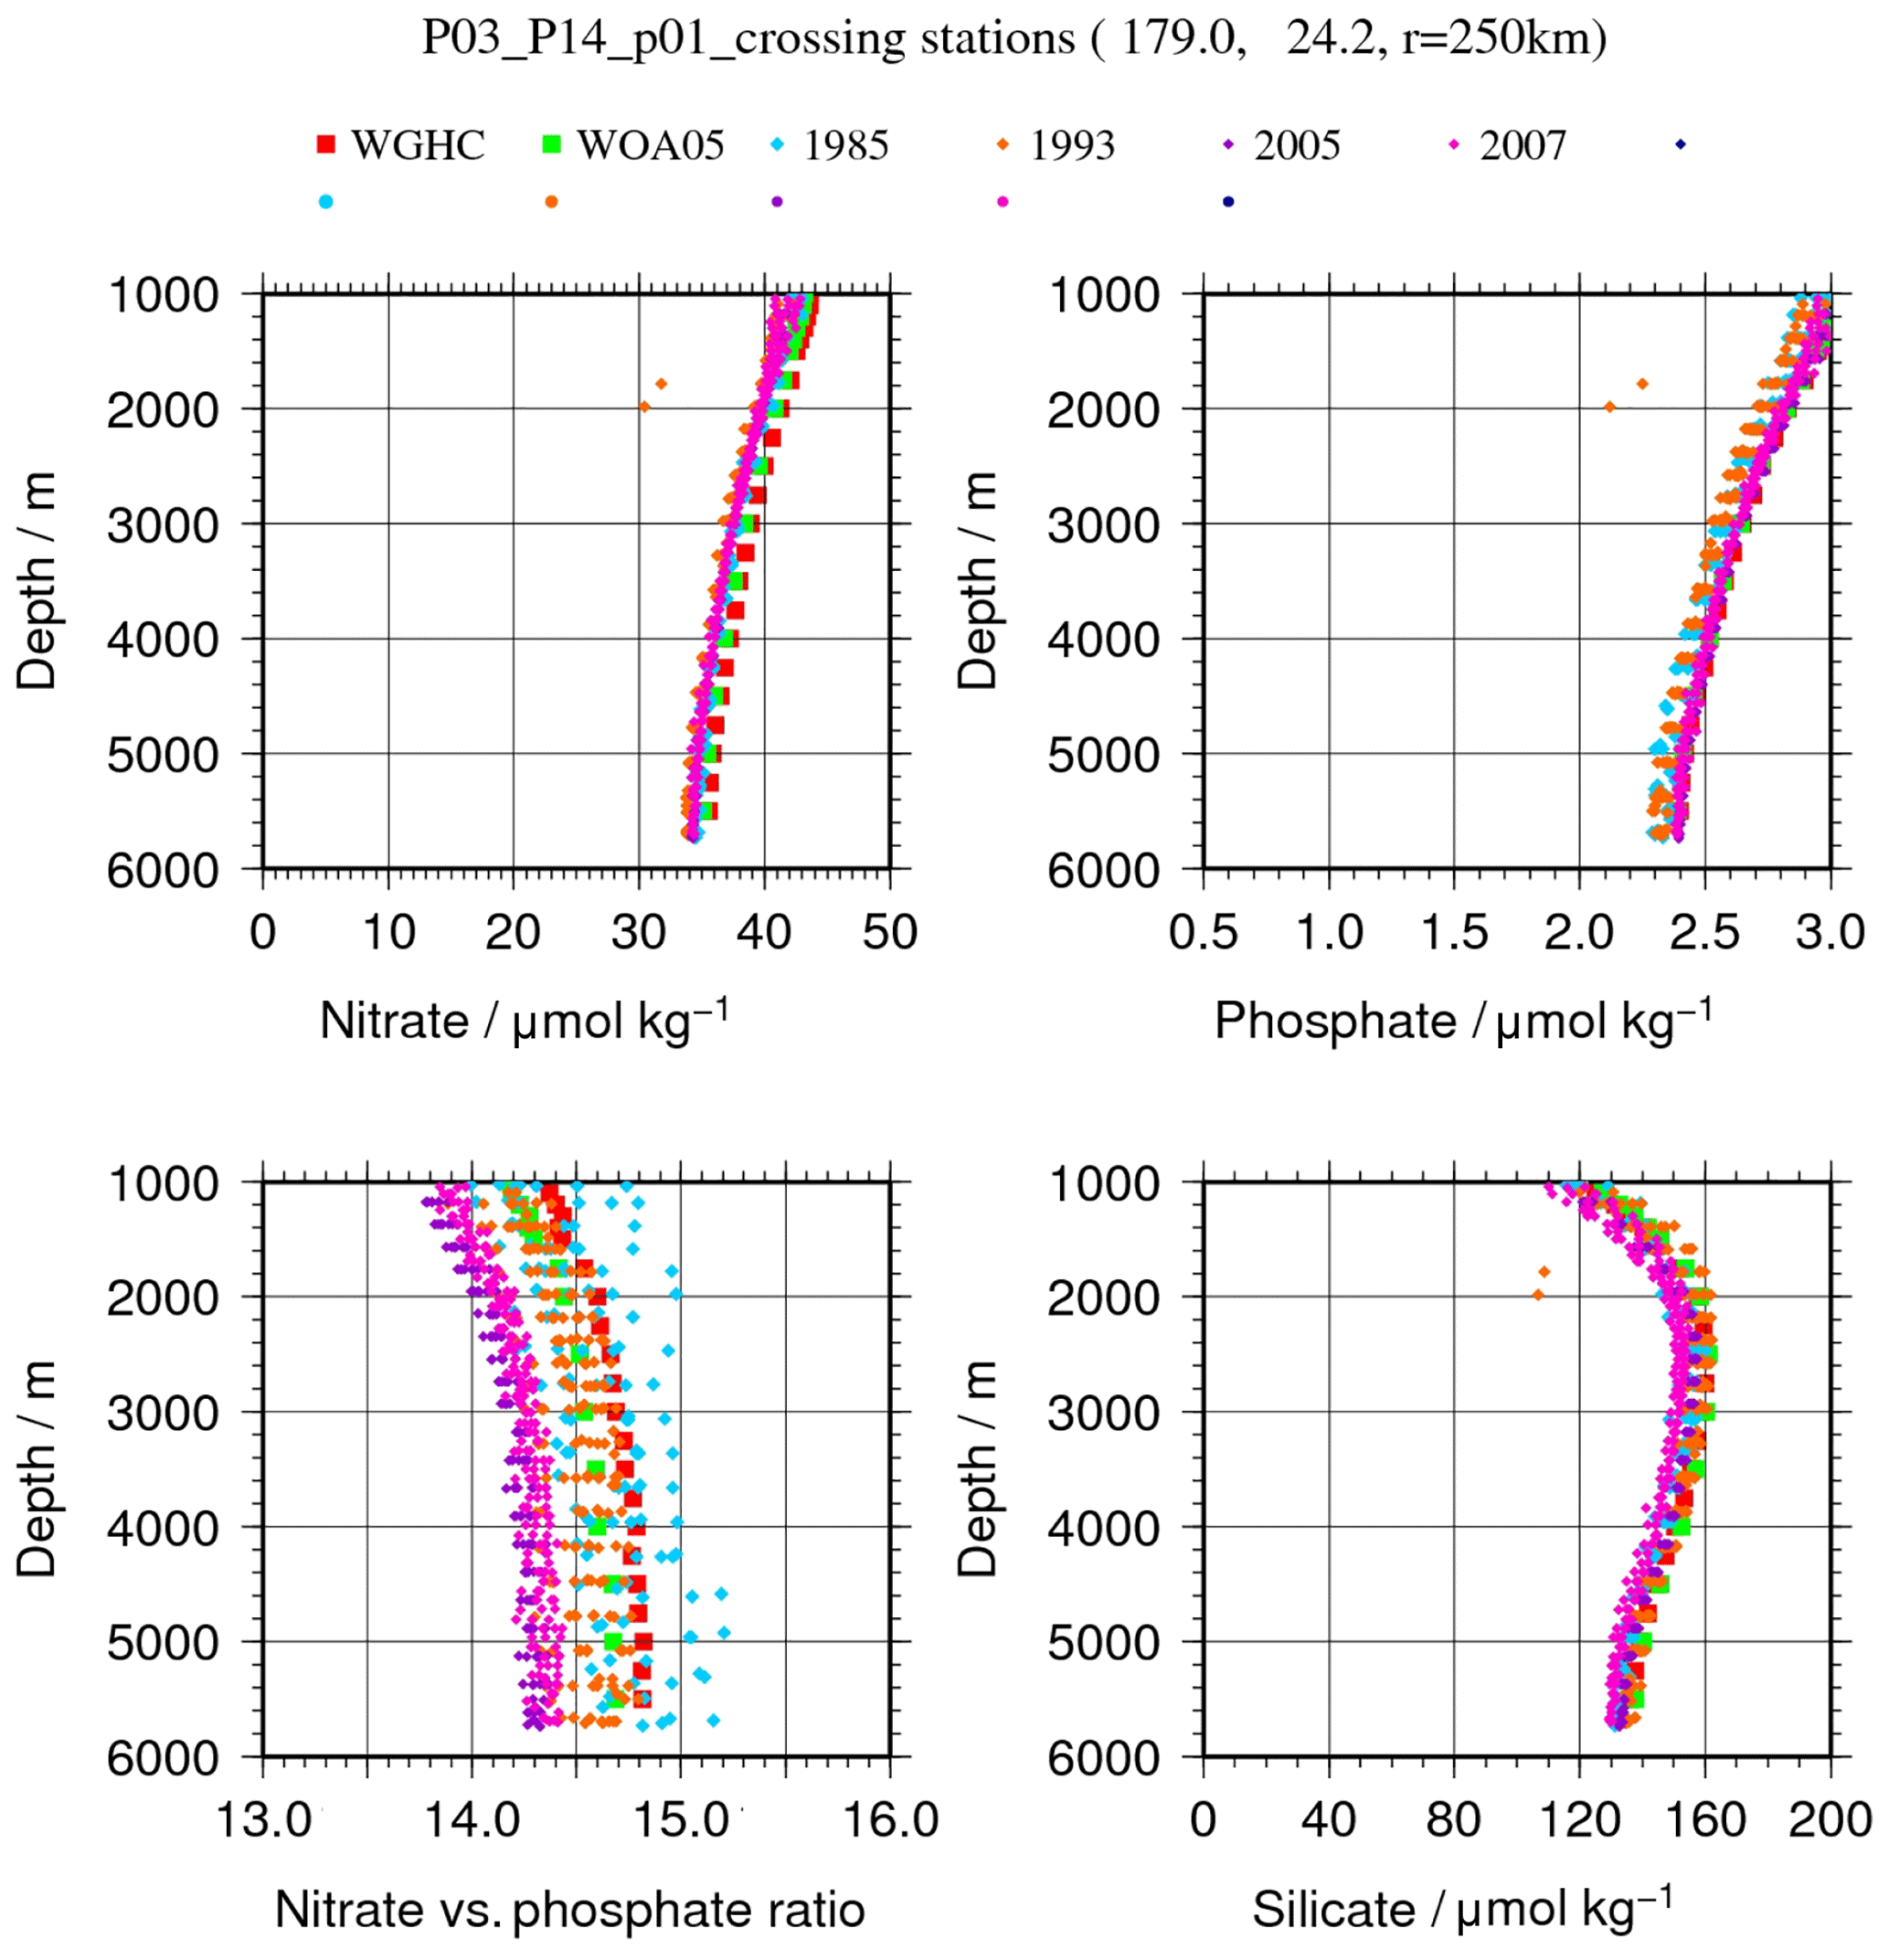
Figure 6Example of vertical profiles of nitrate and phosphate concentrations, the nitrate : phosphate molar ratio, and silicate concentrations at the P03–P14 crossover (n.b., during the 2005 and 2007 cruises, the author used RMs as an in-house standard).
To estimate correction factors at all crossovers the author selected to use integrated values by vertical integration from 1500 to 2500 m depths because there was a smaller coefficient of variation (CV), a ratio of the standard deviations of the integrated values to a mean of the integrated value and largest total number of the CV among three integration ranges for nitrate, phosphate and silicate.
The standard deviation of the integrated values for a set of profiles from each cruise within crossovers can be considered as the combined uncertainty of measurement uncertainty at each profile, station–station variability of measurements within a 250 km radius, and natural variability of nutrient concentrations among several stations within a 250 km radius at crossovers. It is expected that when RMs/CRMs are used as working standards to get a calibration curve, the station–station variability of measurements with a 250 km radius becomes very small. When in-house standards were used, station–station variability of measurements within a 250 km radius may contribute meaningfully. Therefore, it is interesting to look at the CV of the four parameters (Table 3). Figure 7 also shows histograms of the CV of the integrated value of the nitrate data in categories 1–7. It is very clear that the mean of the CV of the integrated values was 0.005 for nitrate and phosphate for category 1 cruises and that for silicate it was 0.009. The means of the CV of the integrated values for nitrate, phosphate, and silicate were smaller than those for categories 2–7. The main cause of the smaller mean of the CV of the integrated values for nutrient concentrations measured during the category 1 cruises might be the use of CRMs/RMs. The mean of the CV of the integrated values for nutrient concentrations was similar to the precision of each measurement, roughly 0.2 %–1.0 %. It should be also noted that the silicate measurements were compromised by some difficulties and/or instabilities – unlike the nitrate/phosphate measurements – that were observed in the global IC study discussed in the introduction of this article. On the other hand, the corresponding values for category 1 oxygen measurements were similar to those for category 2–7 cruises because there are no seawater matrix reference materials for dissolved oxygen, and comparability was kept only with potassium iodate solutions.
Table 3Examples of vertical integration between depths of 1000 and 2000 m, 1500 and 2500 m, and 2000 and 3000 m for nitrate, phosphate, silicate, and oxygen concentrations at CR081, P03–P14 crossovers, 24.2∘ N, 180∘ E.
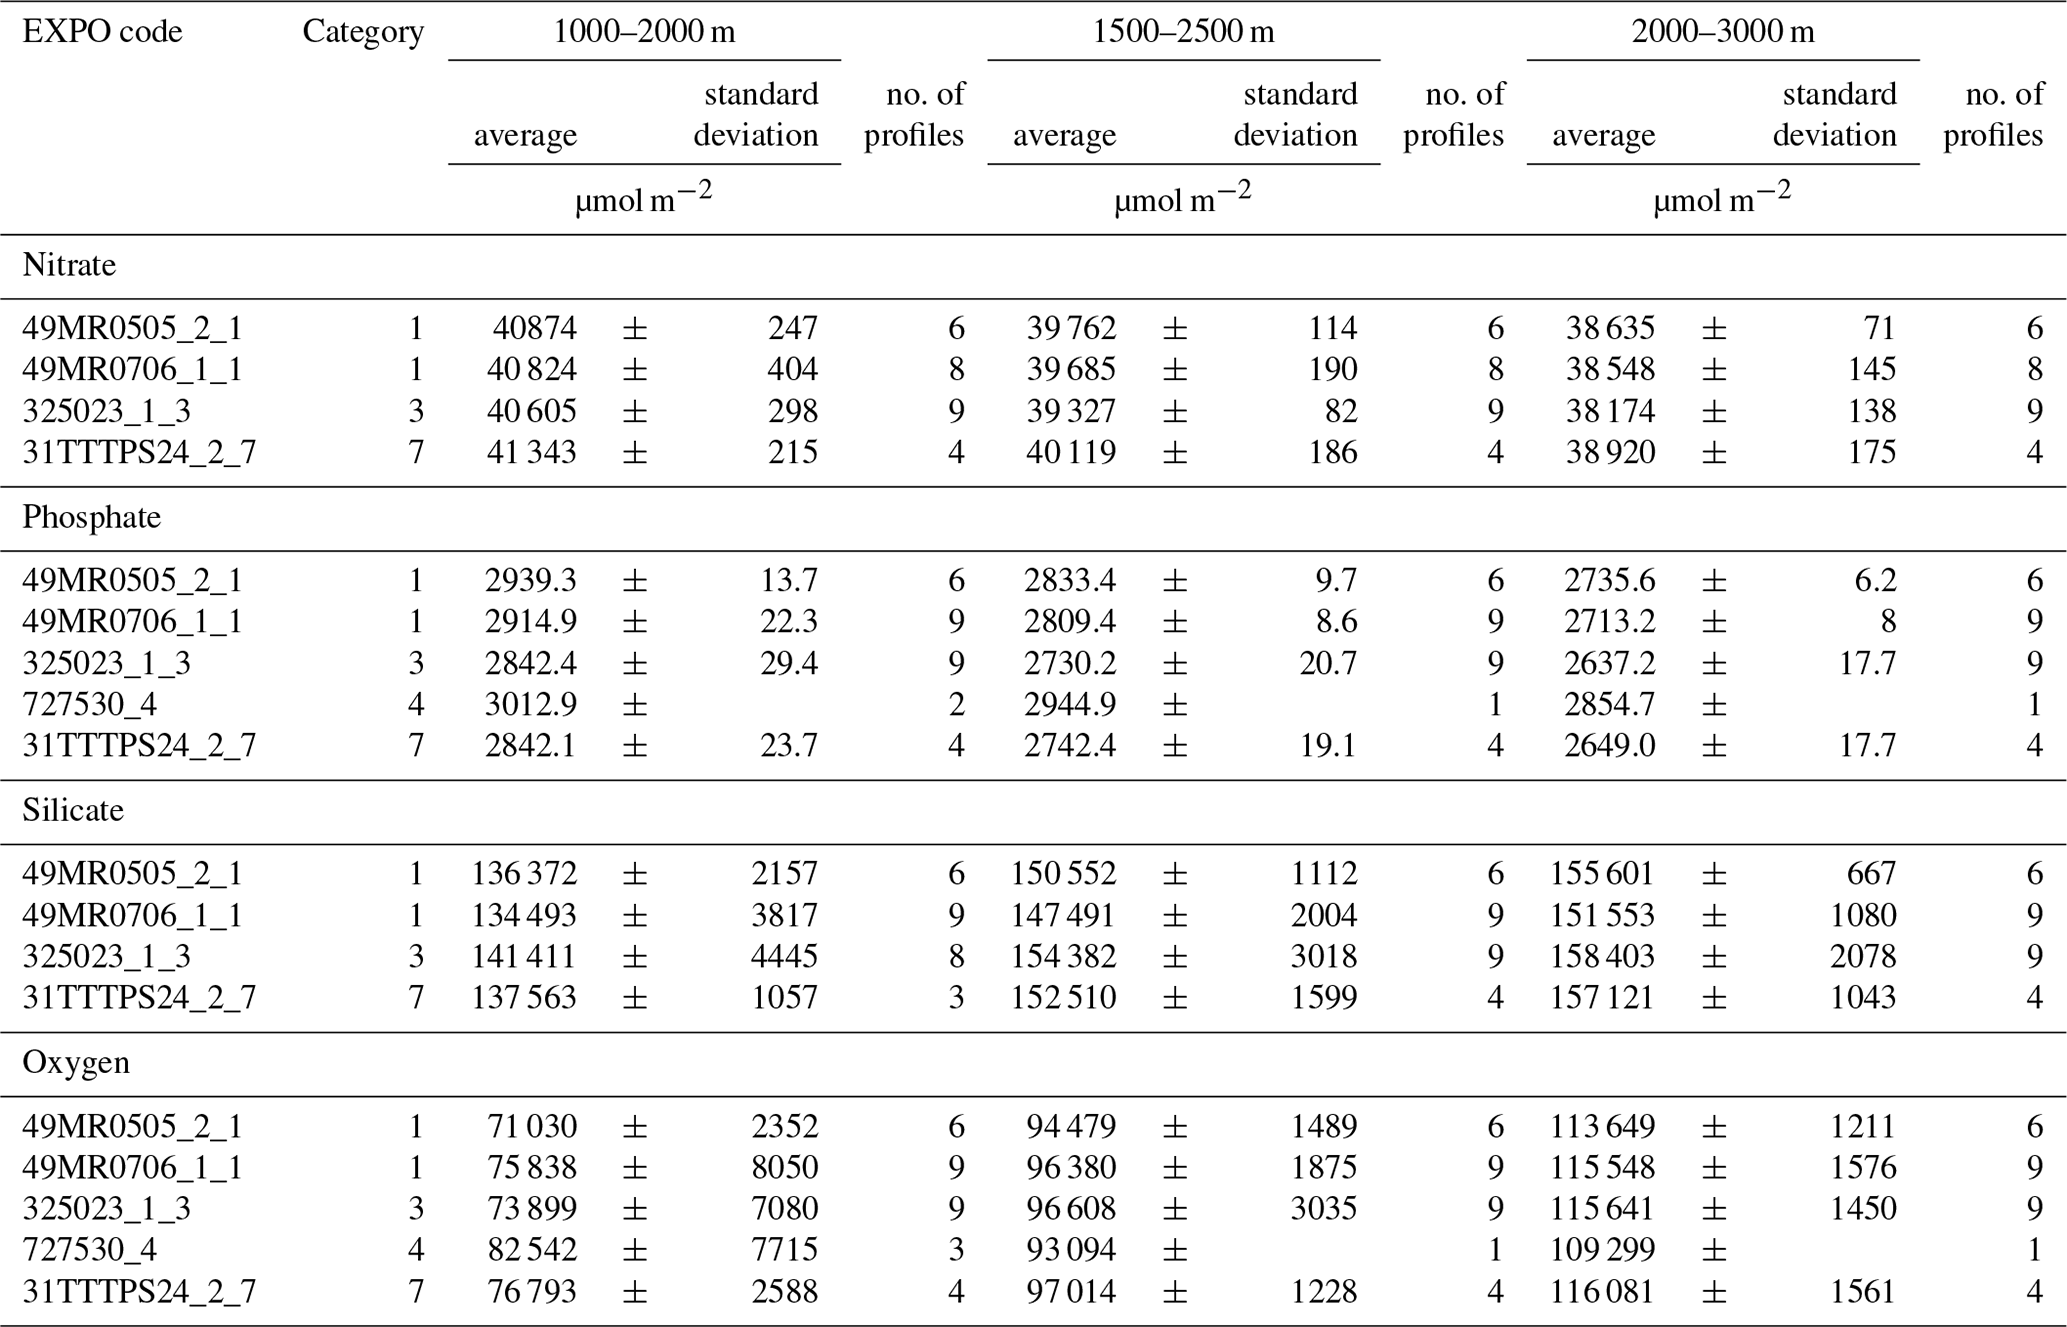
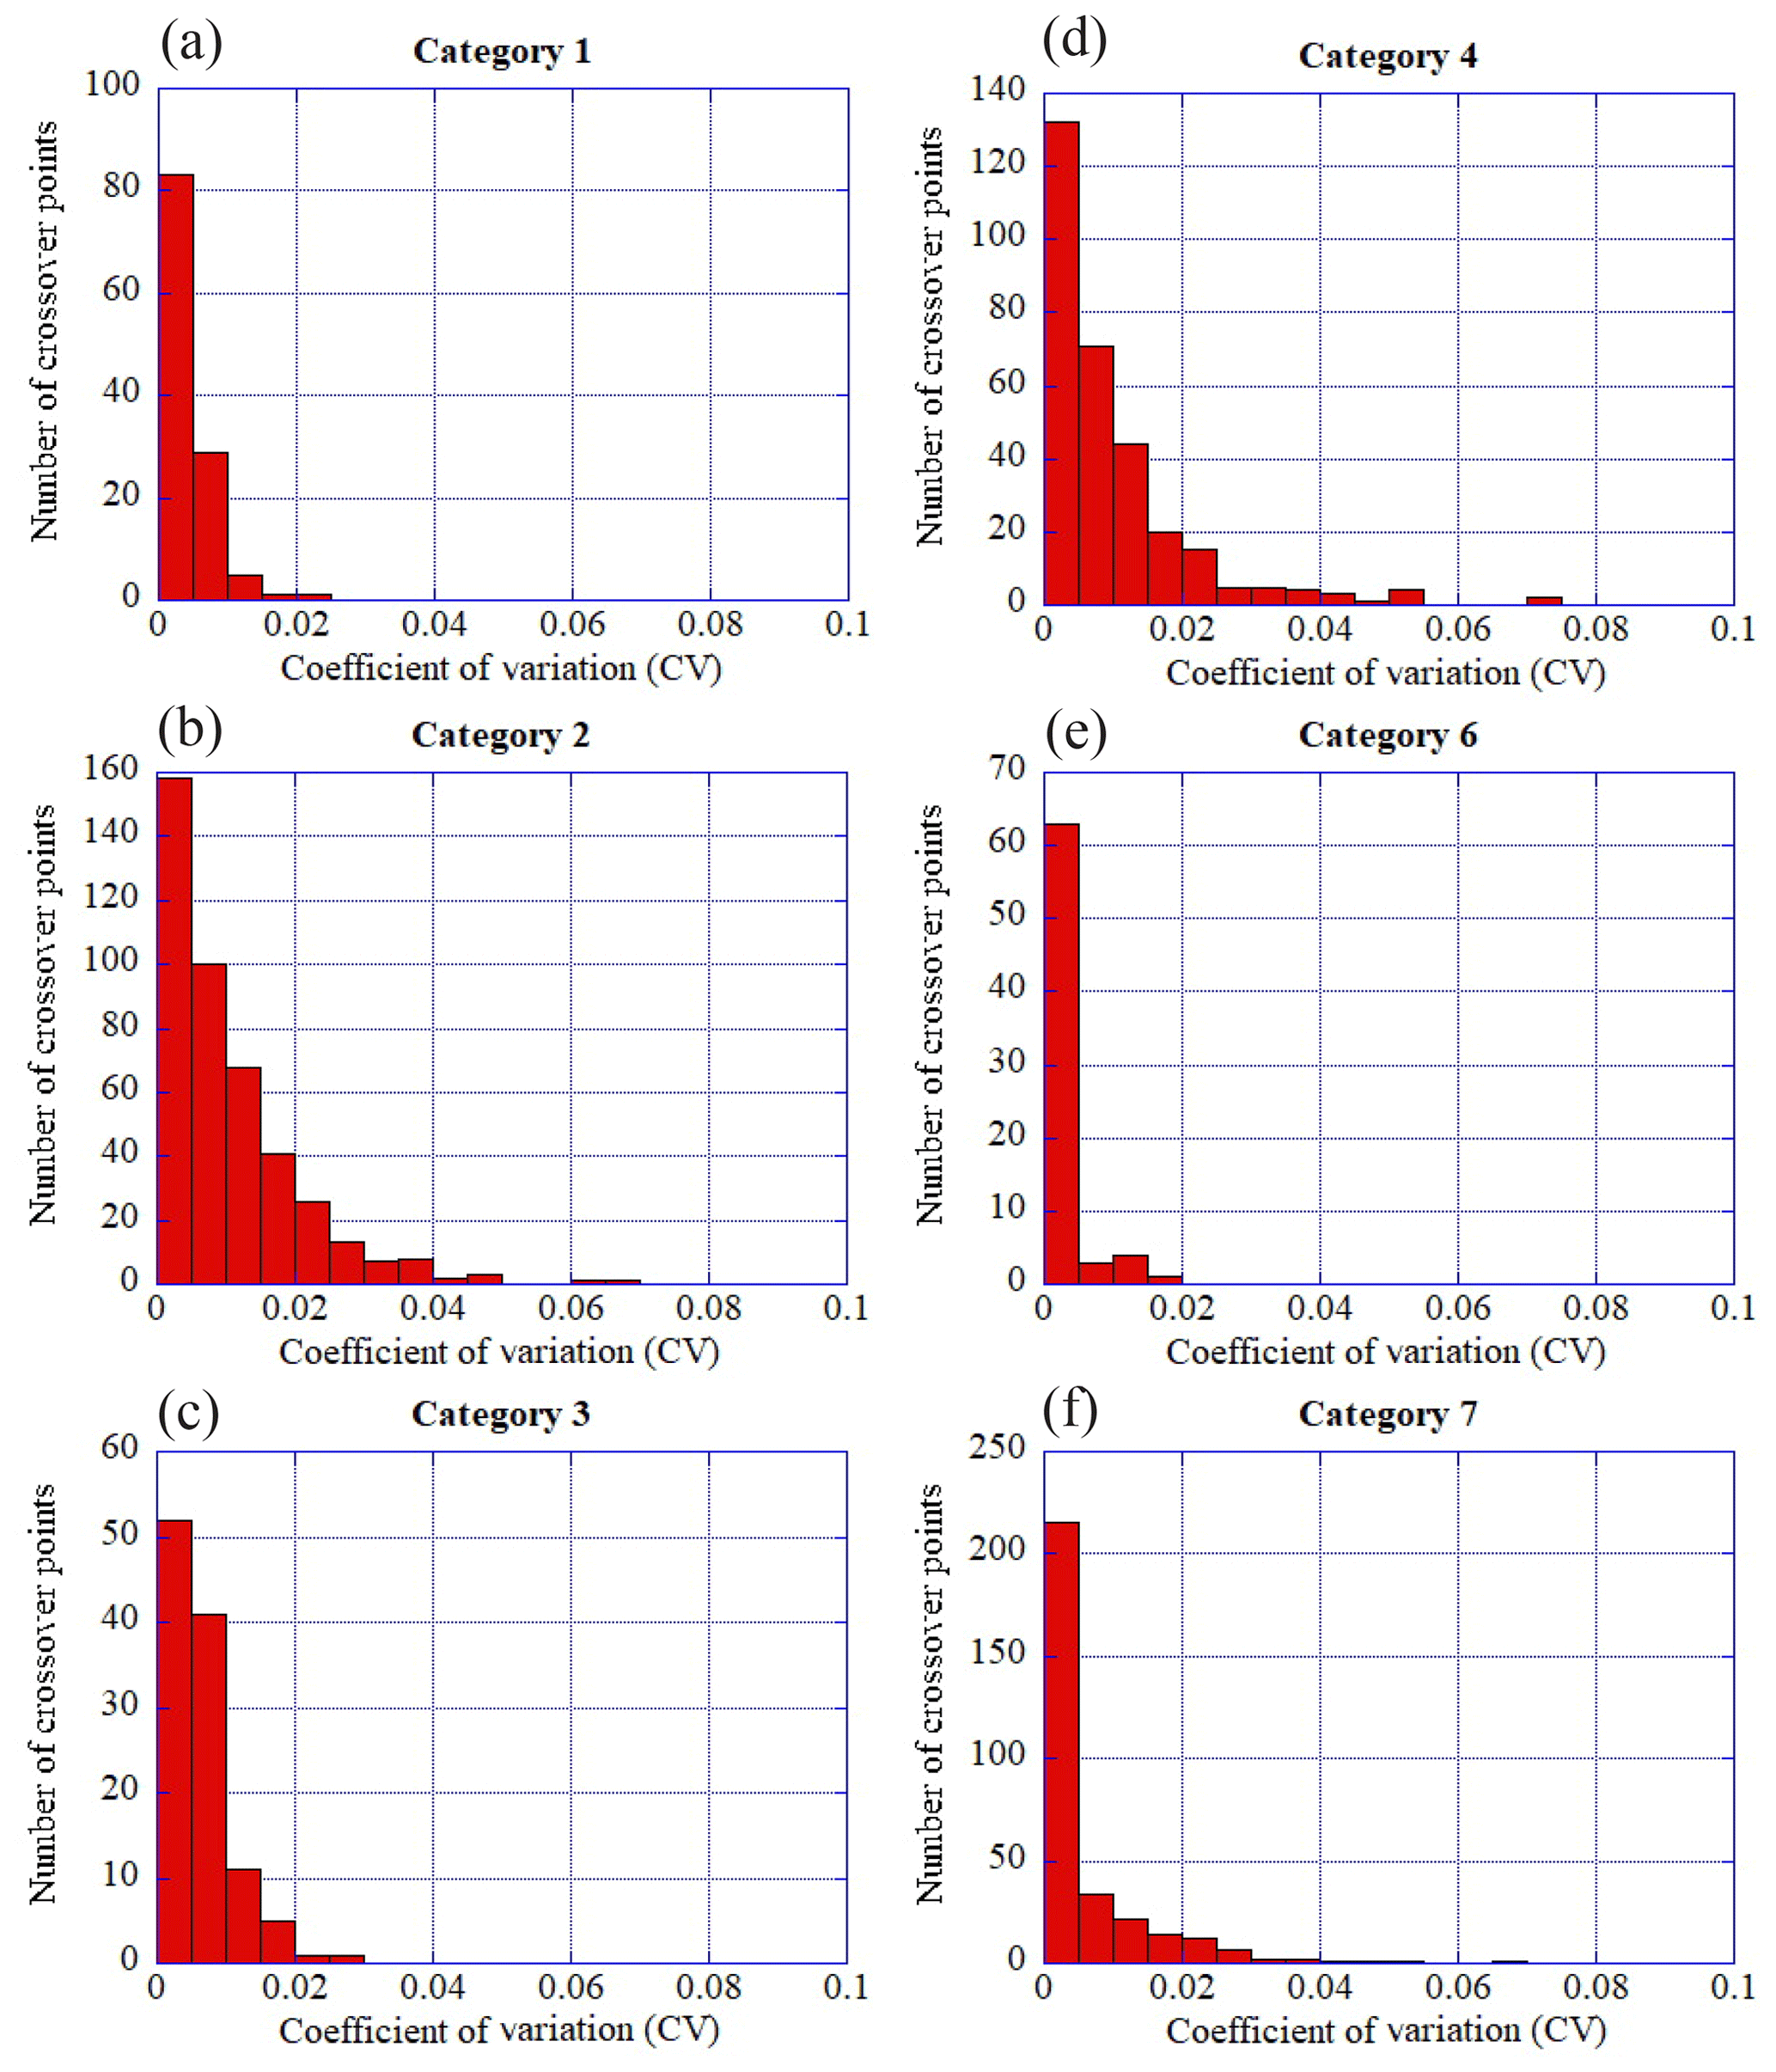
Figure 7Histograms of the coefficient of variation (CV), a ratio of the standard deviations of the integrated values to a mean of the integrated value, within a 250 km radius for nitrate in (a) category 1, (b) category 2, (c) category 3, (d) category 4, (e) category 6, and (f) category 7.
During the time frame of this study from 2003 to 2013, temporal variation of nutrient concentrations within a 250 km radius at crossovers at 1500–2500 m depth was very small, and it could be assumed to be negligible based on comparison at crossovers between/among category 1 curies, as shown in Fig. S1 especially in the Pacific Ocean. Natural variabilities of nutrients within a 250 km radius at 1500–2500 m depth were similar to or smaller than the combined uncertainty of the uncertainty of measurements and station–station variability of measurements within a 250 km radius based on the data in Table 3 and other crossover points. In other words, deep sea water within a 250 km radius at 1500–2500 m was quite homogeneous horizontally, and the variability of nutrient concentrations observed in category 2 and 4 cruises might be due to the lower comparability of the nutrient measurements made during those cruises. The larger mean of the standard deviations of the integrated values for the four parameters at crossovers for the cruises in categories 2–7 might reflect the relatively larger uncertainty which was the combination of the uncertainty of measurements and within-cruise variability (equal to the variability of measurements among several stations within a 250 km radius).

Figure 8A comparison of correction factors for nitrate by this study with uncertainties and by GLODAP V2.


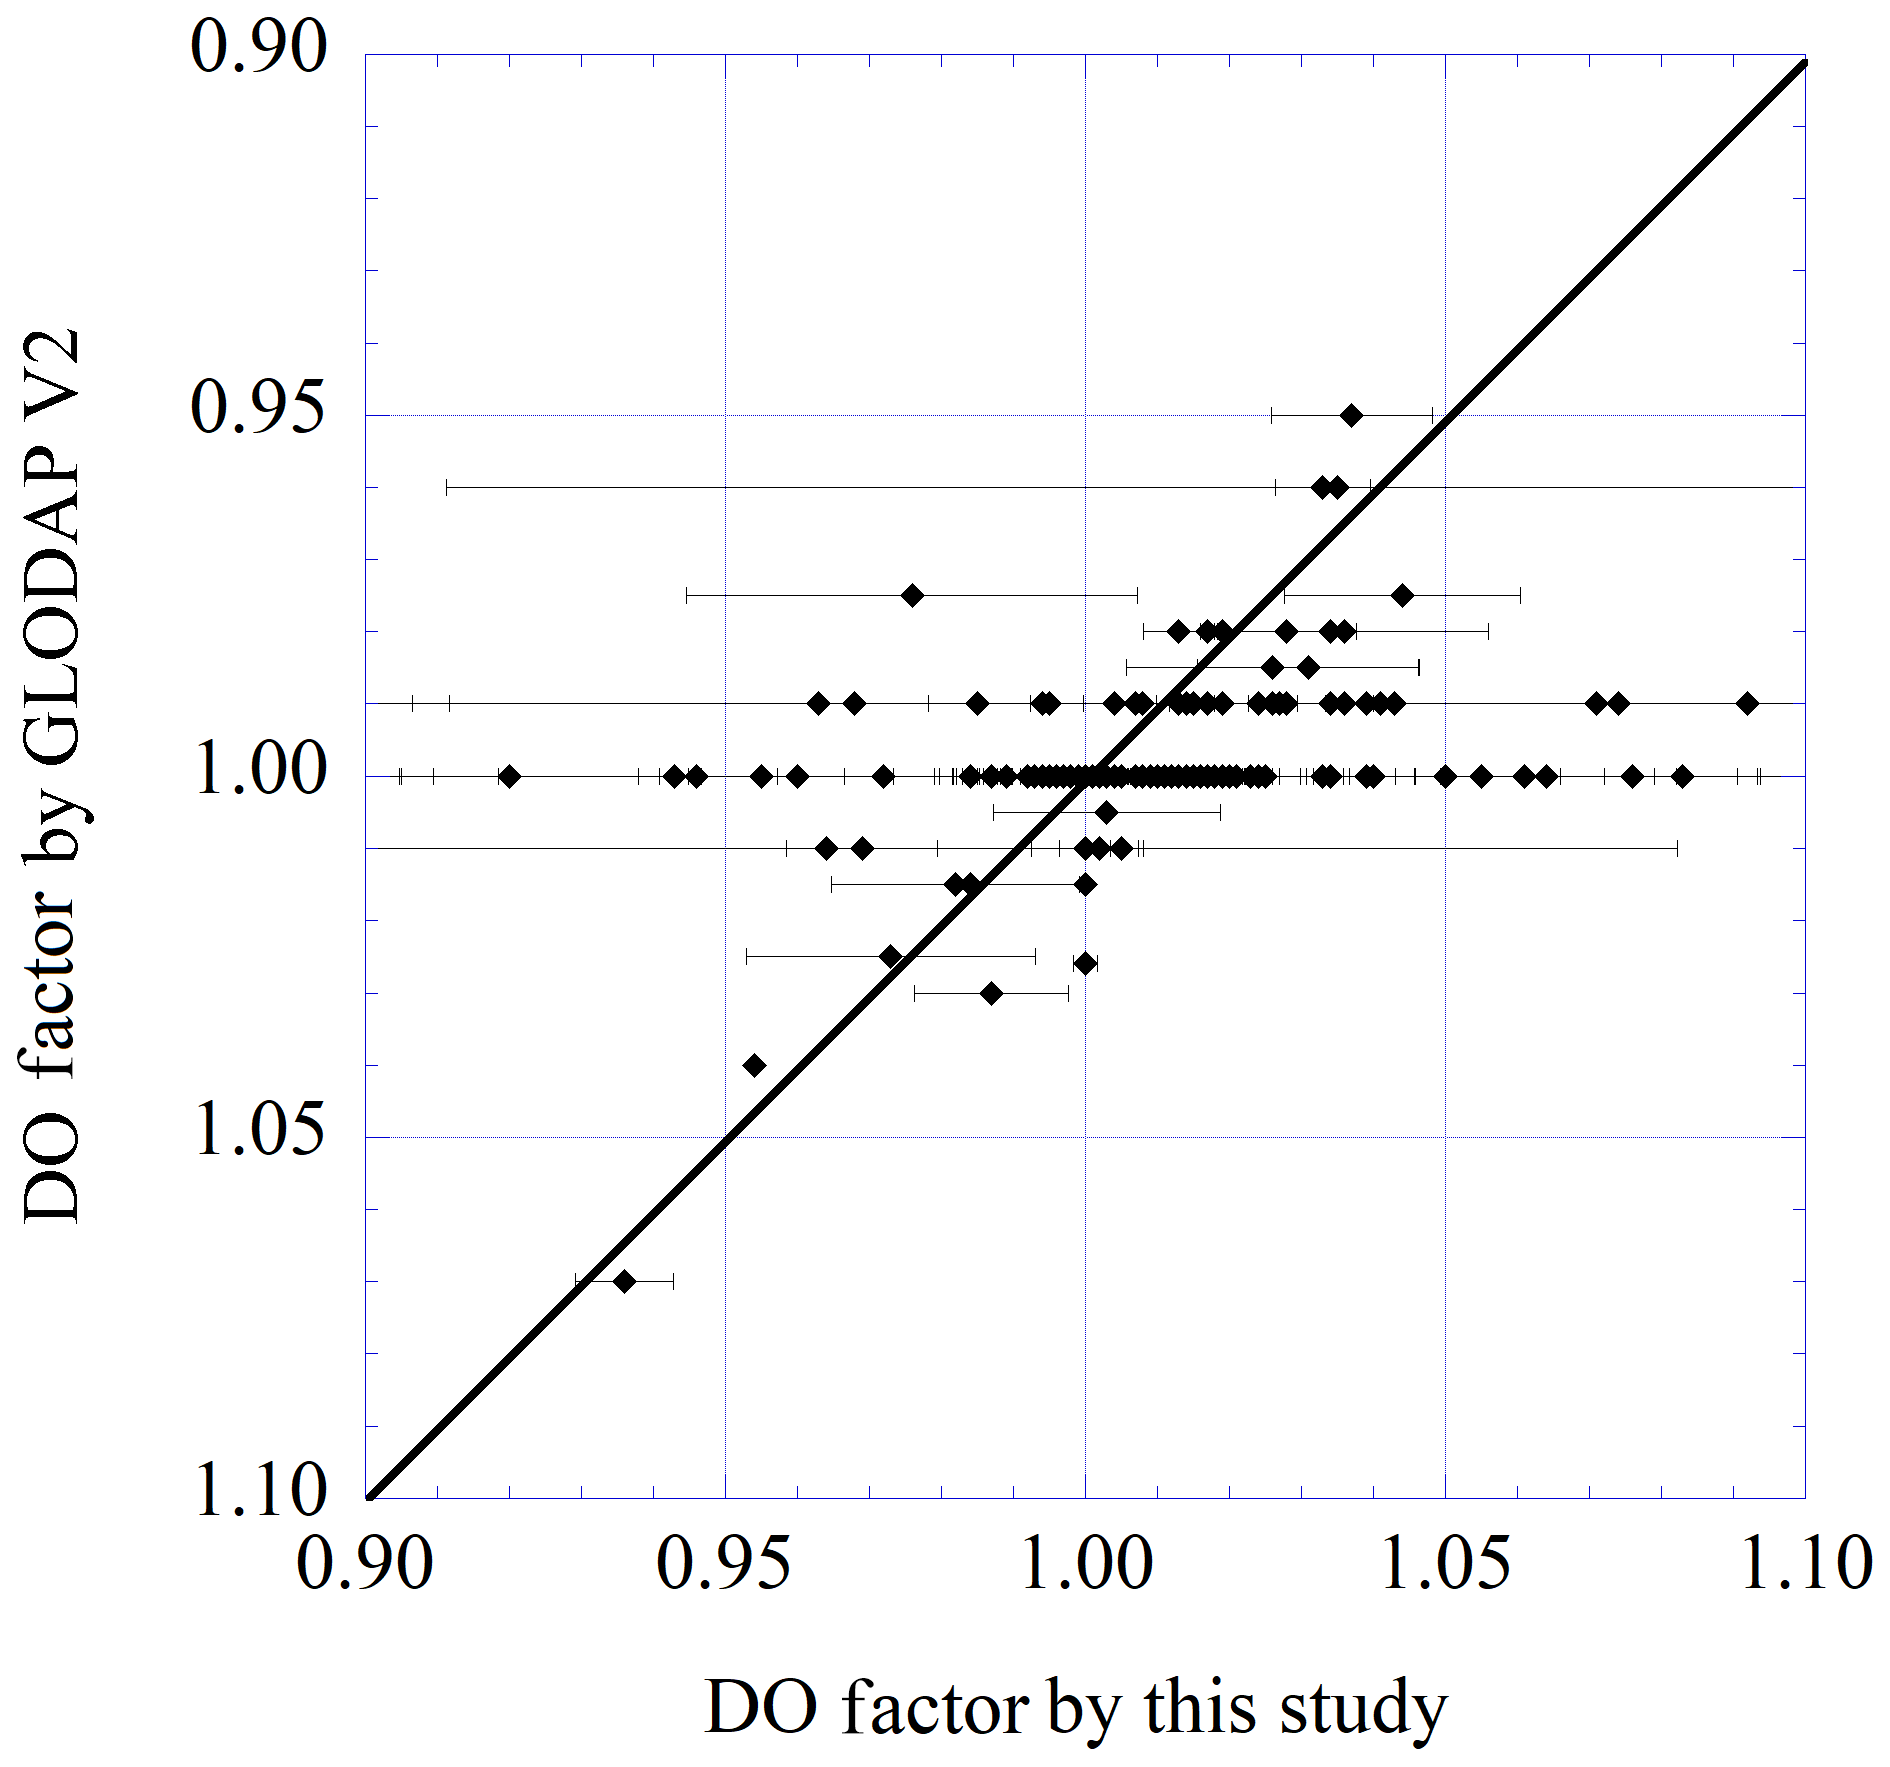
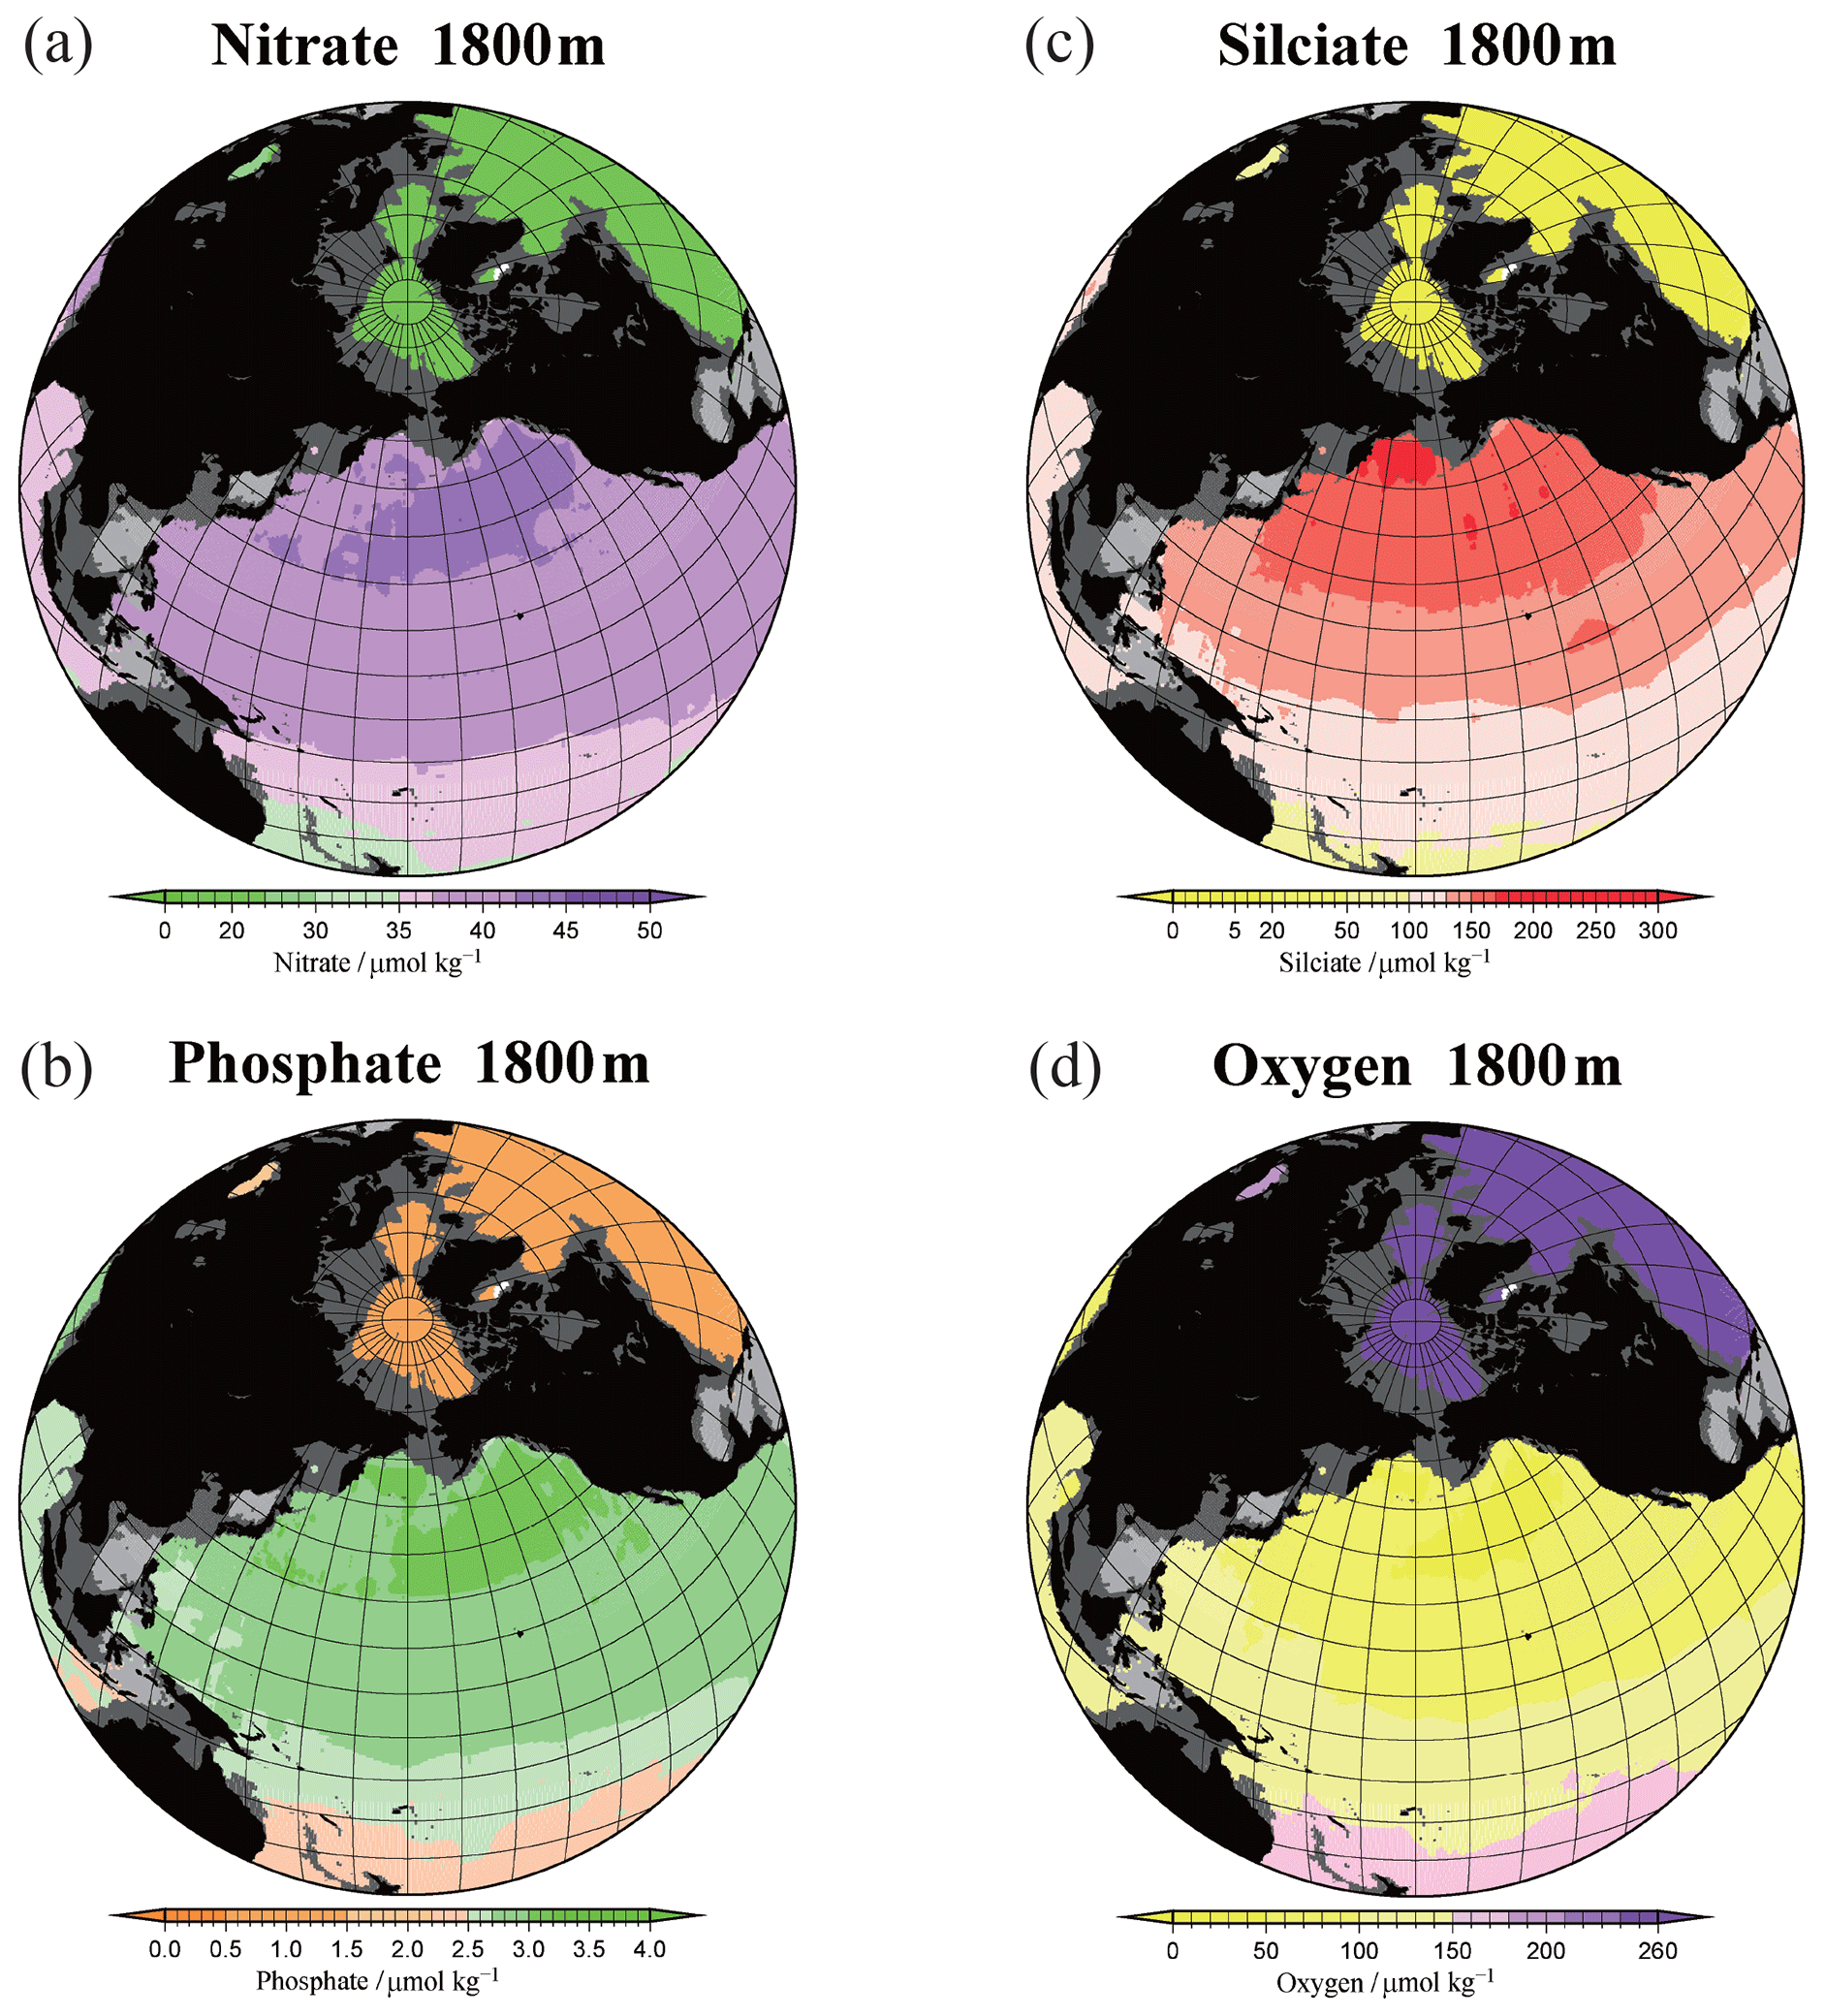
Figure 12(a) Obtained nitrate concentration field at a depth of 1800 m; (b) same as (a) but for phosphate; (c) same as (a) but for silicate; (d) same as (a) but for dissolved oxygen.
When we apply the method adopted in this study, we need to consider uncertainties of measurements and within-cruise variability (equal to the variability of measurements among several stations within a 250 km radius) that might cause the correction factors to be uncertain. The uncertainties of the correction factors were estimated in terms of the CV of the integrated values within crossovers as a first step in the estimation of correction factors. Key cruises included two-thirds of the 243 crossover points (Figs. 1–4). To estimate correction factors at the remaining crossover points, correction factor estimations were done progressively. Based on the wider coverage by the cruises in category 2, those cruises were used as secondary key cruises after correction factors, and their uncertainties were applied to the integrated values. Factors for cruises in categories 3–7 were then estimated, with the exception of several crossover stations. Table S1 in the Supplement shows estimated factors and their uncertainties for all cruises.
Comparisons were made between the factors obtained in this study and in GLODAP v2 (Olsen et al., 2016, 2019). Figures 8–11 show the results. For nitrate and phosphate, the correction factors obtained in this study were in good agreement with those obtained by GLODAP v2 when the correction factors deviated relatively far from 1.00. The implication is that both synthesis work and direct comparisons as done by this study can detect differences between cruises and estimate correction factors correctly when the nutrient concentrations obviously differ from values obtained on nearby cruises. For many GLODAP v2 cruises, factors were assigned a value of 1.00, but it is obvious that direct comparisons resulted in factors that were slightly larger or smaller (Figs. 7–9) because synthesis work could not identify differences among cruises if those differences were not large. Direct comparisons, however, could determine correction factors with uncertainties more precisely. In general, the differences of the correction factors obtained by two methods, synthesis like GLODAP v2 and direct comparison as in this study, for nitrate and phosphate were around +0.02 and −0.04, whereas the differences for silicate were relatively large: ±0.06. For oxygen, the differences were much larger: ±0.10.
2.3 Gridded dataset
Based on the factors obtained in this study, a dataset was created at latitude and longitude intervals of 0.5∘ and on 136 isobaric surfaces at intervals of 50 m. The uncertainties of the nutrient concentrations were about 2 % for nitrate and phosphate and 5 % for silicate and oxygen. This uncertainty was equated to twice the standard deviations of the integrated values for the category 2 cruises. The following steps were used to create the global gridded dataset.
-
Step 1. Profiles of which factor was determined were selected to create the global gridded dataset. Then nutrients and oxygen concentrations were corrected by the factors.
-
Step 2. Nutrient and oxygen profiles were interpolated vertically to 136 levels.
-
Step 3. To have smooth gridded data at 0∘ E (equal to 360∘ E), data obtained in step 1 for 0 to 20∘ E were copied to the 360 to 380∘ E region, and data for 340 to 360∘ E were copied to the −20 to 0∘ E region. Then the surface function of the Generic Mapping Tools, GMT (https://www.soest.hawaii.edu/gmt/, last access: 25 February 2020), was used to map these interpolated data horizontally for each of the 136 layers. North of 65∘ N, the latitude and longitude of the data points were converted to an X–Y surface. Then a surface function of GMT was used for each depth. The gridded data in the X–Y plane were converted to latitude and longitude at 0.5∘ intervals.
A gridded dataset with 136 layers at latitude and longitude intervals of 0.5∘ – the Global Nutrients Dataset 2013 – was then created. Figure 12a–d show the horizontal distributions of nitrate, phosphate, silicate, and oxygen concentrations at a depth of 1800 m in the Pacific Ocean as an example.
To determine the total amount of nitrate, phosphate, silicate, and oxygen in the ocean, the volume and area corresponding to each grid point were calculated using the ETOPO2 topographic and bathymetric dataset (2 min mesh). The concentrations were multiplied by the volume of the obtained grid point to find the number of moles of nitrate, phosphate, silicate, or oxygen at each grid point, and the results were summed for each sea area. In this way the total amounts of nitrate, phosphate, silicate, and oxygen in the ocean were estimated as well as the associated uncertainties.
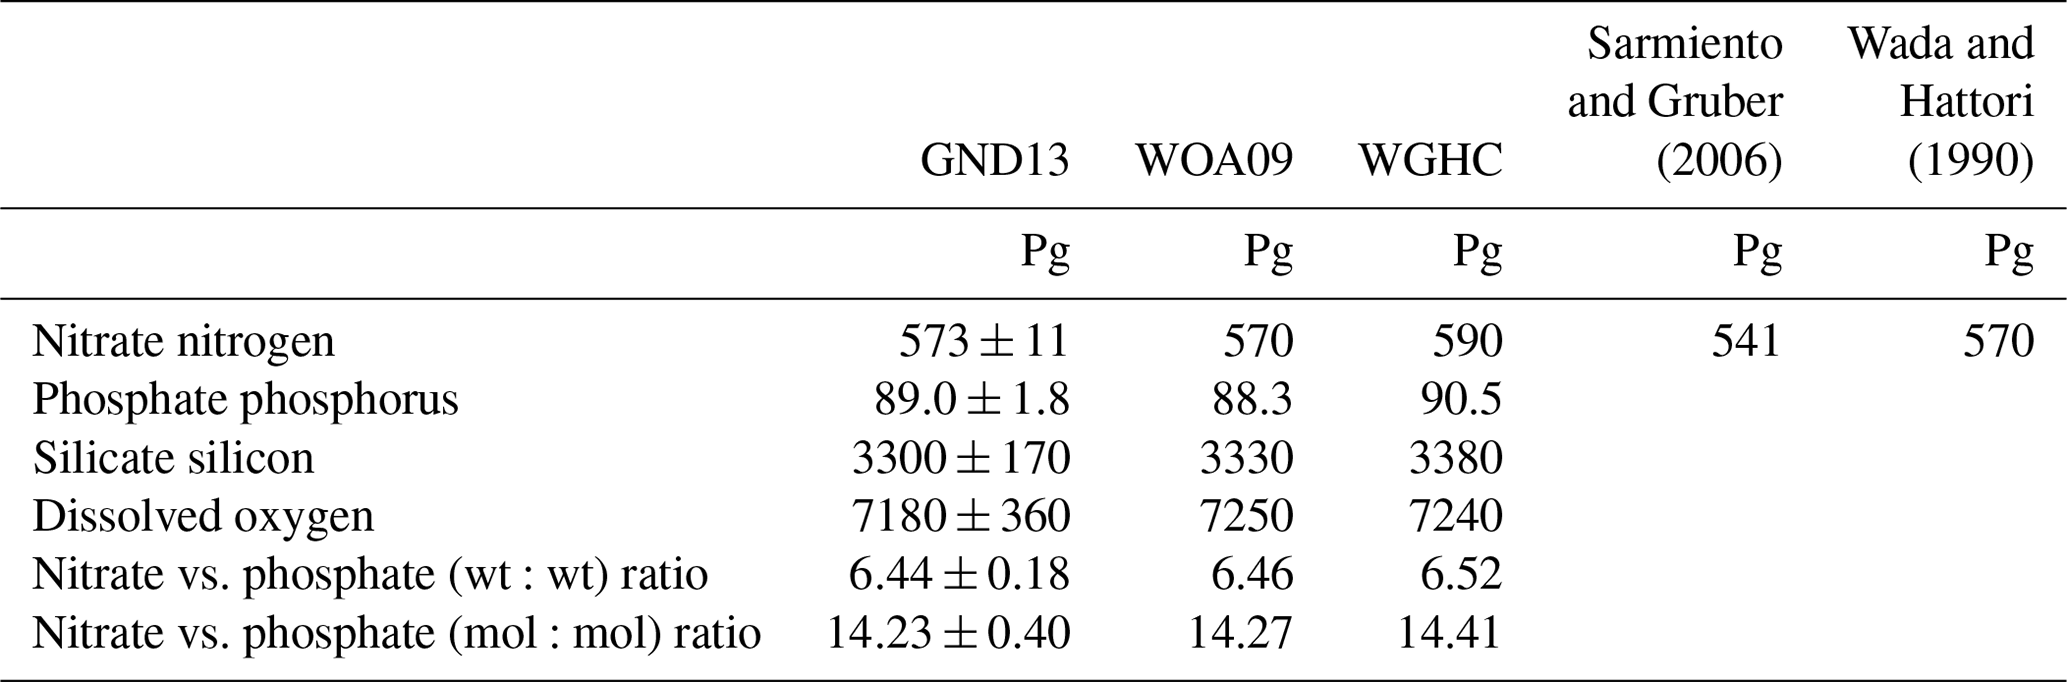
Table 4Total amounts of nitrate nitrogen, phosphate phosphorous, silicate silicon, and dissolved oxygen and nitrate vs. phosphate ratios in the global ocean.
This dataset was designated the Global Nutrients Dataset 2013 (GND13). The GND13 is already available at https://doi.org/10.17596/0000001 (Aoyama, 2017) on the JAMSTEC website. The Fortran source code and ctl script of GrADS are also available at the site. All figures of the horizontal distributions of nitrate, phosphate, silicate, and oxygen are available as supplementary figures of this article.
Table 4 shows the total mass in petagrams of nitrate, phosphate, silicate, and dissolved oxygen in the ocean. Using the same methodology, the total petagrams of nitrate, phosphate, silicate, and dissolved oxygen were also calculated for the WOA09 (Garcia et al., 2010a, b) and WGHC datasets. The total amounts of nitrate, phosphate, silicate, and dissolved oxygen ± uncertainty were 573±11 Pg N, 89.0±1.8 Pg P, 3300±170 Pg Si, and 7180±360 Pg O2, respectively. As can be seen in Table 4, the results of GND13 were consistent within uncertainty with the total amounts calculated from the WOA09 and WGHC climatological concentrations, which had been published previously and were the initial values of various studies based on a current ocean general circulation model. The total amount of nitrate by GND13 was large compared with the literature values: 541 Pg N by Sarmiento and Gruber (2006) and close to 570 Pg N by Wada and Hattori (1990). The medians of the N:P molar ratios at depths >2 km were 14.6 for WOA09 and 14.3 for GND13, and in the latter case the distribution shows high kurtosis (figure not shown). The implication is that the previous lattice point dataset was generated from a dataset with less comparability, whereas the GND13 dataset was generated from a dataset with higher comparability.
The GND13 is available at https://doi.org/10.17596/0000001 (Aoyama, 2017) at the JAMSTEC website (http://www.godac.jamstec.go.jp/catalog/data_catalog/metadataDisp/GND13?lang=en, last access: 25 February 2020).
A global nutrient gridded dataset was created and named GND13. Thirty cruises incorporating reference materials for nutrients in seawater or their equivalent were used. The precision of the nutrient analyses was better than 0.2 %, and comparability between stations was ensured. Nutrient data were collected from all of the hydrographic cruises from which nutrient data were available. Crossover analyses were conducted at 243 crossovers where data from our cruises served as references to determine factors for adjusting nutrient concentrations obtained during other cruises. Dissolved oxygen concentrations were included as an additional parameter in the dataset using the same protocol. Finally, global datasets of nitrate, phosphate, silicate, and dissolved oxygen concentrations were created at 0.5∘ latitude and longitude grid points on 136 isobathymetric layers to a depth of 6.5 km. This dataset will facilitate studies of the behavior of carbon : nitrogen : phosphorus : oxygen stoichiometry in the ocean in the near future.
The supplement related to this article is available online at: https://doi.org/10.5194/essd-12-487-2020-supplement.
MA is the only scientist who created the dataset GND13.
The author declares that there is no conflict of interest.
The author thanks Yukiko Suda and Tomoko Kudo for their work in processing the nutrient data, drawing figures, and making tables.
This research has been supported by the Ministry of Education, Culture, Sports, Science and Technology (MEXT), Japan (grant no. KAKENHI-S-23221003).
This paper was edited by David Carlson and reviewed by Chris Langdon and one anonymous referee.
Akima, H.: A new method of interpolation and smooth curve fitting based on local procedures, J. ACM (JACM), 17, 589–602, 1970.
Aoyama, M.: Global Nutrients Dataset 2013, JAMSTEC, https://doi.org/10.17596/0000001, 2017.
Aoyama, M., Becker, S., Dai, M., Daimon, H., Gordon, L. I., Kasai, H., Kerouel, R., Kress, N., Masten, D., Murata, A., Nagai, N., Ogawa, H., Ota, H., Saito, H., Saito, K., Shimizu, T., Takano, H., Tsuda, A., Yokouchi, K., and Youenou, A.: Recent Comparability of Oceanographic Nutrients Data: Results of a 2003 Intercomparison Exercise Using Reference Materials, Anal. Sci., 23, 1151–1154, https://doi.org/10.2116/analsci.23.1151, 2007.
Aoyama, M., Barwell-Clarke, J., Becker, S., Blum, M., S., B. E., Coverly, S. C., E. Czobik, Dahllof, I., Dai, M. H., Donnell, G. O., Engelke, C., Gong, G. C., Hong, G.-H., Hydes, D. J., Jin, M. M., Kasai, H., Kerouel, R., Kiyomoto, Y., Knockaert, M., Kress, N., Krogslund, K. A., Kumagai, M., Leterme, S., Li, Y., Masuda, S., Miyao, T., Moutin, T., Murata, A., Nagai, N., G.Nausch, Ngirchechol, M. K., Nybakk, A., Ogawa, H., Ooijen, J. v., Ota, H., Pan, J. M., Payne, C., Pierre-Duplessix, O., Pujo-Pay, M., Raabe, T., Saito, K., Sato, K., Schmidt, C., Schuett, M., Shammon, T. M., Sun, J., Tanhua, T., White, L., Woodward, E. M. S., Worsfold, P., Yeats, P., Yoshimura, T., A.Youenou, and Zhang, J. Z.: 2006 Inter-laboratory Comparison Study for Reference Material for Nutrients in Seawater58, 2008.
Aoyama, M., Carol, A., Janet, B.-C., Baurand, F., Becker, S., Blum, M., Coverly, S. C., Czobik, E., d'Amico, F., Dahllof, I., Dai, M., Dobson, J., Pierre-Duplessix, O., Duval, M., Engelke, C., Gong, G.-C., Grosso, O., Hirayama, A., Inoue, H., Ishida, Y., Hydes, D. J., Kasai, H., Kerouel, R., Knockaert, M., Kress, N., Krogslund, K. A., Kumagai, M., Leterme, S. C., Mahaffey, C., Mitsuda, H., Morin, P., Moutin, T., Munaron, D., Murata, A., Nausch, G., Ogawa, H., Ooijen, J. v., Pan, J., Paradis, G., Payne, C., Prove, G., Raimbaul, P., Rose, M., Saito, K., Saito, H., Sato, K., Schmidt, C., Schutt, M., Shammon, T. M., Olafsdottir, S., Sun, J., Tanhua, T., Weigelt-Krenz, S., White, L., Woodward, E. M. S., Worsfold, P., Yoshimura, T., Youenou, A., and Zhang, J.-Z.: 2008 Inter-laboratory Comparison Study of a Reference Material for Nutrients in Seawater, the Meteorological Research Institute60, 2010.
Aoyama, M., Bakker, K., Daniel, A., Kamata, M., Kozyr, A., Becker, S., Dickson, A. G., Hydes, D. J., Katagiri, M., Mitsuda, H., Sato, K., Uchida, H., Yoshimura, T., Murata, A., Schuller, D., and Woodward, E. M. S.: 2012 UCSD/SIO SGONS Meeting Report. The Joint IOC-ICES Study Group on Nutrient Standards (SGONS), Meteorological Research Institute, Tsukuba, Japan, 2013.
Aoyama, M., Abad, M., Anstey, C., P, M. A., Bakir, A., Becker, S., Bell, S., Berdalet, E., Blum, M., Briggs, R., Caradec, F., Cariou, T., Church, M., Coppola, L., Crump, M., Curless, S., Dai, M., Daniel, A., Davis, C., Braga, E. d. S., Solis, M. E., Ekern, L., Faber, D., Fraser, T., Gundersen, K., Jacobsen, S., Knockaert, M., Komada, T., Kralj, M., Kramer, R., Kress, N., Lainela, S., Ledesma, J., Li, X., Lim, J.-H., Lohmann, M., Lønborg, C., Ludwichowski, K.-U., Mahaffey, C., Malien, F., Margiotta, F., McCormack, T., Murillo, I., Naik, H., Nausch, G., Ólafsdóttir, S. R., Ooijen, J. v., Paranhos, R., Payne, C., Pierre-Duplessix, O., Prove, G., Rabiller, E., Raimbault, P., Reed, L., Rees, C., Rho, T., Roman, R., Woodward, E. M. S., Sun, J., Szymczycha, B., Takatani, S., Taylor, A., Thamer, P., Torres-Valdés, S., Trahanovsky, K., Waldron, H., Walsham, P., Wang, L., Wang, T., White, L., Yoshimura, T., and Zhang, J.-Z.: IOCCP-JAMSTEC 2015 Inter-laboratory Calibration Exercise of a Certified Reference Material for Nutrients in Seawater JAMSTEC, Yokosuka, Japan, 2016.
Aoyama, M., Abad, M., Aguilar-Islas, A., P, M. A., Azetsu-Scott, K., Bakir, A., Becker, S., Benoit-Cattin-Breton, A., Berdalet, E., Björkman, K., Blum, M., Braga, E. d. S., Florian Caradec, T. C., Chiozzini, V. G., Collin, K., Coppola, L., Crump, M., Dai, M., Daniel, A., Davis, C., Solis, M. E., Edelvang, K., Faber, D., Fidel, R., Fonnes, L. L., Frank, J., Frew, P., Funkey, C., Gallia, R., Giani, M., Gkritzalis, T., Grage, A., Greenan, B., Gundersen, K., Hashihama, F., Ibar, V. F. C., Jung, J., Kang, S. H., Karl, D., Kasai, H., Kerrigan, L. A., Kiyomoto, Y., Knockaert, M., Kodama, T., Koo, J.-H., Kralj, M., Kramer, R., Kress, N., Lainela, S., Ledesma, J., Lewandowska, J., López, M. d. C. Á., García, P. L., Ludwichowski, K.-U., Mahaffey, C., Malien, F., Margiotta, F., Márquez, A., Mawji, E. W., McCormack, T., McGrath, T., Merrer, Y. L., Møgster, J. S., Nagai, N., Naik, H., Normandeau, C., Ogawa, H., Ólafsdóttir, S. R., Ooijen, J. v., Paranhos, R., Park, M.-O., Parmentier, K., Passarelli, A., Payne, C., Pierre-Duplessix, O., Povazhnyi, V., Quesnel, S.-A., Raimbault, P., Rees, C., Rember, R., Rho, T. K., Ringuette, M., Riquier, E. D., Rodriguez, A., Roman, R. E., Rosero, C., Woodward, E. M. S., Saito, S., Schuller, D., Segal, Y., Silverman, J., Sørensen, D., Stedmon, C. A., Stinchcombe, M., Sun, J., Thamer, P., Urbini, L., Wallace, D., Walsham, P., Wang, L., Waniek, J., Yamamoto, H., Yoshimura, T., and Zhang, J.-Z.: IOCCP-JAMSTEC 2018 Inter-laboratory Calibration Exercise of a Certified Reference Material for Nutrients in Seawater, JAMSTEC, Yokosuka, Japan, 2018.
Bindoff, N. L., Willebrand, J., Artale, V., Cazenave, A., Gregory, J. M., Gulev, S., Hanawa, K., Le Quere Corinne, Levitus, S., Nojiri, Y., Shum, C. K., Talley, L. D., Unnikrishnan, A. S., Josey, S. A., Tamisiea, M., Tsimplis, M., and Woodworth, P.: Observations: Oceanic Climate Change and Sea Level, in: Climate Change 2007: The Physical Science Basis, Contribution of Working Group I to the Fourth Assessment Report of the Intergovernmental Panel on Climate Change, edited by: Solomon, S., Qin, D., Manning, M., Chen, Z., Marquis, M., Averyt, K. B., Tignor, M., Miller, and H. L., Cambridge University Press, 385–433, 2007.
Carpenter, J. H.: THE ACCURACY OF THE WINKLER METHOD FOR DISSOLVED OXYGEN ANALYSIS 1, Limnol. Oceanogr., 10, 135–140, 1965.
Garcia, H. E., Locarnini, R. A., Boyer, T. P., Antonov, J. I., Baranova, O. K., Zweng, M. M., and Johnson, D. R.: World Ocean Atlas 2009, Volume 3: Dissolved Oxygen, Apparent Oxygen Utilization, and Oxygen Saturation, edited by: Levitus, S., Ed. NOAA Atlas NESDIS 70, U.S. Government Printing Office, Washington, D.C., 344 pp., 2010a.
Garcia, H. E., Locarnini, R. A., Boyer, T. P., Antonov, J. I., Zweng, M. M., Baranova, O. K., and Johnson, D. R.: World Ocean Atlas 2009, Volume 4: Nutrients (phosphate, nitrate, silicate), edited by: Levitus, S., Ed. NOAA Atlas NESDIS 71, U.S. Government Printing Office, Washington, D.C., 398 pp, 2010b.
Gouretski, V. and Koltermann, K. P.: WOCE global hydrographic climatology, Berichte des BSH, 35, 1–52, 2004.
Joyce, T., Corry, C., and Stalcup, M.: Requirements for WOCE hydrographic programme data reporting, WHP Office Report WHPO, 90–91, 1994.
Key, R. M., Tanhua, T., Olsen, A., Hoppema, M., Jutterström, S., Schirnick, C., van Heuven, S., Kozyr, A., Lin, X., Velo, A., Wallace, D. W. R., and Mintrop, L.: The CARINA data synthesis project: introduction and overview, Earth Syst. Sci. Data, 2, 105–121, https://doi.org/10.5194/essd-2-105-2010, 2010.
Kouketsu, S., Fukasawa, M., Kaneko, I., Kawano, T., Uchida, H., Doi, T., Aoyama, M., and Murakami, K.: Changes in water properties and transports along 24 N in the North Pacific between 1985 and 2005, J. Geophys. Res.-Oceans, 114, C01008, https://doi.org/10.1029/2008JC004778, 2009.
Levitus, S., Antonov, J. I., Boyer, T. P., Locarnini, R. A., Garcia, H. E., and Mishonov, A. V.: Global ocean heat content 1955–2008 in light of recently revealed instrumentation problems, Geophys. Res. Lett., 36, L07608, https://doi.org/10.1029/2008GL037155, 2009.
Levitus, S., Antonov, J. I., Boyer, T. P., Baranova, O. K., Garcia, H. E., Locarnini, R. A., Mishonov, A. V., Reagan, J. R., Seidov, D., Yarosh, E. S., and Zweng, M. M.: World ocean heat content and thermosteric sea level change (0–2000 m), 1955–2010, Geophys. Res. Lett., 39, L10603, https://doi.org/10.1029/2012GL051106, 2012.
Olsen, A., Key, R. M., van Heuven, S., Lauvset, S. K., Velo, A., Lin, X., Schirnick, C., Kozyr, A., Tanhua, T., Hoppema, M., Jutterström, S., Steinfeldt, R., Jeansson, E., Ishii, M., Pérez, F. F., and Suzuki, T.: The Global Ocean Data Analysis Project version 2 (GLODAPv2) – an internally consistent data product for the world ocean, Earth Syst. Sci. Data, 8, 297–323, https://doi.org/10.5194/essd-8-297-2016, 2016.
Olsen, A., Lange, N., Key, R., Tanhua, T., Álvarez, M., Becker, S., Bittig, H., Carter, B., Da Cunha, L. C., and Feely, R.: GLODAPv2. 2019-an update of GLODAPv2, 2019.
Rhein, M., Rintoul, S. R., Aoki, S., Campos, E., Chambers, D., Feely, R. A., Gulev, S., Johnson, G. C., Josey, S. A., Kostianoy, A., Mauritzen, C., Roemmich, D., and Talley, L. D.: Observations: Ocean, in: Climate Change 2013: The Physical Science Basis. Contribution of Working Group I to the Fifth Assessment Report of the Intergovernmental Panel on Climate Change, edited by: Stocker, T. F., Qin, D., Plattner, G.-K., Tignor, M., Allen, S. K., Boschung, J., Nauels, A., Xia, Y., Bex, V., and Midgley, P. M., Cambridge, GB. Cambridge University Press, 255–316, 2013.
Sarmiento, J. L. and Gruber, N.: Ocean Biogeochemical Dynamics, p. 503 , Princeton University Press, ISBN 0691017077, 2006.
Sato, K., Aoyama, M., and Becker, S.: Reference materials for nutrients in seawater as calibration standard solution to keep comparability for several cruises in the world ocean in 2000s, in:Comparability of nutrients in the world’s ocean, edited by: Aoyama, M., Dickson, A., Hydes, D. J., Murata, A., Oh, J. R., Roose, P., and Woodward, E. M. S., Tsukuba, Mother Tank Publication, 43–56, 2010.
Stendardo, I. and Gruber, N.: Oxygen trends over five decades in the North Atlantic, J. Geophys. Res.-Oceans, 117, C11004, https://doi.org/10.1029/2012JC007909, 2012.
Suzuki, T., Ishii, M., Aoyama, M., Christian, J. R., Enyo, K., Kawano, T., Key, R. M., Kosugi, N., Kozyr, A., and Miller, L. A.: PACIFICA data synthesis project, ORNL/CDIAC-159, NDP-092, Carbon Dioxide Information Analysis Center, Oak Ridge National Laboratory, US Department of Energy, Oak Ridge, TN, USA, 2013.
Tanhua, T., Brown, P. J., and Key, R. M.: CARINA: nutrient data in the Atlantic Ocean, Earth Syst. Sci. Data, 1, 7–24, https://doi.org/10.5194/essd-1-7-2009, 2009.
Wada, E. and Hattori, A.: Nitrogen in the sea: forms, abundance, and rate processes, CRC press, 1990.
Wanninkhof, R., Doney, S. C., Bullister, J. L., Levine, N. M., Warner, M., and Gruber, N.: Detecting anthropogenic CO2 changes in the interior Atlantic Ocean between 1989 and 2005, J. Geophys. Res.-Oceans, 115, C11028, https://doi.org/10.1029/2010JC006251, 2010.