the Creative Commons Attribution 4.0 License.
the Creative Commons Attribution 4.0 License.
 | 26 Mar 2020
Laboratory, field, mast-borne and airborne spectral reflectance measurements of boreal landscape during spring
Henna-Reetta Hannula
Kirsikka Heinilä
Kristin Böttcher
Olli-Pekka Mattila
Miia Salminen
Jouni Pulliainen
We publish and describe a surface spectral reflectance data record of seasonal snow (dry, wet, shadowed), forest ground (lichen, moss) and forest canopy (spruce and pine, branches) constituting the main elements of the boreal landscape. The reflectances are measured with spectro(radio)meters covering the wavelengths from visible (VIS) to short-wave infrared (SWIR) (350 to 2500 nm). In this paper, we describe the instruments used and how the spectral observations at different scales along with the concurrent in situ reference data have been collected, processed and archived. Information on the quality of the data and factors causing uncertainty are discussed. The main experimental site is located in the Sodankylä Arctic Space Centre in northern Finland (67.37∘ N, 26.63∘ E; 179 m a.s.l) and the surrounding region. The collection includes highly controlled snow and conifer branch laboratory spectral measurements, portable field spectroradiometer observations of snow and snow-free ground at different locations, and continuous mast-borne reflectance time series data of a pine forest and forest opening. In addition to the surface level spectral reflectance, data from airborne imaging spectrometer campaigns over the Sodankylä boreal forest and Saariselkä fell region at selected spectral bands are included in the collection. All measurements of the data record correspond to a typical polar-orbiting satellite observation event in the high-latitude spring season regarding their Sun or illumination source (calibrated lamp) zenith angle and close-to-nadir instrument viewing angle. For all measurement geometries, observations are given in surface reflectance quantity corresponding to the typical representation of a satellite observation quantity to facilitate their comparison with other data sources. The openly accessible spectral reflectance data at multiple scales are suitable to climate and hydrological research and remote sensing model validation and development. To facilitate easy access to the data record the four datasets described here are deposited in a permanent data repository (http://www.zenodo.org/communities/boreal_reflectances/) (Hannula et al., 2019). Each dataset of a distinct scale has its own unique DOI – laboratory: https://doi.org/10.5281/zenodo.3580078 (Hannula and Heinilä, 2018a); field: https://doi.org/10.5281/zenodo.3580825 (Heinilä et al., 2019a); mast-borne: https://doi.org/10.5281/zenodo.3580096 (Hannula and Heinilä, 2018b); and airborne: https://doi.org/10.5281/zenodo.3580451 (Heinilä, 2019a) and https://doi.org/10.5281/zenodo.3580419 (Heinilä, 2019b).


High-latitude regions are facing fundamental and rapid changes in climate and hydrology due to raising mean annual temperatures (ACIA, 2005; AMAP, 2017). The climate-warming-induced changes in snow cover appearance, shifting of the vegetation zones and distribution of animal species, have complex impacts on ecosystems and people (Brown and Mote, 2009; Callaghan et al., 2011). Monitoring of the seasonal snow cover of the spatially vast subarctic and boreal zone benefits from remote sensing for various scientific and socio-economic uses, e.g. related to the assessment of carbon balance in the boreal and subarctic forests (Böttcher et al., 2014; Pan et al., 2011; Pulliainen et al., 2017). Remote sensing has developed over decades into an increasingly reliable and cost-effective way to estimate the decadal and annual changes in the Northern Hemisphere terrestrial snow cover (Brown and Robinson, 2011; Choi et al., 2010; Derksen and Brown, 2012; Dietz et al., 2012; Frei et al., 2012; Hori et al., 2017). The development of reliable methods to map snow extent, including the fractional snow cover (FSC), remains a challenging task especially due to the disturbing effect of forest canopy and heterogeneous land cover. Several approaches have been used to estimate the FSC from satellite imagery (Klein et al., 1998; Hall and Riggs, 2007; Dozier et al., 2009; Nolin, 2010; Dietz et al., 2012; Frei et al., 2012; Metsämäki et al., 2015). These methods, such as the semi-empirical-reflectance-model-based method SCAmod (Metsämäki et al., 2005, 2012), used for the detection of snow cover in forested areas, have benefited from accurate reference spectral measurements enabling better characterization of the model parameters (i.e. spectral endmembers). Spectral endmember refers to a “pure” reflectance spectra of a distinct surface type such as a distinct type of snow or tree species.
Field spectroscopy techniques have evolved into a widely used tool to understand the effects of the measured target on the propagation of electromagnetic radiation. This provides observations under more controlled conditions compared to measurements from satellite platforms (Aoki et al., 2000; Bänninger et al., 2008; Horton and Jamieson, 2017; Milton et al., 2009; Painter et al., 2013; Peltoniemi et al., 2005; Pirazzini et al., 2015; Tanikawa et al., 2014). In order to establish improved optical snow mapping methods for forested areas, detailed surveys of satellite scene reflectance contributors are required, as the relatively large satellite footprint may contain both fractional snow and forest cover. Additionally, snow characteristics may vary according to land cover type, e.g. between forests and open areas. Using continuous spectral signatures, i.e. from instruments with very narrow bandwidths, various land cover constituting elements can be spectrally characterized and their contribution to satellite scene reflectance then identified. In boreal landscape, reference spectroscopy measurements are valuable in defining the spectral endmembers of the satellite scene reflectance, namely snow, snow-free terrain after melting and forest cover. These data can be obtained from controlled-condition laboratory spectroradiometer observations, portable field spectroscopy campaigns, mast-borne spectral monitoring and aerial surveys. These approaches provide observations at different scales. Laboratory measurements can generate detailed information on the spectral signature of a trunk, branch or leaf of a single tree, whereas using portable field spectroscopy, several land cover categories or shrub layer vegetation types can be spectrally characterized. Mast-borne monitoring of scene reflectance facilitates time series production and the study of the seasonal behaviour of fractional snow- and forest-covered scene reflectance. Aerial surveys are useful in extending the observations to a larger variety of landscape properties in particular during the melting season and still maintaining the advantage of high spatial resolution.
To fully benefit from the increasing amount of spectral reflectance data records available in various archives and libraries, it is essential to ensure that the data are of consistent quality and accompanied with information on the sources of uncertainties, such as the variations in the incoming radiation during the measurements or unideal characteristics of the measurement setup or the used reference calibration target. However, in the case of field measurements in the natural environment, it is difficult to provide quantitative uncertainty information due to the lack of repeatability of the exact same conditions on different occasions (even though single measurements may include several spectral acquisitions). In addition, there are limiting factors due to the ambiguous use of reflectance terminology, measurement geometry description and variable measurement protocols (Milton et al., 2009; Schaepman-Strub et al., 2006). To control the limiting factors the provision of metadata and sufficient documentation on the measurement conditions and target characteristics is essential (Rasaiah et al., 2014, 2015). To produce high-quality spectral information, some guidelines for successful measurements and factors influencing the measurement output have been reported by both the instrument manufacturers and the individual scientific projects (Goetz, 2012; Pfitzner et al., 2011). Depending on the application, different levels of quality can be acceptable, but in general common protocols and standardized terminology are required for successful data sharing, fusion of different data sources and for the data comparison (Dor et al., 2015; Milton et al., 2009). Often laborious and time-consuming experimental field work, data review and quality check may limit the resources to compile a thoroughly described metadata (Kokaly et al., 2017; Rasaiah et al., 2015). A set of metadata parameters critical to field spectroscopy have been presented by Rasaiah et al. (2014). They include viewing geometry, location, general target and sampling properties, illumination, instrument properties, reference standards, calibration, hyperspectral signal properties, atmospheric conditions, and general project details. The requirements aim for such metadata and documentation that the user is able to assess the quality level of the spectra and account for the likely variations from one data record to another.
We collected a surface spectral reflectance data record including main components (model spectral endmembers) of boreal seasonally snow covered landscape during spring. The collection consists of laboratory, portable field, mast-borne and selected airborne campaign reflectance observations of snow and vegetation representing a subarctic site in the northern boreal forest zone. The site is located at the Sodankylä Arctic Space Centre in northern Finland (67.37∘ N, 26.63∘ E), including the surrounding regions. The mast-borne data records are available since 2010 until 2018. Data from other platforms (portable field and airborne systems) incorporate targeted campaign data records overlapping in time (2010–2011) with the mast-borne observations. The data record is constructed according to the principles described above, hence enabling the utilization by a diverse user community. Two spectrometer types were used to assemble the data record: (1) Analytical Spectral Devices (ASD) field portable spectroradiometers covering the range from 350 to 2500 nm with a spectral resolution of approximately 3 nm at 700 nm and 10–12 nm between 900 and 2500 nm and (2) the AisaDUAL airborne imaging spectrometer covering the range from 400 to 2500 nm with a spectral resolution of 5 nm between 400 and 970 nm and 6 nm between 970 and 2500 nm. The data record is composed of ASD spectral signatures and AisaDUAL image mosaics in selected wavelength bands (555, 645, 859 and 1640 nm). In addition to the spectral reflectances, the associated metadata describe the utilized instrumentation, measurement protocol, target properties, information about impurities in snow, and measurement/environment conditions, such as weather and illumination. Here we first describe the Sodankylä main experimental site and give a concise overview of the measurement systems and observed targets. Then, we define the provided reflectance quantity of the data record. From then on, the measurement systems and measured targets of each scale/platform are introduced in detail, and examples of each scale of the data record are given. Finally, the discussion of possible sources of error and uncertainty is accompanied with conclusions and recommendations for data utilization.
2.1 Sodankylä site in northern Finland
In this section, we describe the Finnish Meteorological Institute's Sodankylä Arctic Space Centre (FMI-ARC) experimental site characteristics for data collection. Besides the four different spatial-scale datasets (described in the following Sects. 2.2 and 3) from the FMI-ARC area, data are also presented from one aerial survey over Saariselkä, around 120 km north of Sodankylä. Saariselkä is a fell (Arctic hill) region that has a timberline at an altitude of 400 m a.s.l. The treeless altitudes represent fell tundra (Virtanen et al., 2016). Also, some individual field spectral samples from a boreal forest area in Nuuksio, Espoo, southern Finland, are included in the collection (Fig. 1). These additional data were collected to capture more observations from late melting conditions of the snowpack.
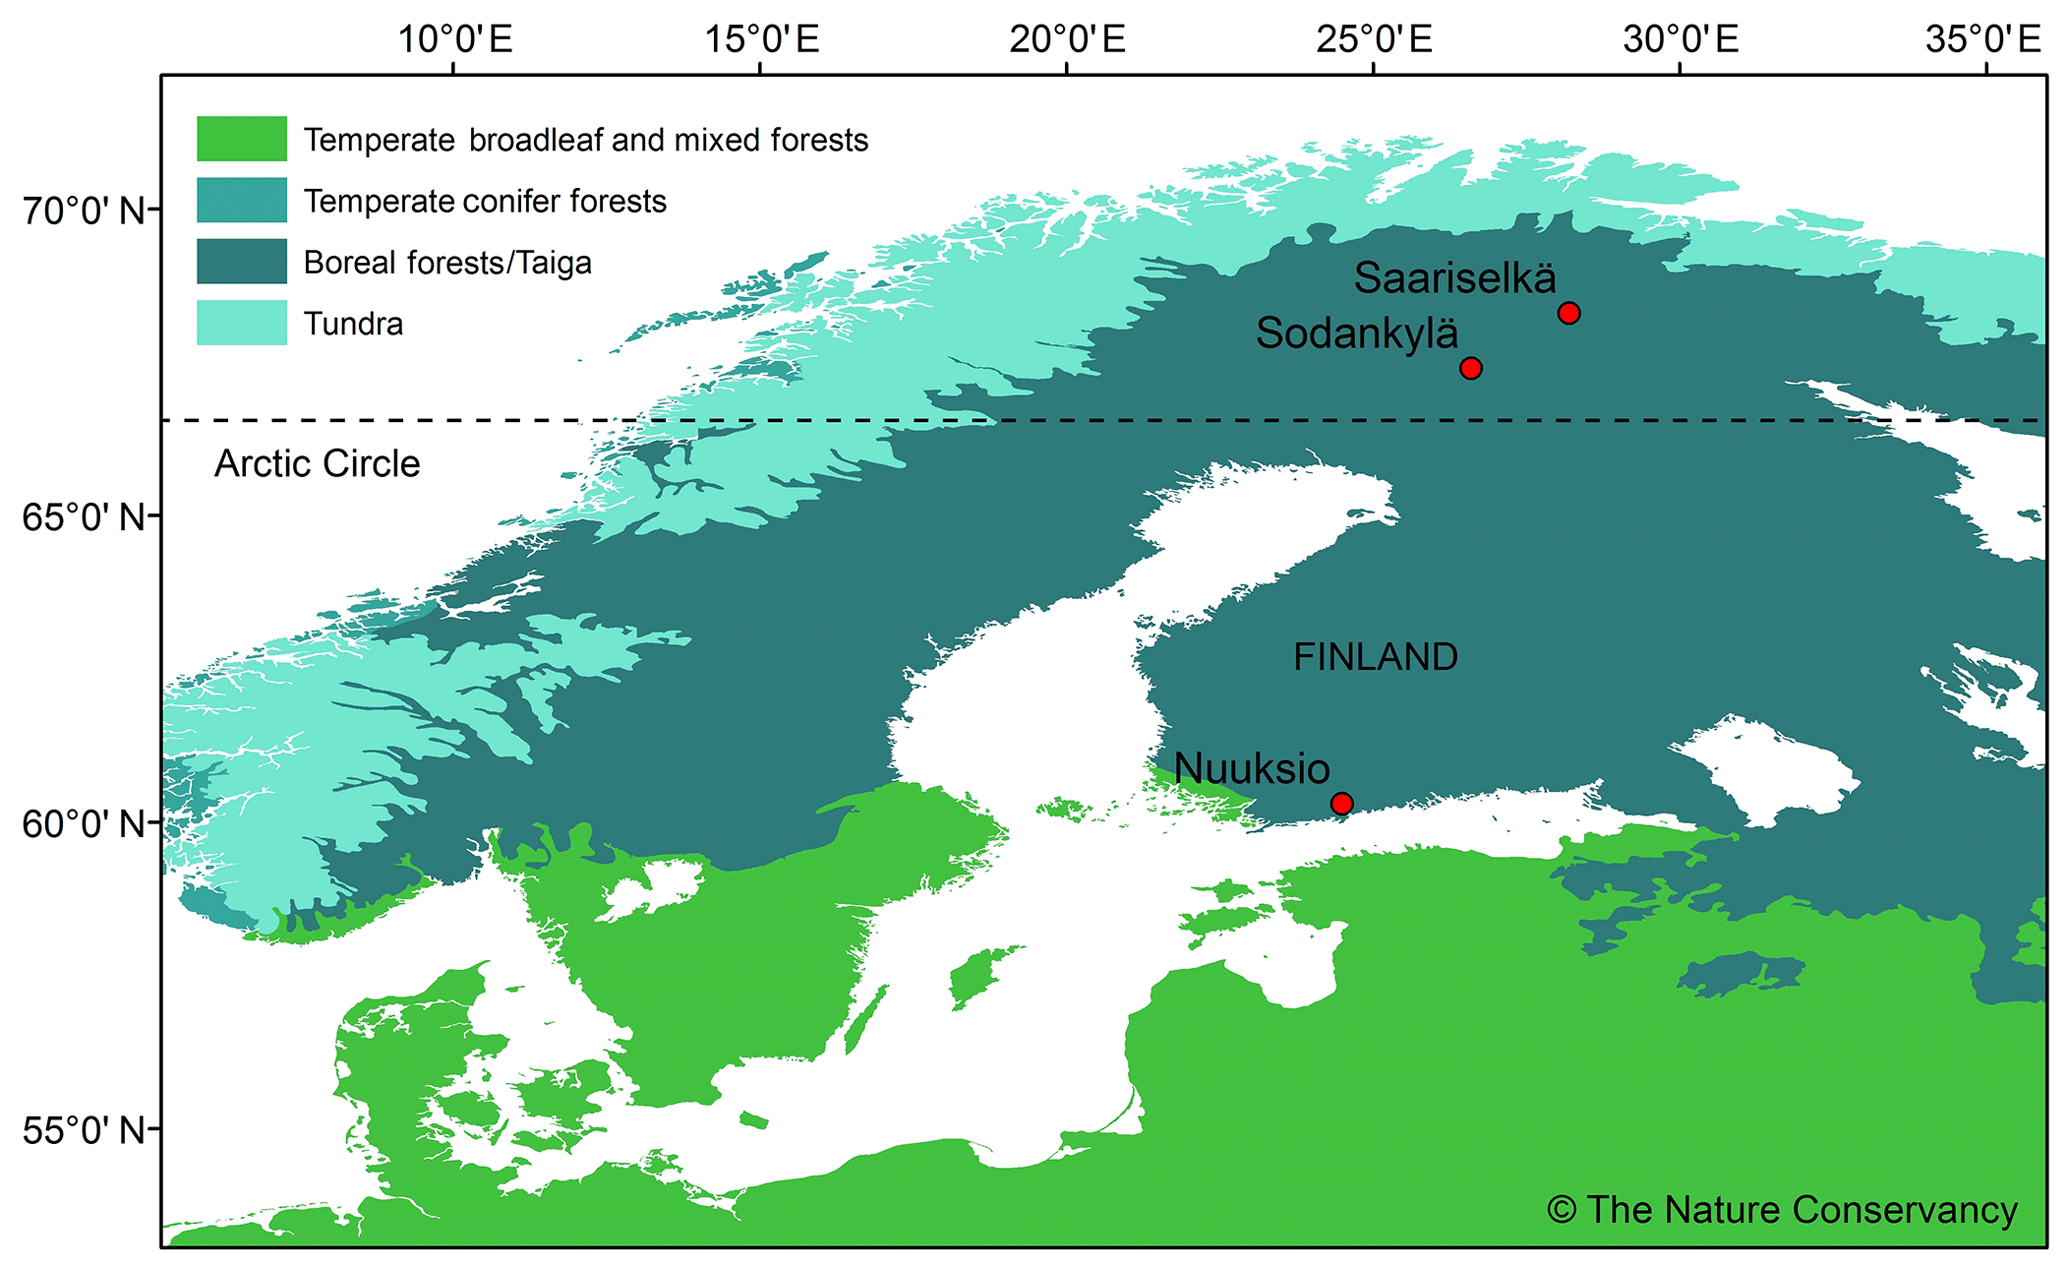
Figure 1The location of the Sodankylä Arctic Space Centre (FMI-ARC), where most of the data records have been measured. In addition, one aerial survey was conducted in the Saariselkä fell region, north from the FMI-ARC, and some individual field spectra were measured in Nuuksio, Espoo, southern Finland. Distribution of boreal, temperate conifer, temperate broadleaf and mixed forests, and tundra by the Nature Conservancy (Olson and Dinerstein, 2002, http://maps.tnc.org, last access: December 2018).
The Sodankylä station, situated above the Arctic Circle in northern Finland (67.37∘ N, 26.63∘ E; 179 m a.s.l.), provides an ideal location for environmental and atmospheric research of the boreal and subarctic region. In fact, Sodankylä is one of the primary stations of the WMO Global Atmosphere Watch (GAW), WMO Global Cryosphere Watch (GCW) and Integrated Carbon Observation System (ICOS) networks. Measurements at the Sodankylä station date back more than 100 years (Kangas et al., 2016). At the Sodankylä station and its vicinity, there is automated as well as manual in situ data collection in a variety of different ecosystems and landscapes, in addition to several permanent platforms for satellite reference instruments.
The Sodankylä region is a globally representative example of the boreal forest biome, which encompasses the largest continuous land ecosystem on the planet (ACIA, 2005). Seasonal snow cover is a characteristic feature of the boreal forest zone affecting strongly the functions of the ecosystem, water cycle, and surface–atmosphere interaction. Sodankylä has a subarctic climate due to the warming effect of the Gulf Stream (Kangas et al., 2016). Characteristics for Sodankylä are extreme seasonal temperature variations as well as long and cold winters with a snow season from October until May. The Sodankylä area represents taiga snow, and from 1981 until 2010, the maximum snow depth of approximately 80 cm occurred in late March (Pirinen et al., 2012). The changing seasonal snow cover affects the boreal forest carbon uptake and storage and the hydrological cycle, which are also important features of the boreal ecology in the Sodankylä region (Pan et al., 2011). The landscape around the Sodankylä station is relatively flat, with isolated fells reaching up to 500 m. The landscape consists of sparse-pine-dominated coniferous forests and open areas on mineral soil as well as open peat bogs (Leppänen et al., 2016).
2.2 Spectrometer measurement geometry, calibration and reflectance quantities
All spectral observations here, regardless of their measurement scale, correspond to a typical polar-orbiting satellite measurement in the high-latitude spring season with respect to their Sun or illumination source (calibrated lamp) zenith angle and close-to-nadir instrument viewing angle. Figure 2 illustrates the radiance (unit of measure: W m−2 sr−1 nm−1) measurements conducted using different platforms to provide reflectance data for satellite observation analysis. Satellites observe the radiation intensity reflected from the Earth's surface, which is calibrated into a physical quantity, such as top of atmosphere (TOA) reflectance that can be converted to surface reflectance using atmospheric correction methods. Here, the spectra are calibrated to surface reflectance by using a white reference panel with a known reflectance spectrum approximating a Lambertian surface; the incoming radiation is determined by measuring the radiance from a white Spectralon panel (12.7 cm, SRT-99, Labsphere Inc., USA). Spectralon is made of packed sintered polytetrafluoroethylene (PTFE) powder which is highly reflective and exhibits nearly Lambertian behaviour from the ultraviolet to near-infrared region. PTFE is chemically stable and hydrophobic (Springsteen, 1999). The calibration procedure for each platform was conducted as follows.
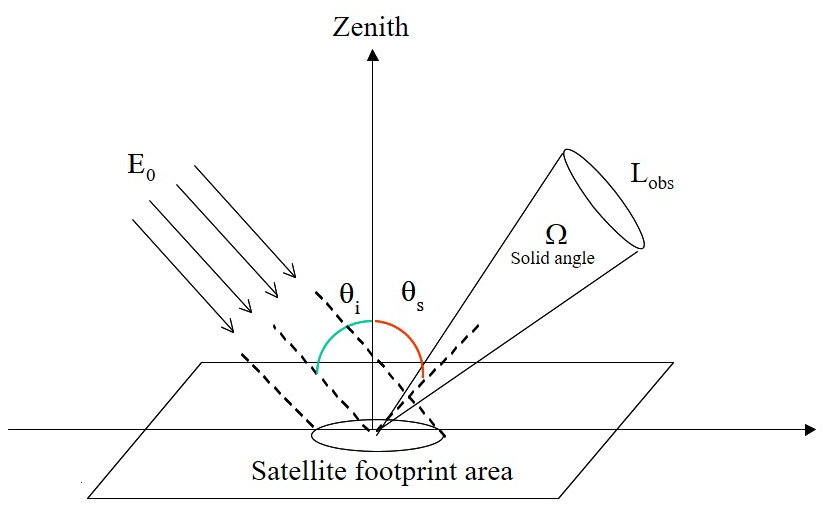
Figure 2General concept of a satellite- or ground-based remote sensing measurement of reflected radiance. θi is the incidence angle of incoming irradiance and θs is the instrument's viewing angle. The incoming Sun irradiance E0 is projected to the Earth's surface (instrument's footprint area) with the magnitude E0cos (θi). The instrument measures the reflected radiance Lobs within its viewing angle (i.e. the radiant flux per unit solid angle, Ωsolid angle). The ratio between the reflected and incoming radiation provides reflectance according to Eq. (2). The azimuth angle is omitted for simplicity. The figure is adapted from Salminen (2017).
In the laboratory, the Spectralon radiance was measured both before and after each pine/spruce branch sample, and the sample radiances were converted to absolute reflectance by dividing with the Spectralon radiance and multiplying with the reference panel calibration data (from the manufacturer). In the case of snow measurements in the laboratory, the Spectralon radiance was measured at the beginning and at the end of the measurements of samples of the specific snow type, and all the Spectralon radiances for each measurement day were then averaged. In field measurements, the Spectralon was measured before each (snow or lichen/moss) sample and repeated when necessary, e.g. if the illumination conditions changed during one measurement event.
Mast-based (forest opening and pine forest) target radiances were converted to reflectance by using a Spectralon radiance measurement obtained before each target observation (the Spectralon is pushed under the measurement head automatically). The instrument is taken down from the mast for the cold and lightless midwinter. During this time, dark laboratory tests are conducted to reveal any substantial changes in the instrument response or possible degradation of the Spectralon panel due to impurities or exposure to UV (ultraviolet) radiation. The changes in the reference panel reflectance are tested by measuring the Spectralon against a similar panel without exposure to any external stresses. In most cases, these measurements are executed before and after cleaning the panel (pressure air or sanding under running water), with the former status of the Spectralon being valid for mast measurements before and the latter for measurements after the laboratory tests. The observed mast scene absolute reflectance values (Rscene) at wavelength λ are then corrected based on the laboratory results as follows:
where Rcal is the Spectralon panel calibration data from the manufacturer, Lref is the Spectralon panel radiance for the mast reference and Lcal is the Spectralon panel radiance for the laboratory standard measured in a dark laboratory. Lscene is the radiance of the target scene and LRef the radiance of the Spectralon panel measured at the mast.
Airborne radiances measured in March 2010 were converted to reflectances by vicarious calibration. Airborne radiances were compared with the concurrent mast-borne radiances from the forest site, and calibration coefficients were determined for AISA data by using a least-squares fitting technique. To obtain reflectances the concurrent calibrated mast-borne Spectralon radiances were utilized (Heinilä et al., 2014). In 2011, the airborne reflectance level was obtained by applying a real-time fibre-optic downwelling irradiance sensor (FODIS).
The reflectance quantity of all observations discussed here, corresponding to the atmospherically corrected estimate of surface reflectance from satellite data, is
where R is the surface reflectance factor, π is a scaling factor related to the Lambertian surface, Lobs is the instrument-observed radiance, E0cos(θi) is the incoming radiance projected to the surface, and the Sun zenith angle of incident radiation is θi.
The reflectance data given here are calibrated by Eq. (2) to approximately correspond to the bidirectional reflectance factor (BRF). This is the case since the calibration is carried out by a white reference panel approximating a Lambertian surface, and the incoming irradiance is predominantly or totally originating from one (narrow) direction of the illumination source (calibrated lamp or the Sun). Additionally, some observations are obtained under diffuse illumination conditions (full cloud cover providing close to hemispheric isotropic illumination) but using the same calibration procedure with a white reference panel. However, the actual measurement setup represents a biconical configuration when the data have been collected in clear-sky conditions or with a calibrated lamp (direct irradiance) and a hemispherical–conical geometrical measurement setup when the data have been collected in overcast (diffuse) conditions (Shaepman-Strub et al., 2006). Since the calibration is a comparison against a Lambertian surface, the recorded reflectance can show values above one.
2.3 Measurement systems and collected data
In this section we give a short overview of the measurement setups and platforms. In Sect. 3 below, the conditions and processing steps for the data collection are described in more detail. The four platforms included are the laboratory, portable field, mast-borne and airborne setup (Fig. 3). The instrument utilized for the first three platforms is the FieldSpec Pro JR spectroradiometer by ASD (Boulder, Co, USA). The laboratory and field measurements were carried out with the same FieldSpec Pro JR unit, whereas the mast-borne instrument is a fixed installation. The AisaDUAL airborne imaging spectrometer by Spectral Imaging Ltd. (SPECIM; Oulu, Finland) was used on the airborne platform. The technical specifications and details of the setups of ASD and AisaDUAL are described in Table 1. An overview of the measurement systems and targets along with the digital object identifier (DOI) for each dataset are given in Table 2. The overlap of the different measurements conducted over different platforms is presented in Fig. 4. In brief, spectra of snow, pine branches and spruce branches were measured by using the laboratory setup (Fig. 5), whereas snow-on-ground and snow-free ground spectra were obtained with the portable setup (Fig. 7). In both cases the footprint of a single measurement was small, on the order of 4–20 cm (diameter) depending on the measurement optics and the distance between the sensor and the target. Mast-borne forest and forest opening spectra were collected during winter and spring-melt periods with a footprint size of about 14 m in diameter. Selected spectral bands from the airborne AisaDUAL measurements from snow and snow-free ground surveys were added to the published collection. The investigated targets are somewhat different between the four scales, but they are the components of the same investigated boreal landscape.
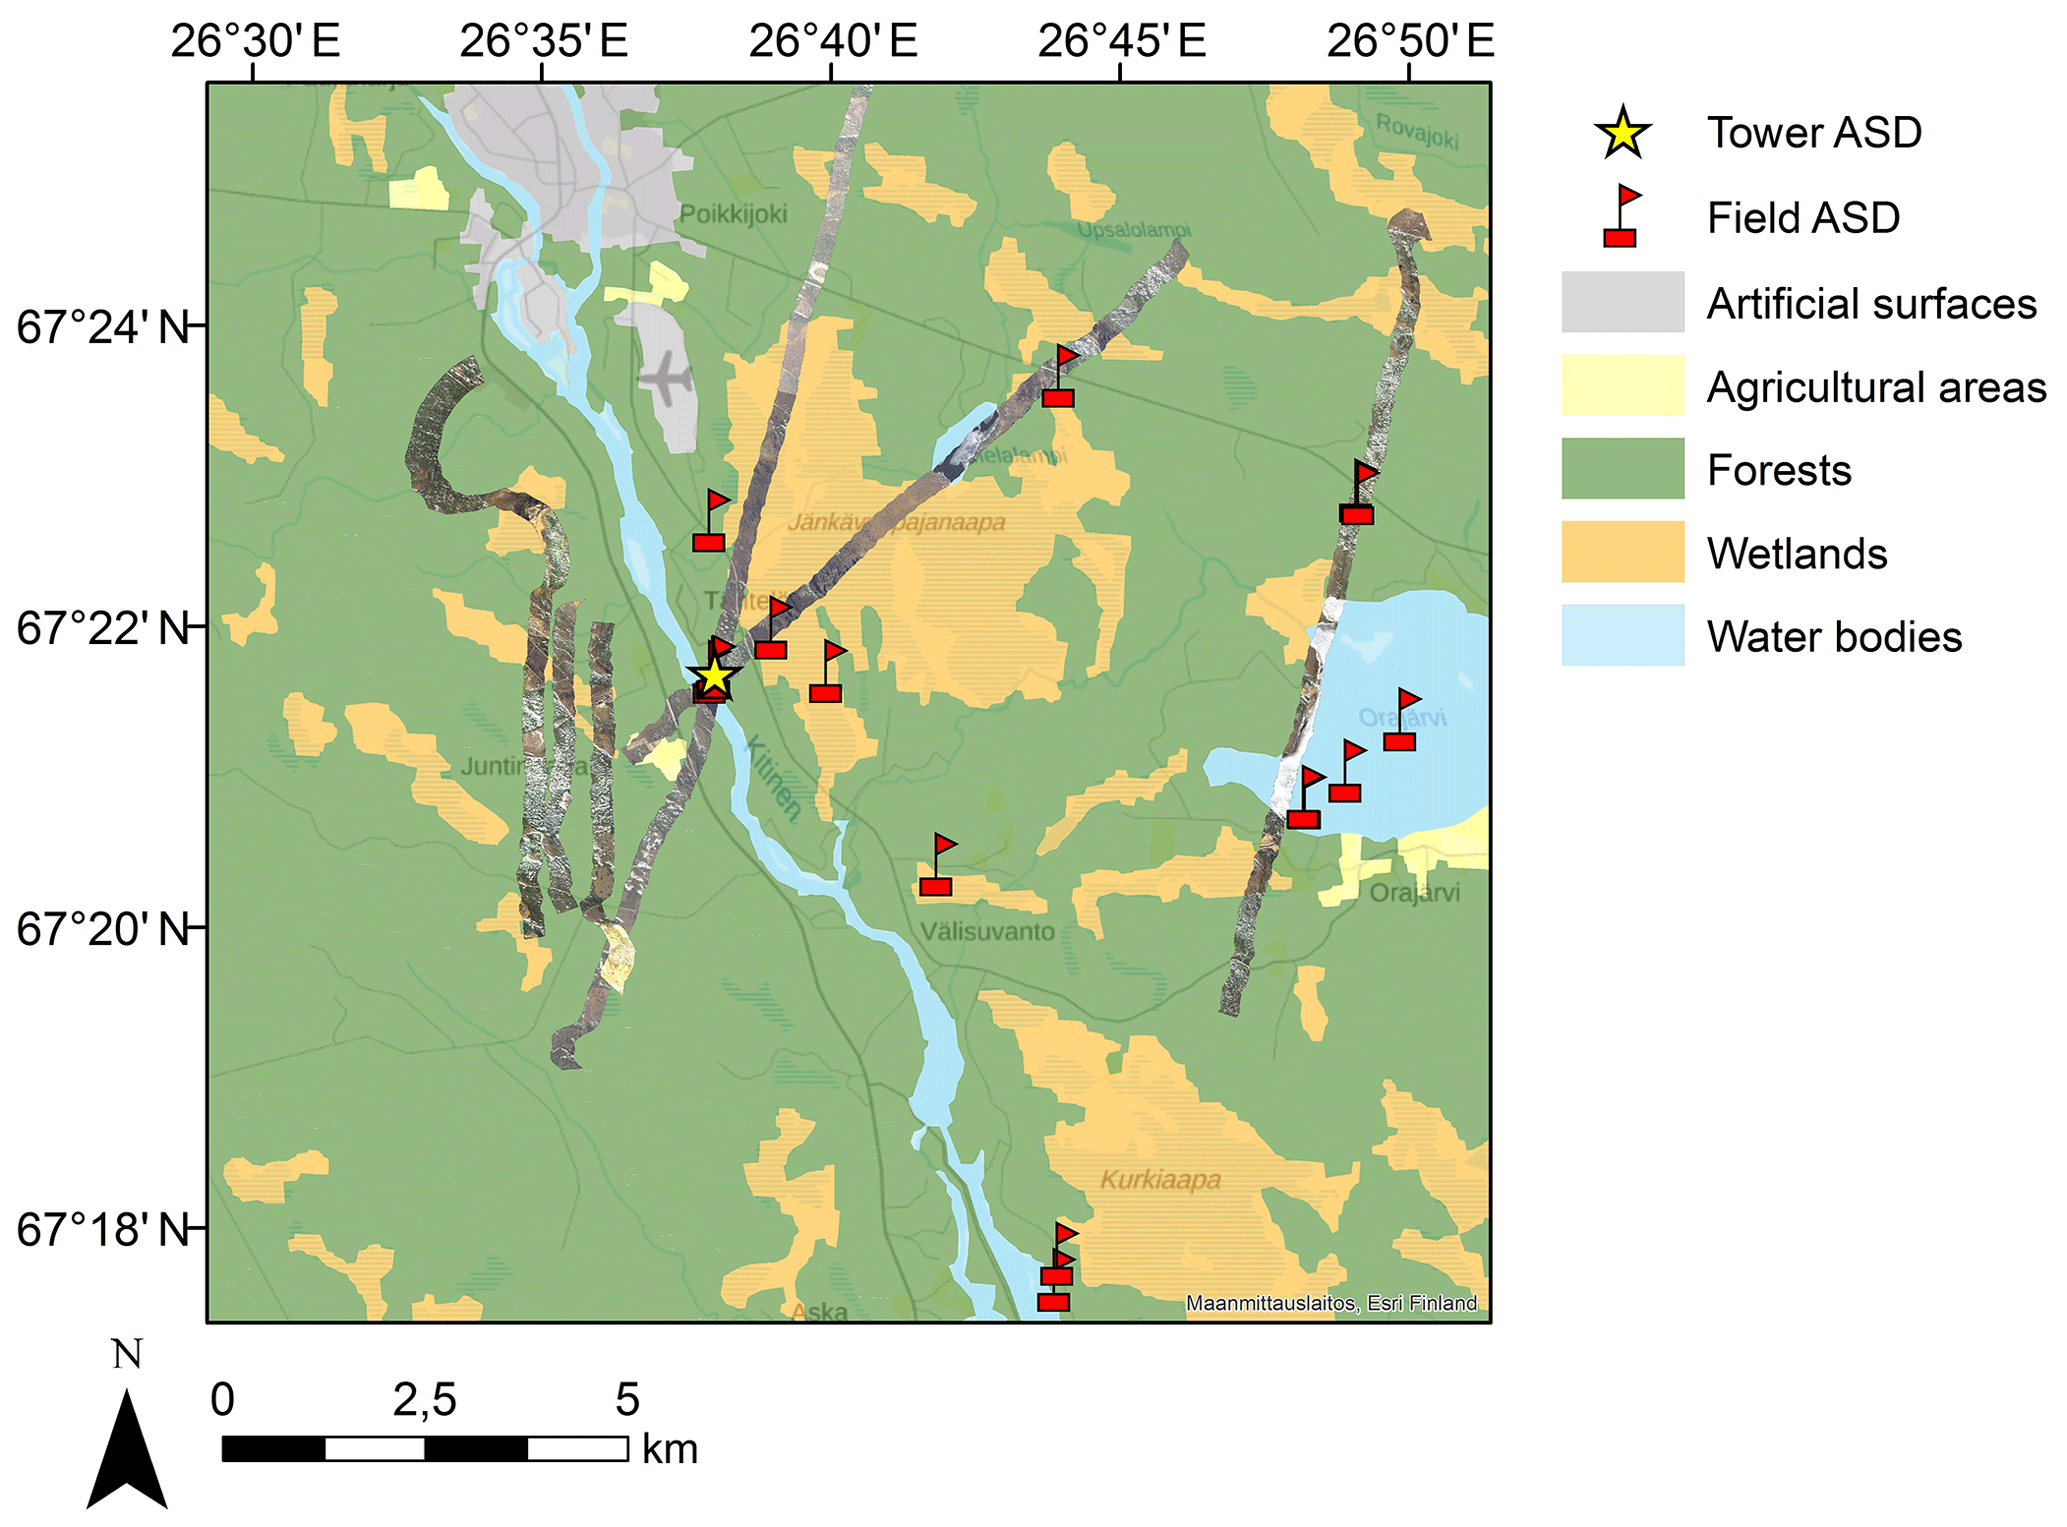
Figure 3AisaDUAL flight lines measured in 2010 and 2011, and the measurement points of the portable field and the mast-borne measurements at the FMI-ARC main site. The CORINE Land Cover 2018 classification by the Copernicus programme and a basemap is shown in the background (© National Land Survey of Finland, Esri Finland December 2018).
Table 1Technical details of instruments and different installation platforms.
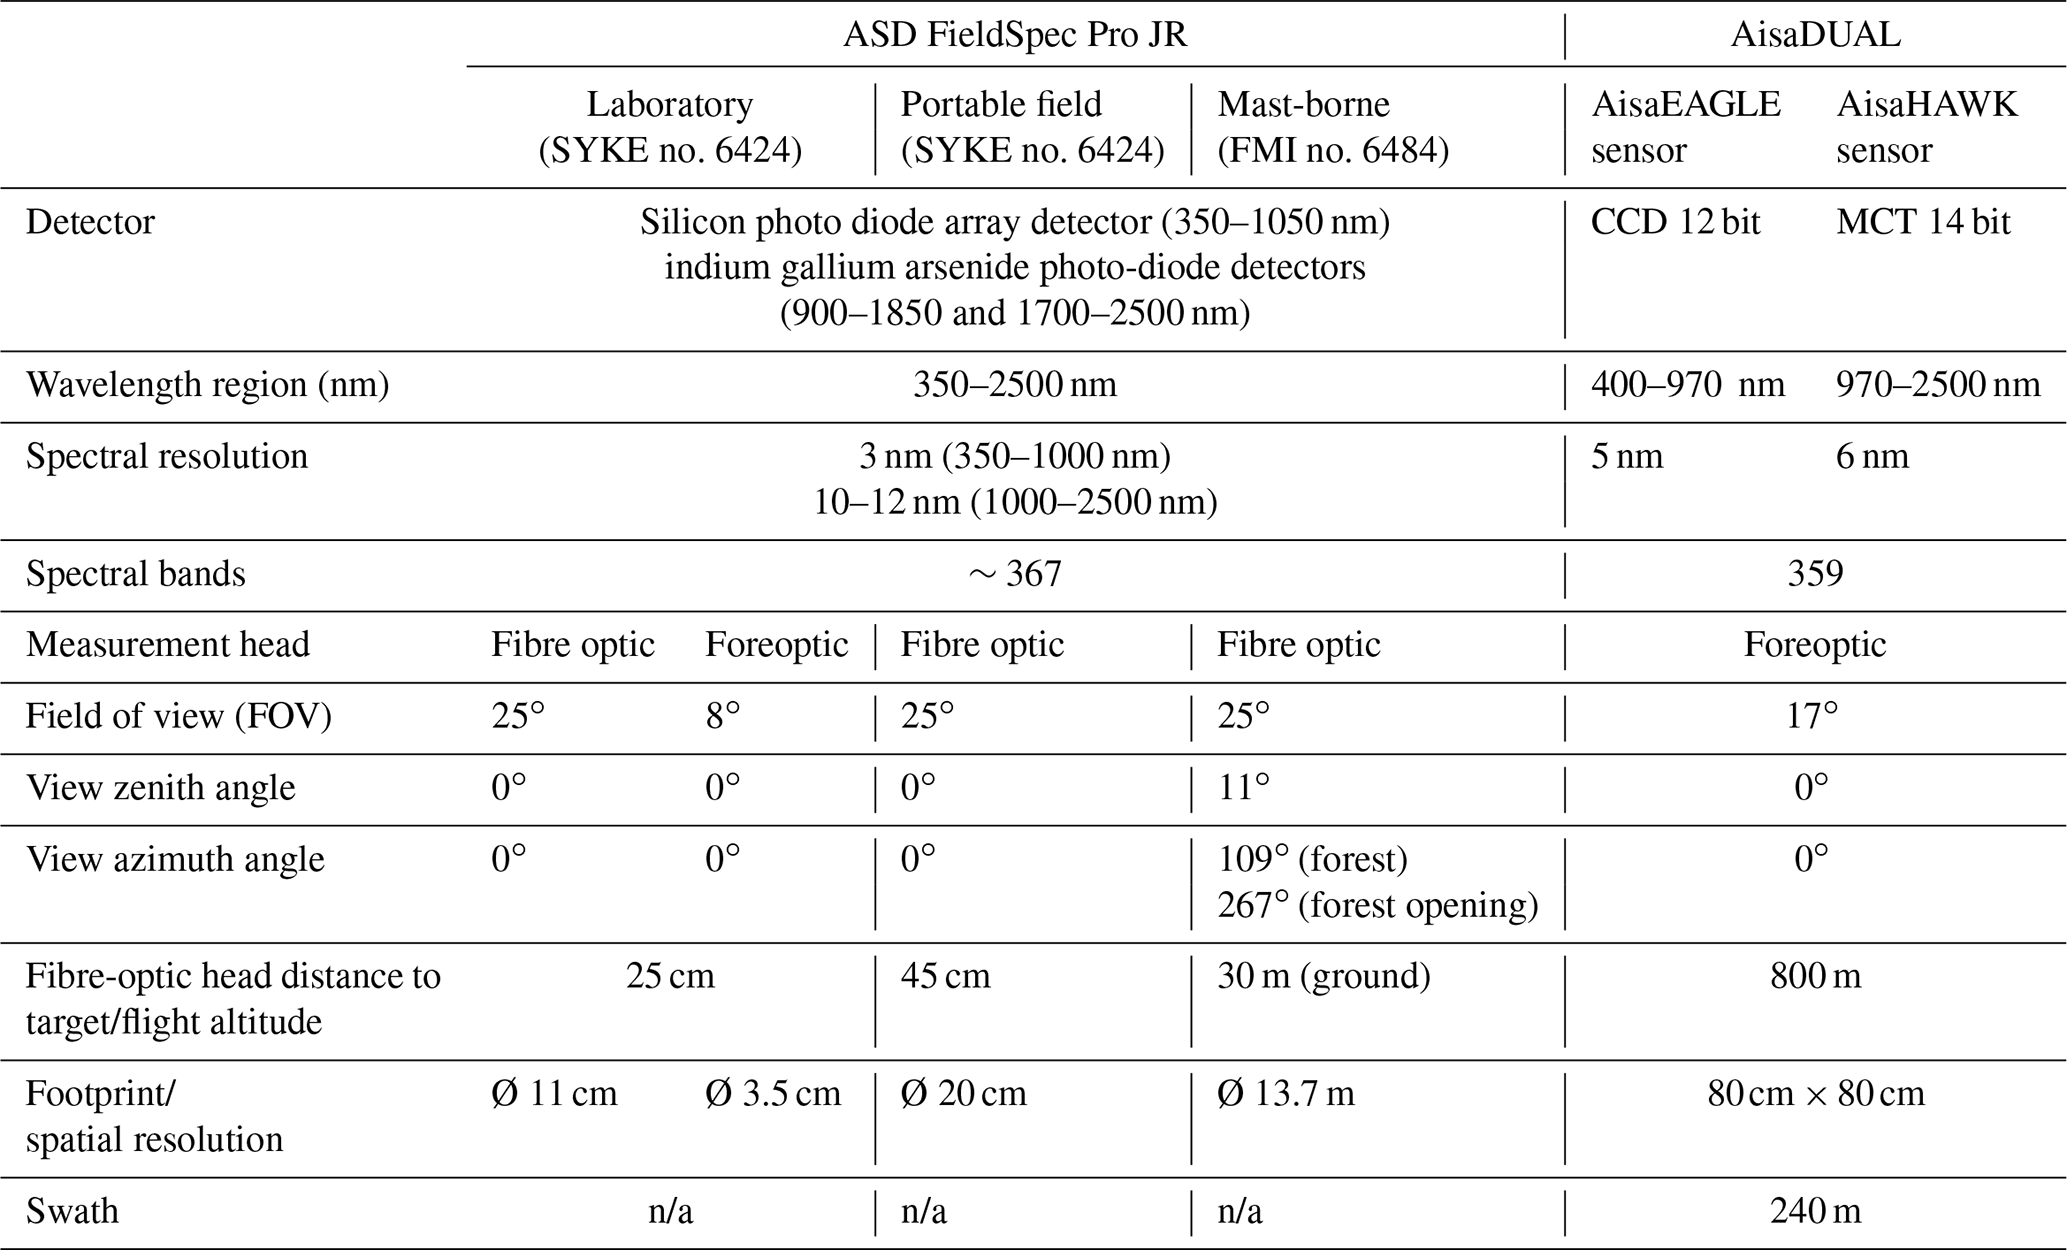
n/a – not applicable
Table 2The data record measurement dates and targets. The total number of separate measurements per target type and the number of spectra averaged (consequent spectral acquisitions collected at 1 s interval) for each individual target measurement are presented. The accompanied reference measurements are described in Sect. 3.5. In the last column the digital object identifier (DOI) for each spectral dataset is given.
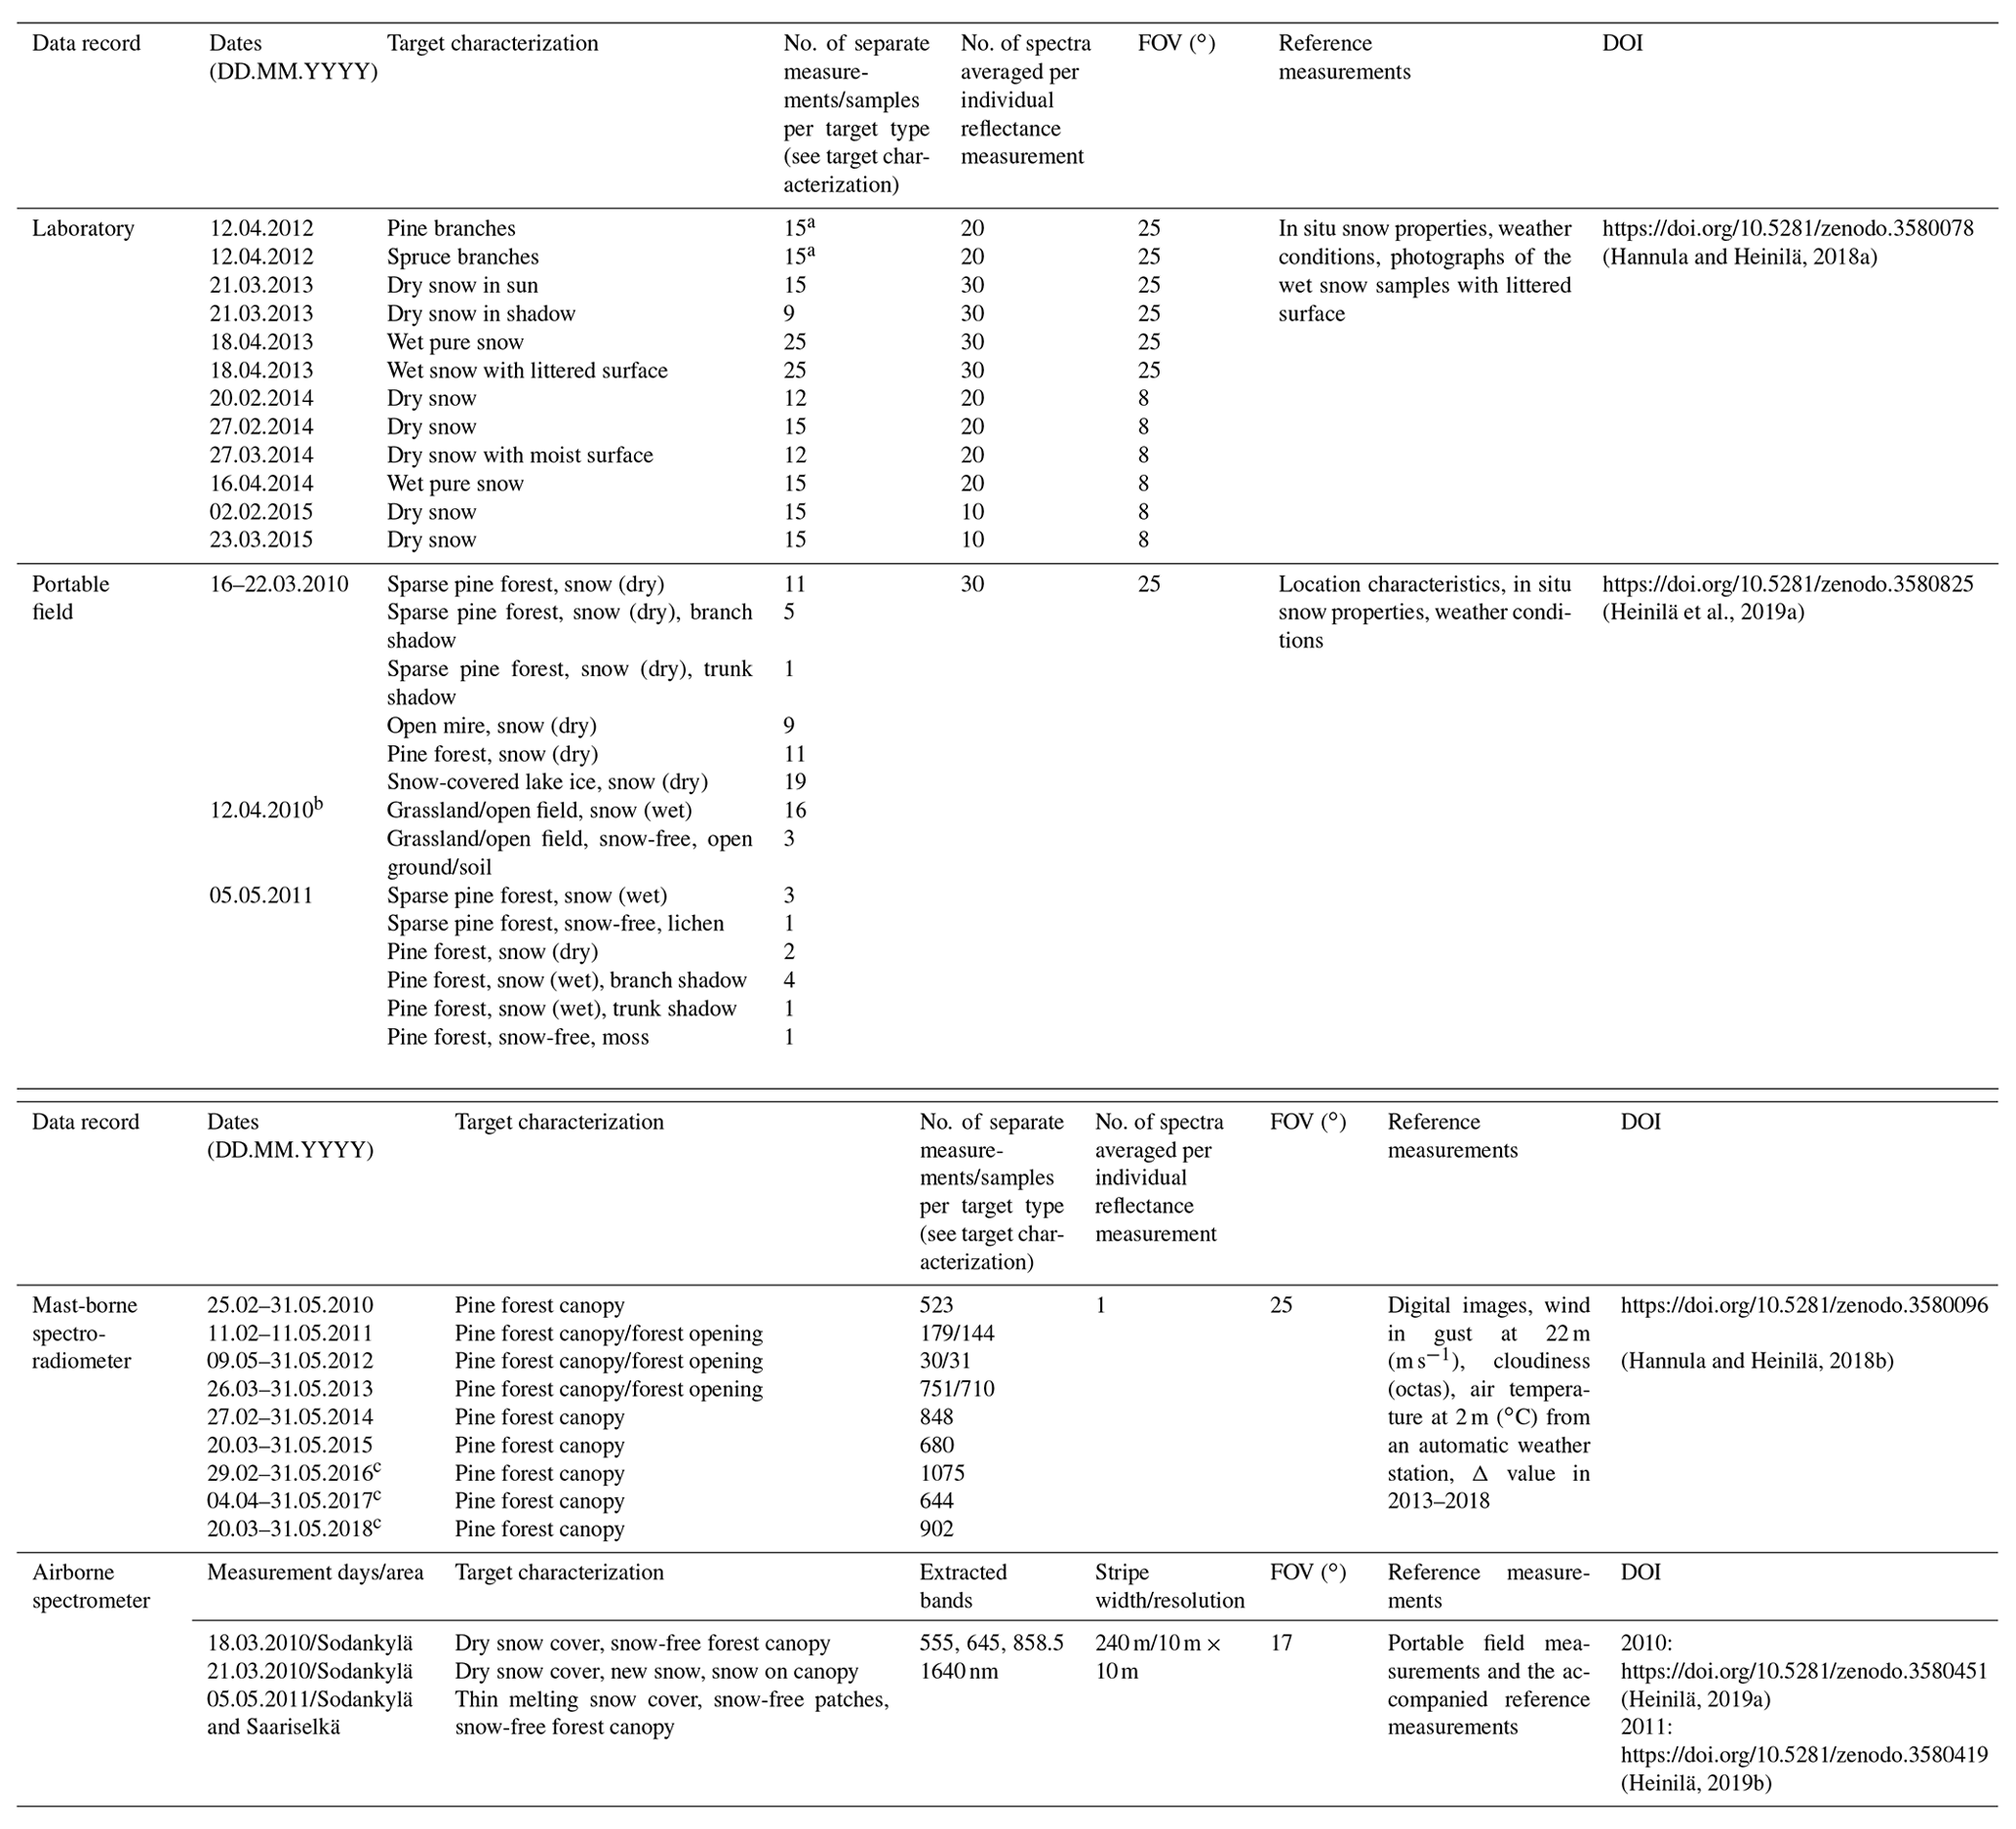
a Box with pine/spruce branches was shifted 15 times per measurement geometry. b Measured in grassland surroundings in southern Finland. c Data available only between 350 and 1000 nm.
3.1 Laboratory spectroradiometer measurements of snow, pine and spruce
Snow, pine and spruce branch reflectances were measured in laboratory conditions to define the endmember reflectances used in the optical remote sensing of snow (Metsämäki et al., 2005, 2012). The experiments were carried out with the same ASD FieldSpec Pro Jr spectroradiometer that was also used in the field measurements. Reflectances of pine and spruce branches were measured in April 2012. The laboratory measurements of snow reflectances were conducted in the springs of 2013, 2014 and 2015 (Hannula and Pulliainen, 2019). The snow measurements were done for different snow types. The properties of snow were also measured in situ (Table 3 in Sect. 3.5).
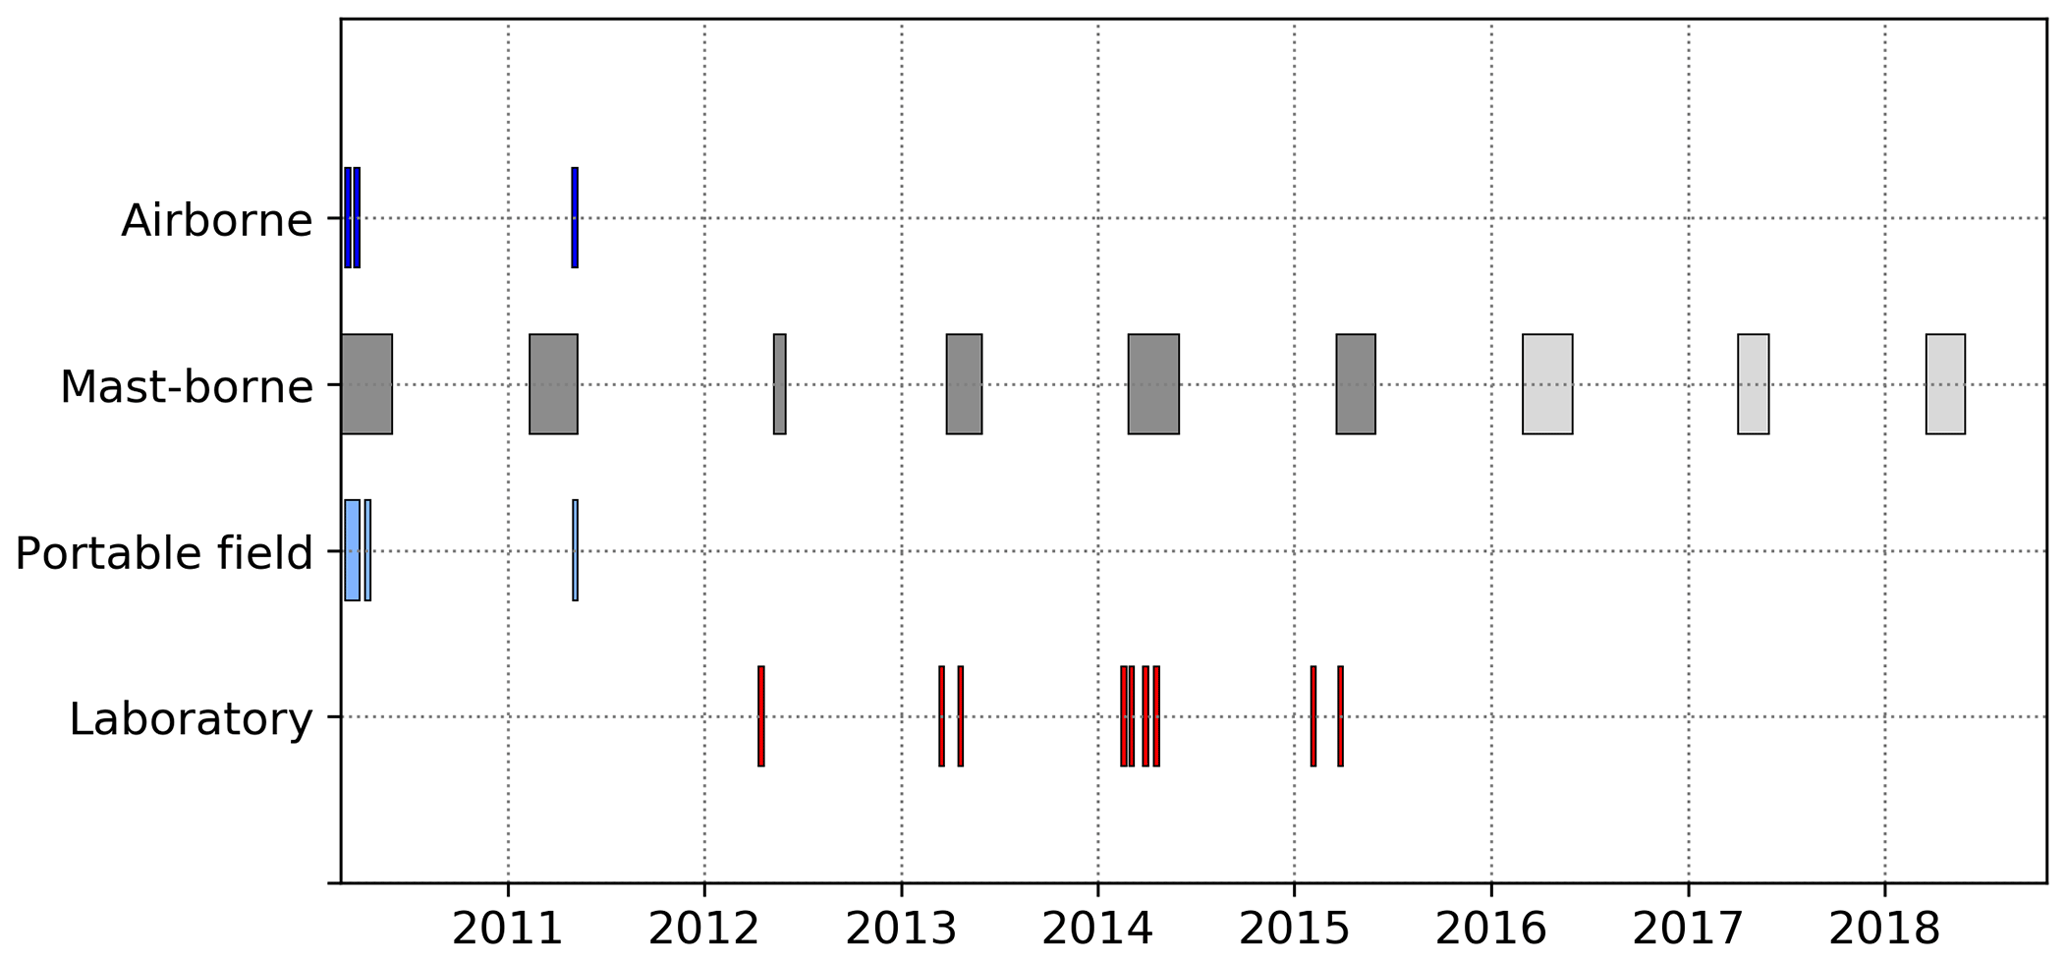
Figure 4Overlap of the different measurements conducted over different platforms. For the mast-borne platform, the observations first cover a spectral range of 350–2500 nm and a range of 350–1000 nm from 2016 onwards.
The pine and spruce branches were collected on the experiment day and placed inside a fridge until they were measured. Two black boxes were filled with the branches, one with pine branches and one with spruce branches. A bare fibre-optic cable was used as a measurement head and spectra were collected at nadir view angle. The laboratory measurement setup for the spruce spectra acquisition is illustrated in Fig. 5a. A calibrated tungsten halogen lamp was used as a light source with a light zenith angle of . The lamp current was stabilized at 8 A with an accuracy of 0.01 %, leading to an accuracy of lamp irradiance of ±0.1 %. In each case, a mean from 20 individual spectra, measured at 1 s intervals, was calculated. For both pine and spruce, the measurements were repeated 15 times, shifting the box randomly to a different position between the measurements. The fibre-optic head distance to the target (Table 1) was defined from the uppermost limit of the pine/spruce branches.
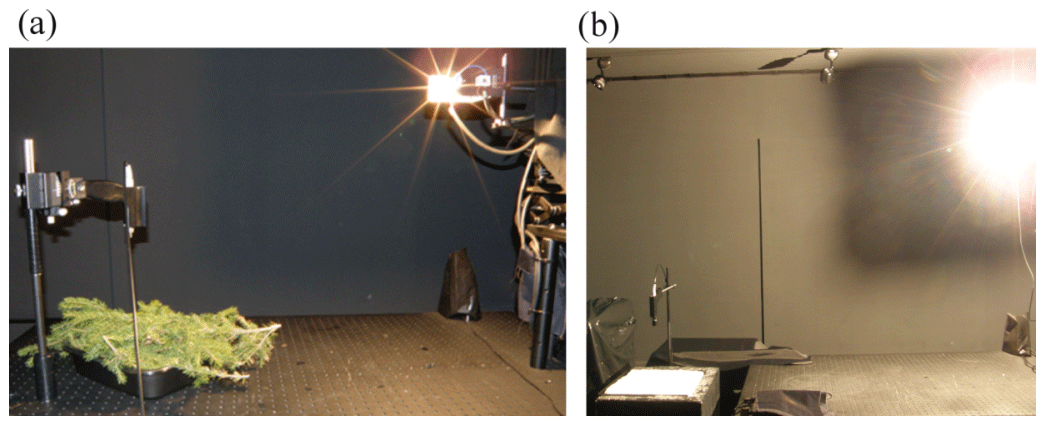
For the snow sample collection, an aluminium sampler of the size of , painted inside with matte black colour, was used. After removal, each sample was placed inside a black insulated box, carried inside the laboratory and measured immediately (Fig. 5b). A mean of 10, 20 or 30 individual spectrum acquisitions (depending on snow type), collected at 1 s intervals, from each snow sample were measured. The measured snow type conditions represented wet melting snow (N=2), wet melting snow affected by forest litter inclusions (N=1), dry snow with moist surface (N=1) and dry snow (N=6). The illumination zenith angle was θ=55∘. A bare fibre-optic cable was used as a measurement head in 2013, and spectra were collected at nadir view angle. In 2014 and 2015 an 8∘ foreoptic was used. The number of snow samples collected and measured from each snow type varied between 9 and 25, in total (Table 2).
Examples of the mean spectra measured in the laboratory for pine and spruce branches as well as dry and wet snow types are shown in Fig. 6. The spectra in Fig. 6a and b show the variation in pine/spruce branch reflectance when the sample box was shifted under the measurement head. The standard deviation, defined from the consequent measurement acquisitions collected and averaged for one measurement spectrum, is so small that they are very difficult to distinguish from the plot. In Fig. 6c the standard deviation shows the deviation between different snow samples collected and measured from the same investigated snow type. Although, the experiment setup does not simulate the true conditions accurately, in the laboratory the measurement surroundings can be controlled. By practically removing the effects of changing illumination conditions and diffuse light, it is possible to evaluate the spectral characteristics of the targets. The main findings of the laboratory experiments are the mean and standard deviation of reflectance for dry and wet snow types as well as for boreal pine and spruce branches. These provide reference information to be utilized in the characterization of the spectral endmembers of the remote sensing models.

Figure 6Reflectance spectra for (a) pine branches, (b) spruce branches and (c) three types of snow measured in dark laboratory conditions ± standard deviation. In (a) and (b) individual reflectance spectra for pine and spruce branches measured by shifting the sample box are presented, and the standard deviation is the deviation between consequent measurement acquisitions (n=20) averaged for each individual spectrum. In (c) the standard deviation is the deviation between different snow samples collected and measured from the same snow type investigated.
3.2 Portable spectroradiometer measurements of snow and snow-free ground
The reflectance spectra from snow and the ground underneath the snow cover were measured with the ASD FieldSpec Pro JR, which was also used in the laboratory measurements. Timing of the measurement campaigns was aimed to be both during the cold season and during the melting period, when patches of open ground appear in the snow surface and when the snow properties have higher variation. The measurement targets were characterized with location; landscape characteristics; weather conditions, namely air temperature and cloud cover; and in situ snow properties. Measurements were carried out in the springs of 2010 and 2011 for Sodankylä station and in the spring of 2010 on the grassland site in southern Finland. The data from Sodankylä was collected parallel to airborne campaigns with the AisaDUAL imaging spectrometer.
For field measurements, the spectroradiometer was placed in a polypropylene case with soft interior padding to protect the instrument during transport. Additionally, an external battery and a laptop were connected to the measurement unit. The measurement head was mounted on a camera tripod with an arm that can extend the measurement head around 40 cm from the centre of the tripod base (Fig. 7). The tripod was placed with the arm extending towards the Sun. A second tripod with a bubble level was used to place the Spectralon panel horizontally under the measurement head for the reference measurements. At each measurement location the coordinates and general conditions were logged and the incoming full sky irradiance was measured. For the reflectance measurements, first the Spectralon reflectance standard was measured and then the reflectance spectrum of the target, and in situ measurements of snow were carried out (Table 3). The distance between the tip of the measurement head and the target (snow surface/ground) was approximately 45 cm, and the associated full sky irradiance, measured with the remote cosine receptor (RCR), was also measured from this height. With a 25∘ field of view (FOV) of the optical fibre head, a footprint diameter of 20 cm on the ground/target was observed.

Figure 7Measurement setup for field measurements with the ASD FieldSpec Pro JR spectroradiometer. During the measurement, the operator stepped away and squatted to minimize the effect on the measurements.
Table 3Supplementary parameters measured from each snow type condition represented in the portable field measurements and in the snow laboratory experiments.
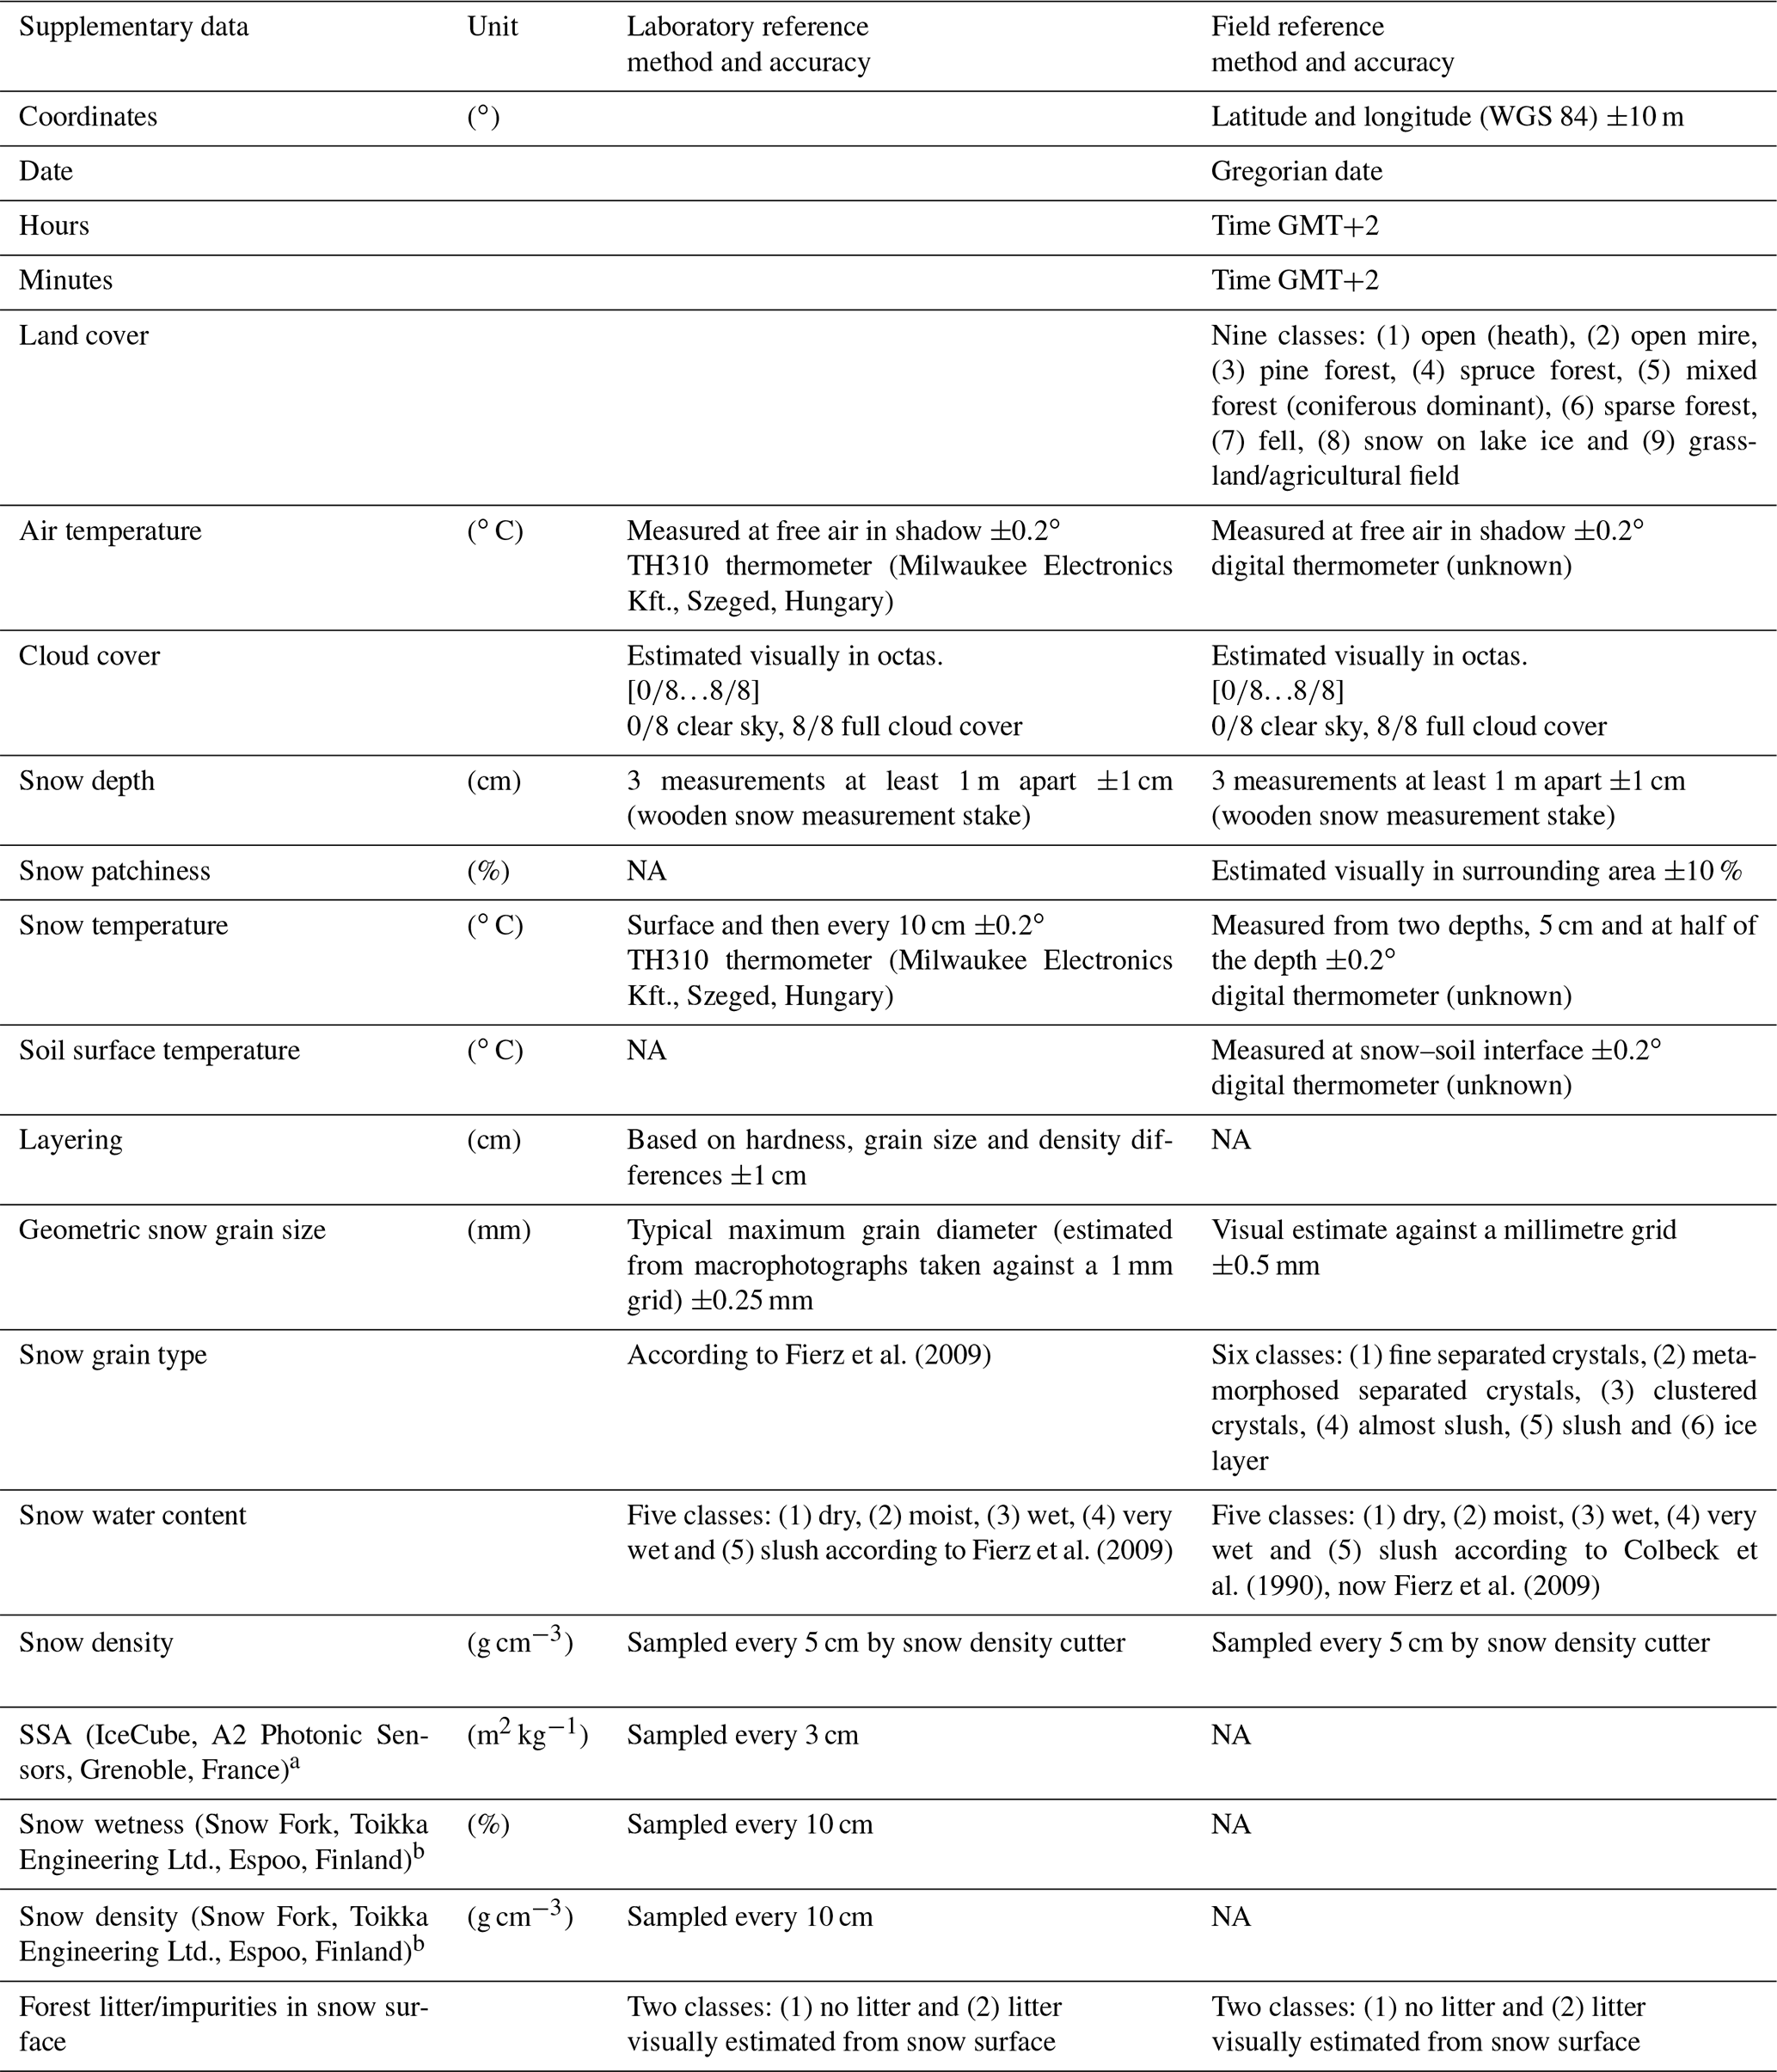
a Gallet et al. (2009). b Sihvola and Tiuri (1986). NA – not available
Measurements were carried out in forests (N=40), wetlands (N=9), grasslands (N=19) and on lake ice (N=19). The first campaign took place on 16–22 March 2010 when the area was characterized by full dry snow cover. The mean air temperature during the measurements was −5 ∘C. Therefore, the campaign was carried out in dominantly dry snow conditions. Snow depth for the measured sites varied, depending on the land cover type, between 12 and 87 cm. The largest snow depth was observed in a forest site and the smallest on lake ice. In contrast to the first campaign, during the second campaign on 5 May 2011 the snow cover was patchy (50 %–60 % snow patchiness) and wet. Due to varying illumination conditions during these measurements only selected spectral measurements in forests with good data quality were retained in the data record. The mean air temperature was 10.1 ∘C and snow depth ranged between 0 and 28 cm. In addition to campaign data from Sodankylä, reflectance measurements were carried out during the melting period along a transect with varying snow depth (0–26 cm) on a grassland site in Espoo, southern Finland, on 14 April 2010. At this time the snow patchiness ranged between 50 % and 70 % and snow was very wet.
In the portable field measurements of reflectance spectrum from snow and the ground underneath the snow cover, the goal was to get better understanding of the variation of the snow reflectance under different snow conditions (e.g. with different snow depths). In Fig. 8 field snow reflectance observations in clear-sky conditions in direct light and in shadow for dry and melting snow and for melting snow with different total snow depths are presented. Observed reflectances drop with increased water content, impurities and larger snow grain size in melting snow. The detection of snow cover in forested areas from optical satellites is also influenced by the shadowing of the ground by trees. The shadows decrease the reflectance considerably. It should be noted that the measurements are of apparent reflectance, i.e. reflectance measured at the Earth-observation instrument and therefore related to the full sky irradiance (Salminen et al., 2009). Depth of the snow pack becomes an important factor when snow cover is at the melting stage and light is passed through to the ground (Salminen et al., 2009). Noise at the water absorption band, characteristic for field measurements, is seen at 1900 nm, where the signal-to-noise ratio is inadequate for meaningful observations. Utilizing field observations, it is possible to study the effect of both the observation geometry and the target properties on the observed reflectance spectra, although controlling the measurement geometry is difficult.
3.3 Mast-borne spectroradiometer measurements of a pine forest and forest opening
The ASD FieldSpec Pro spectroradiometer was installed on a 33 m high mast in the intensive observation area (IOA) of the FMI-ARC for the optical remote sensing validation studies (project NorSEN, Nordkalotten Satellite Evaluation co-operation Network). The mast observations allow the evaluation of at-satellite reflectances in the spatial scale of the satellite image pixels. The dataset covers the spring time periods between 2010 and 2018. In 2010–2012 measurements were collected by an operator at hours 10:00, 12:00 and 14:00 UTC (Coordinated Universal Time) during clear-sky or full-cloud-cover conditions. Additionally, measurements were made more frequently during specific measurement campaigns. The system was automatized during summer 2012, and after that spectral measurements have been collected yearly from February to November every 30 min from 06:00 until 15:00 UTC. As the climatic environment during the snow season is challenging, the measurement pole was fixed over the forest target on 26 August 2013 due to frequent problems with the turning motor. After 29 September 2015 data are only available between 350 and 1000 nm because of breaking up of a non-replaceable part of the instrument (Table 2).
The instrument was placed inside a weather-resistant box for protection. The ASD standard fibre-optic cable was replaced by a longer 5 m cable by the manufacturer to enable mounting of the measurement head at the end of a turning pole. The measurement head is a bare fibre-optic cable with a FOV of 25∘ giving a footprint of around 14 m in diameter (185 m2). This enabled measurements from two separate locations from a sparse pine forest with a median tree height of 11 m (Niemi et al., 2012) (azimuth 109∘) and from a forest opening (azimuth 270∘) (Fig. 8). The forest opening measurement area is mainly covered by lichen, but there are also some patches of moss (Sukuvaara et al., 2007).
The fibre-optic head is tilted 11∘ away from the mast. A calibrated white reference panel (Spectralon) is mounted under a small shelter below the turning pole and is pushed under the measurement head and measured before each target measurement. A wide-angle camera is used to image the measurement area at the time of each spectral acquisition for the description of the measurement target characteristics.
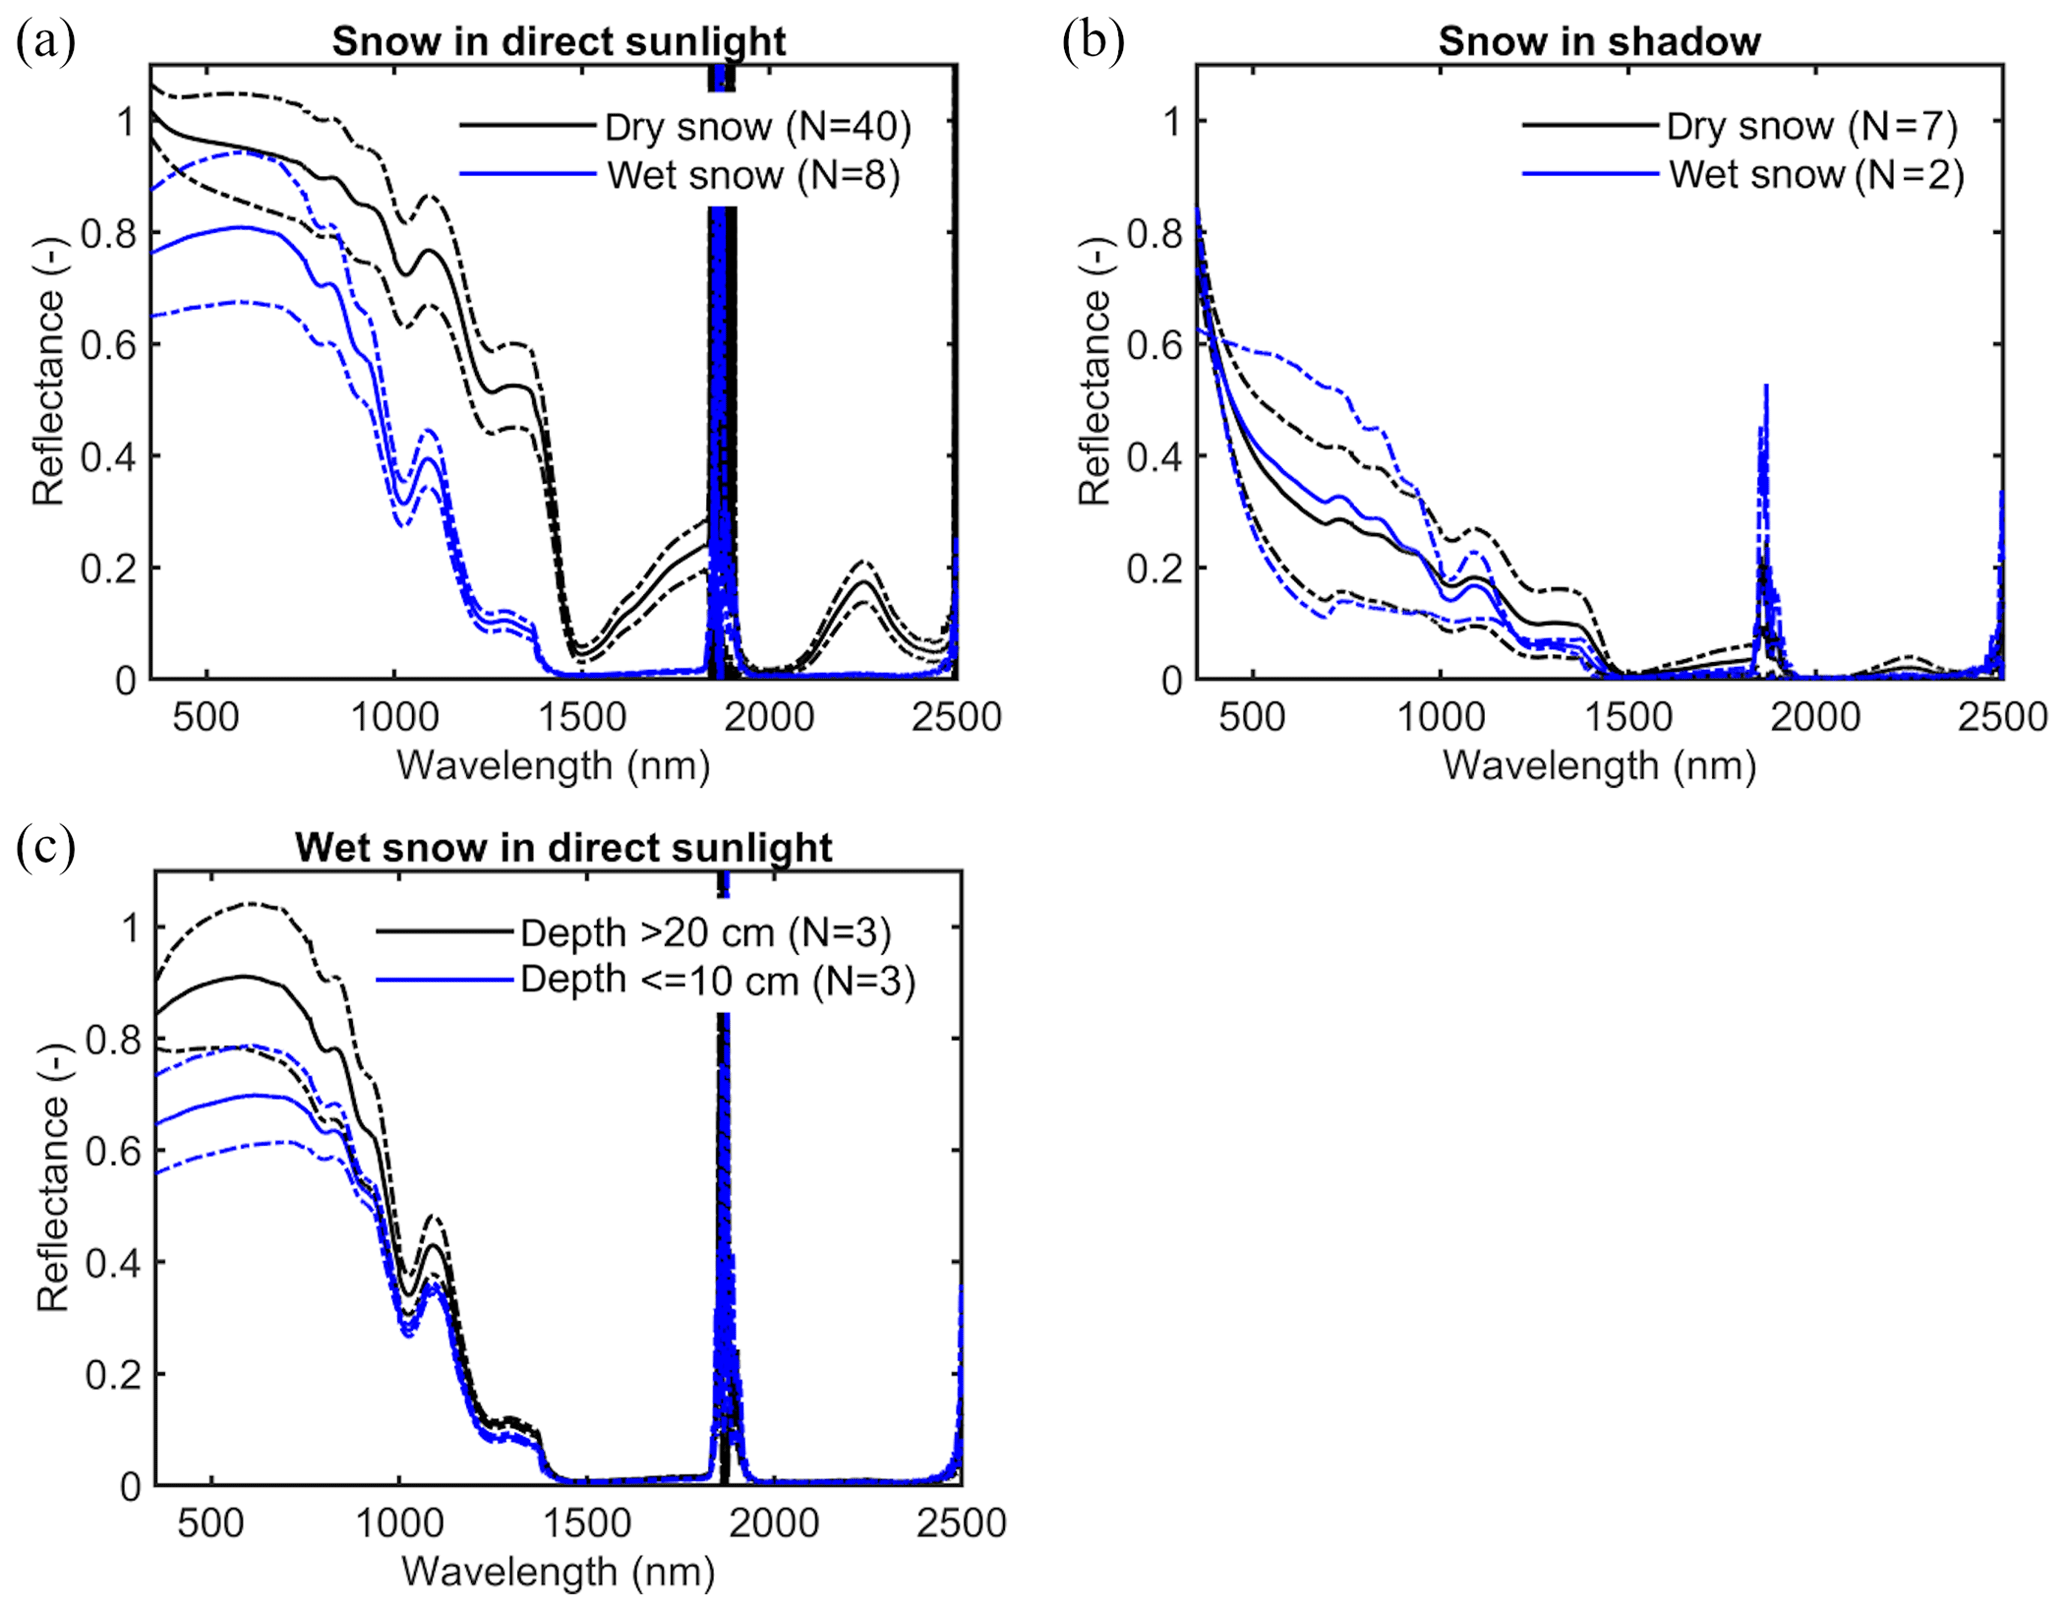
Figure 8Field reflectance measurements of snow. Cloudiness for all measurements was less than 3 octas. Dry snow (a–b) and wet snow (a–c) correspond to class 1 and classes 3–4 (wet and very wet snow) according to Fierz et al. (2009), respectively. Figures display the mean reflectance (solid line) and standard deviation (dashed line).
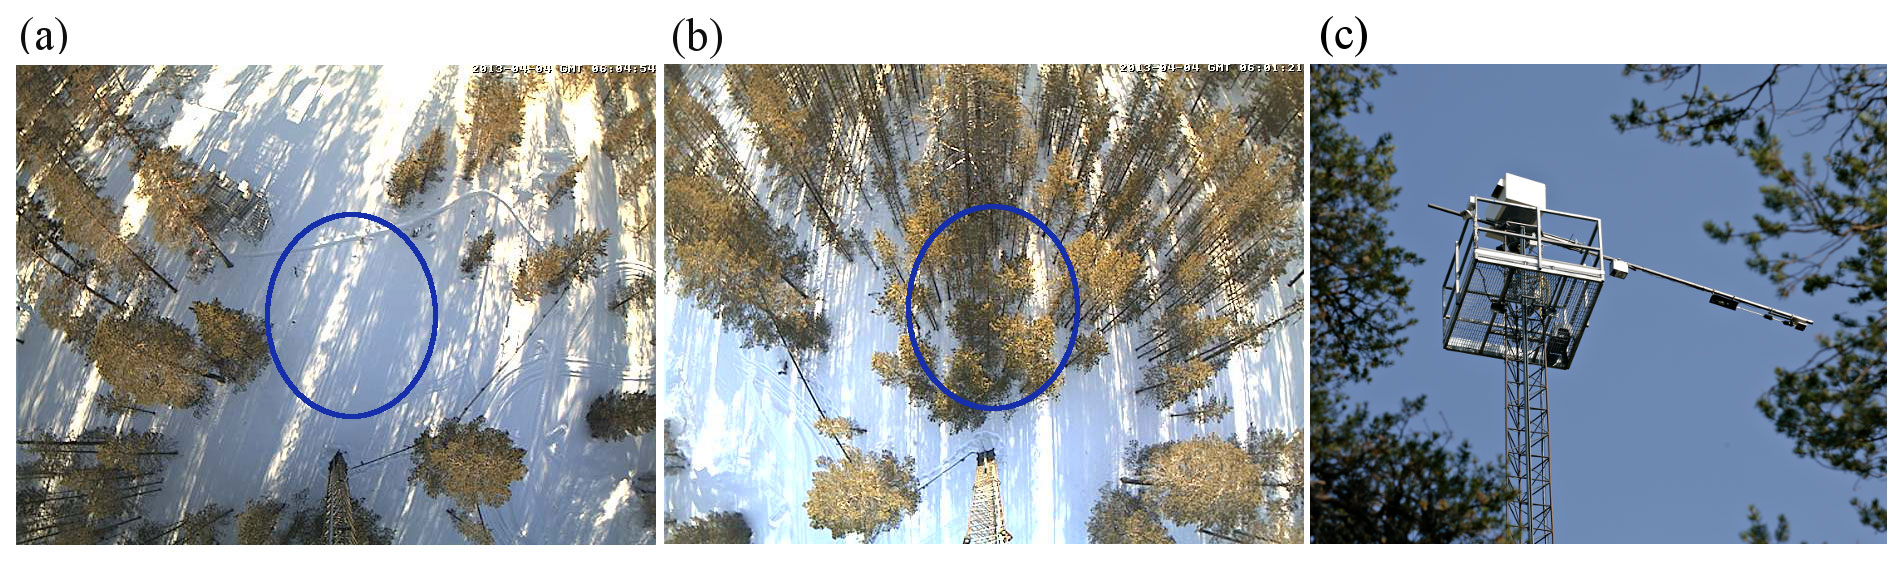
Figure 9Mast-spectroradiometer measurement areas of (a) a forest opening and (b) a sparse pine forest as well as (c) a photograph of the mast top structure.
One individual spectrum represents one instant measurement acquisition. During the automatization process threshold values were set to avoid collection of poor data. No measurements are executed during rain or snow events, high winds (gust >8 m s−1), or low air temperatures ( ∘C). To avoid measurements where the scene and reference spectra are collected in considerably different illumination conditions, the instrument collects spectra for 10 s before each measurement. Integrals of radiance over wavelength are calculated, and the ratio of the largest difference and the mean is returned and saved. The measurements are collected based on a set illumination change threshold value (indicated by Δ), currently set to 10 %. This allows further selection of spectra based on stricter illumination standards.
The mast-borne reflectance spectra for two measurement areas, sparse pine forest and forest opening during spring 2013 were resampled to correspond to MODIS (Moderate Resolution Imaging Spectroradiometer) band 4 (545–565 nm), which is essential for snow mapping from satellites (Fig. 10). In the resampling the corresponding wavelengths from the mast-borne spectra were chosen, and weighted averages calculated by using the relative spectral response function (RSR) provided by the data provider. The time series describes both the diurnal and within-season changes in reflectance. Measurements for clear-sky and diffuse illumination conditions were separated. The observed values for forest opening are high compared to forest until the end of the snow season. The forest opening scene during the full snow cover is composed of a snow field only, whereas in the pine forest area the reflectance is dominated by the forest canopy. The casting shadows from the surrounding trees increase the reflectance variability especially for the forest opening. Considerable diurnal variation in snow reflectance during the snow cover period is also seen in diffuse illumination conditions (Fig. 10b). With automatic measurements the number of observations can be increased.
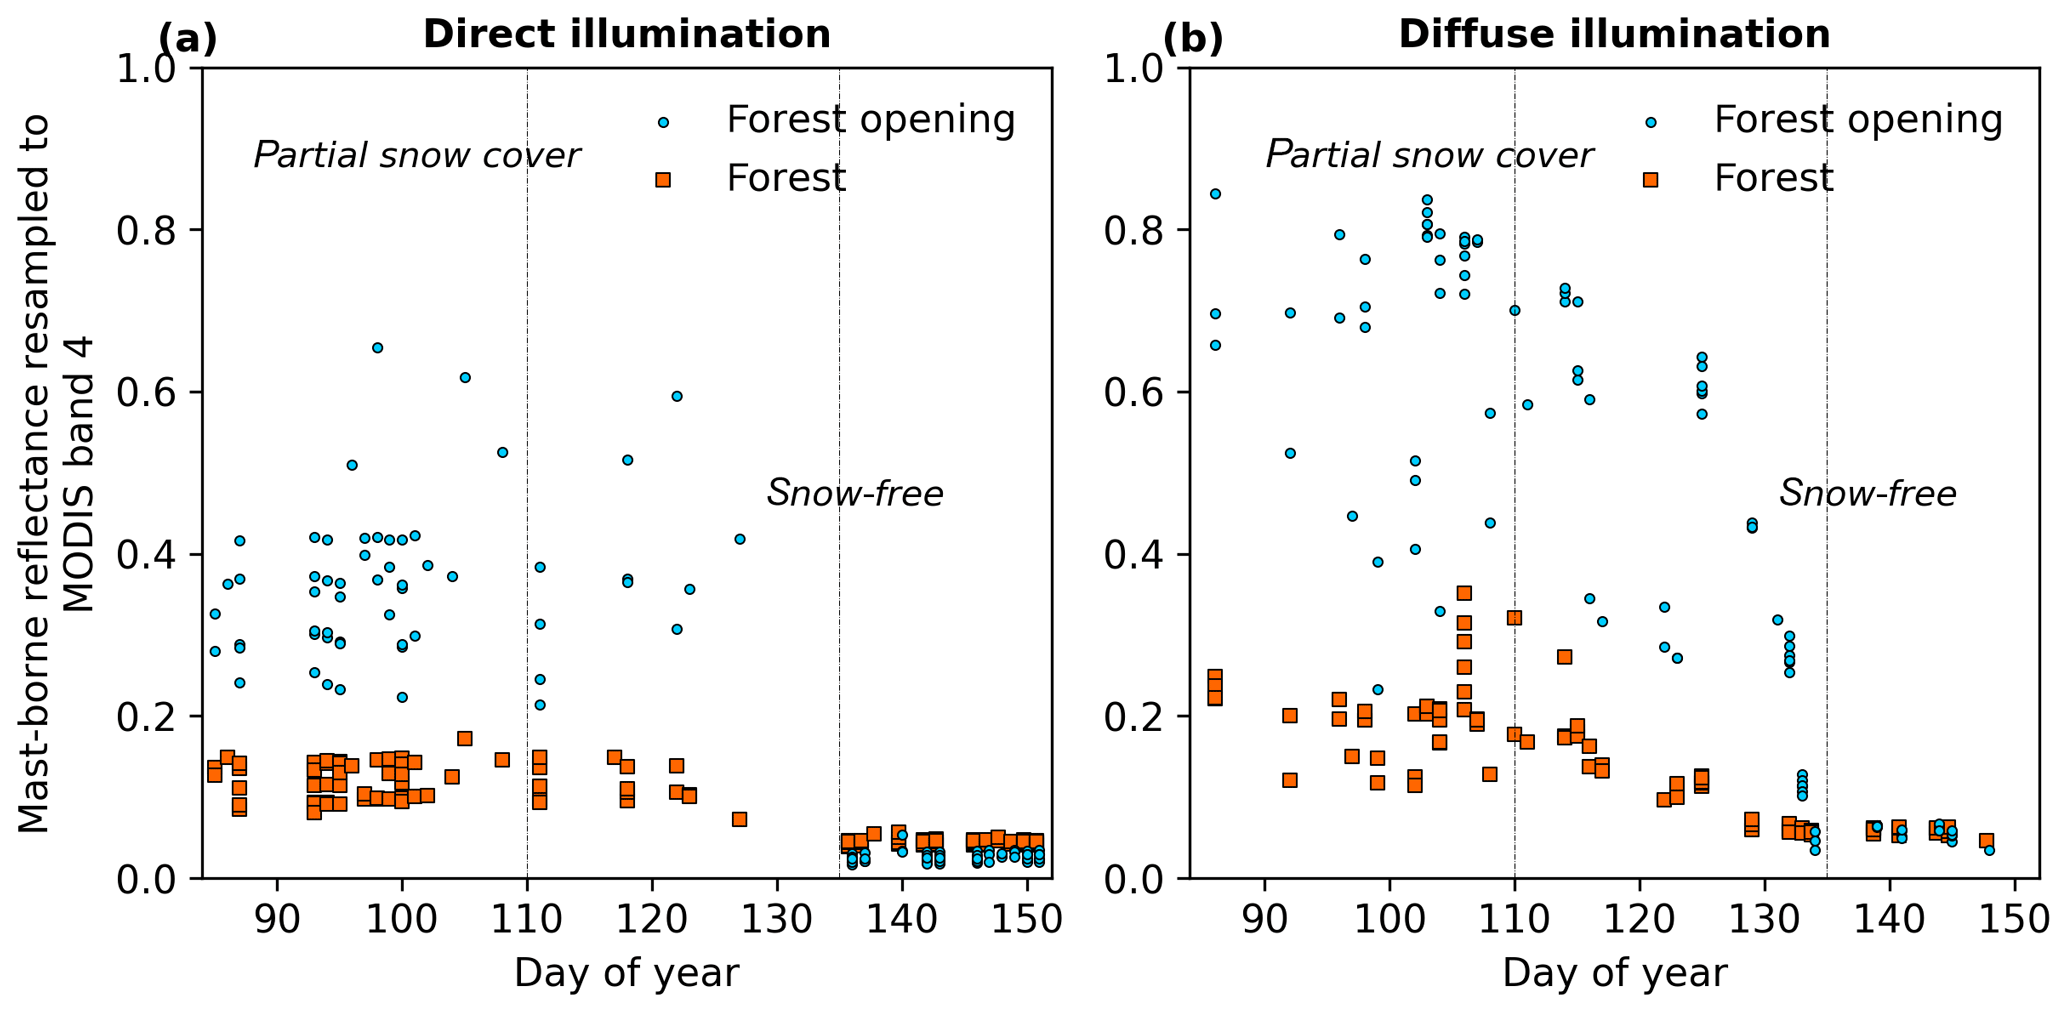
Figure 10Mast-spectroradiometer observations from both forest and forest opening during the spring of 2013 resampled to correspond to MODIS band 4 (545–565 nm) reflectance in (a) direct (cloudiness 0–2∕8) and in (b) diffuse (cloudiness 7–8∕8) illumination conditions.
3.4 Airborne spectrometer survey of snow and snow-free ground
Two airborne spectral imaging campaigns were organized in Finnish Lapland. The purpose was to investigate the effect of forest canopy on optical remote sensing signals from snow-covered surfaces. The first campaign was organized in Sodankylä on 18 and 21 March 2010 and the second in Sodankylä and in Saariselkä on 5 May 2011. In both campaigns airborne hyperspectral data were acquired with the AisaDUAL imaging spectrometer manufactured by SPECIM. The technical details of AisaDUAL sensors are presented in Table 1. The data record contains 10 m resolution reflectance mosaics of the flight lines for the bands 555, 645, 858.5 and 1640 nm for all measurement days and for both (Sodankylä and Saariselkä) study sites (Table 2).
During the first campaign, in 2010, the ground was covered by a thick (>70 cm) dry snow layer. On 18 March, the trees were snow-free and the last clear snow fall event, based on the observations from the Sodankylä weather station, was on 3 March; therefore the snow on the ground was several days old, while on 21 March, the trees were snow-covered and the snow on trees and on the ground was newly fallen. All measurements were carried out in direct illumination conditions (0∕8 to 2∕8 cloud cover). The AisaDUAL spectrometer was installed in a helicopter (Fig. 11). To convert the measured airborne radiances to reflectances, the concurrent mast-borne Spectralon radiances were utilized to determine the incoming radiation at the particular wavelength. To get the same reflectance level with the mast-borne observations, calibration coefficients were determined and utilized for the AISA data (Heinilä et al., 2014).
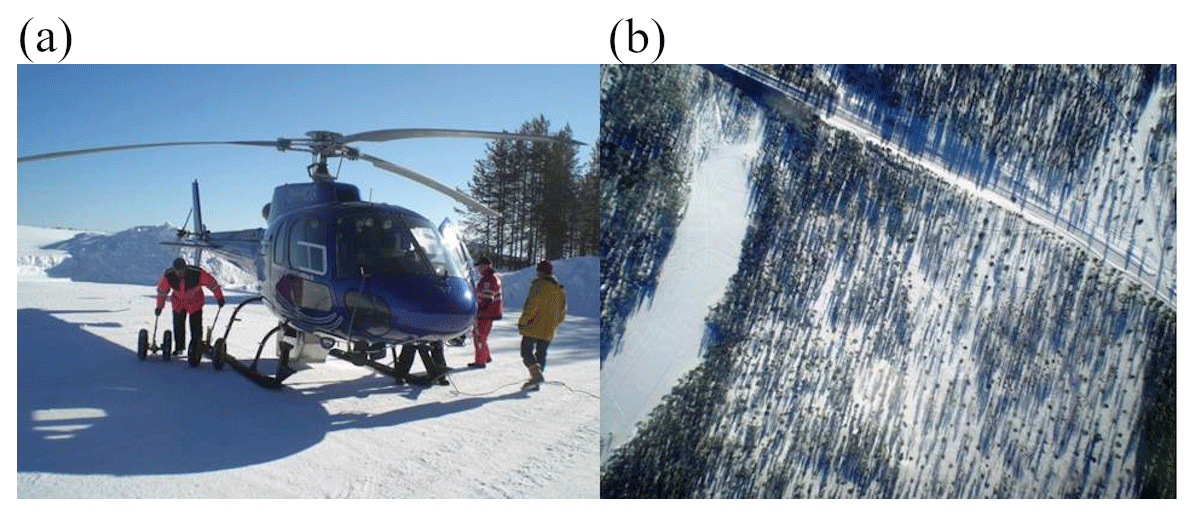
Figure 11(a) In March 2010 the AISA acquisition was made from a helicopter. The AISA sensor was attached in a box mounted on the bottom of the helicopter. In the bottom of the box was a hole for the sensor. (b) The photo taken from the helicopter on 21 March 2010.
During the second campaign, in 2011, the spring snow melting was ongoing and first snow-free patches had appeared. Snow depth varied between 0 and 30 cm at the Sodankylä site and between 0 and 60 cm at the Saariselkä site. Additionally, more snow-free pixels were found in Sodankylä than in Saariselkä. The measurement setup followed the earlier campaign. The measurements were carried out under direct illumination (cloud cover 0∕8) in Sodankylä and under diffuse illumination (cloud cover 7∕8) in Saariselkä. The reflectance level was obtained by applying a real-time fibre-optic downwelling irradiance sensor (FODIS) (Heinilä et al., 2019b). In both campaigns the Oxford Technical Solutions RT4000 GPS/INS was utilized to provide high-accuracy position measurements with low drift rates.
The imaging spectrometer data were radiometrically and geometrically corrected by using the SPECIM's CaliGeo tool in the ENVI software. Measurements from Saariselkä were additionally corrected with the digital elevation model KM10 (Finnish national digital elevation model by the National Land Survey of Finland) with a pixel size of 10 m×10 m and elevation resolution of 1.4 m. The bands 555, 645, 858.5 and 1640 nm were extracted from the original spectra by using the band-specific FWHM (full width at half maximum) criterion corresponding to MODIS bands. For these bands the original 80 cm resolution data were filtered with a mean filter using 12×12 window corresponding to a pixel size of 10 m×10 m.
As an example, Fig. 12 shows reflectance values on 5 May 2011 observed over different land cover types during partial snow cover along the AisaDUAL flight line. At the very end of the spring melting the observed reflectances are relatively low in all land cover types even with 50 %–60 % snow patchiness.
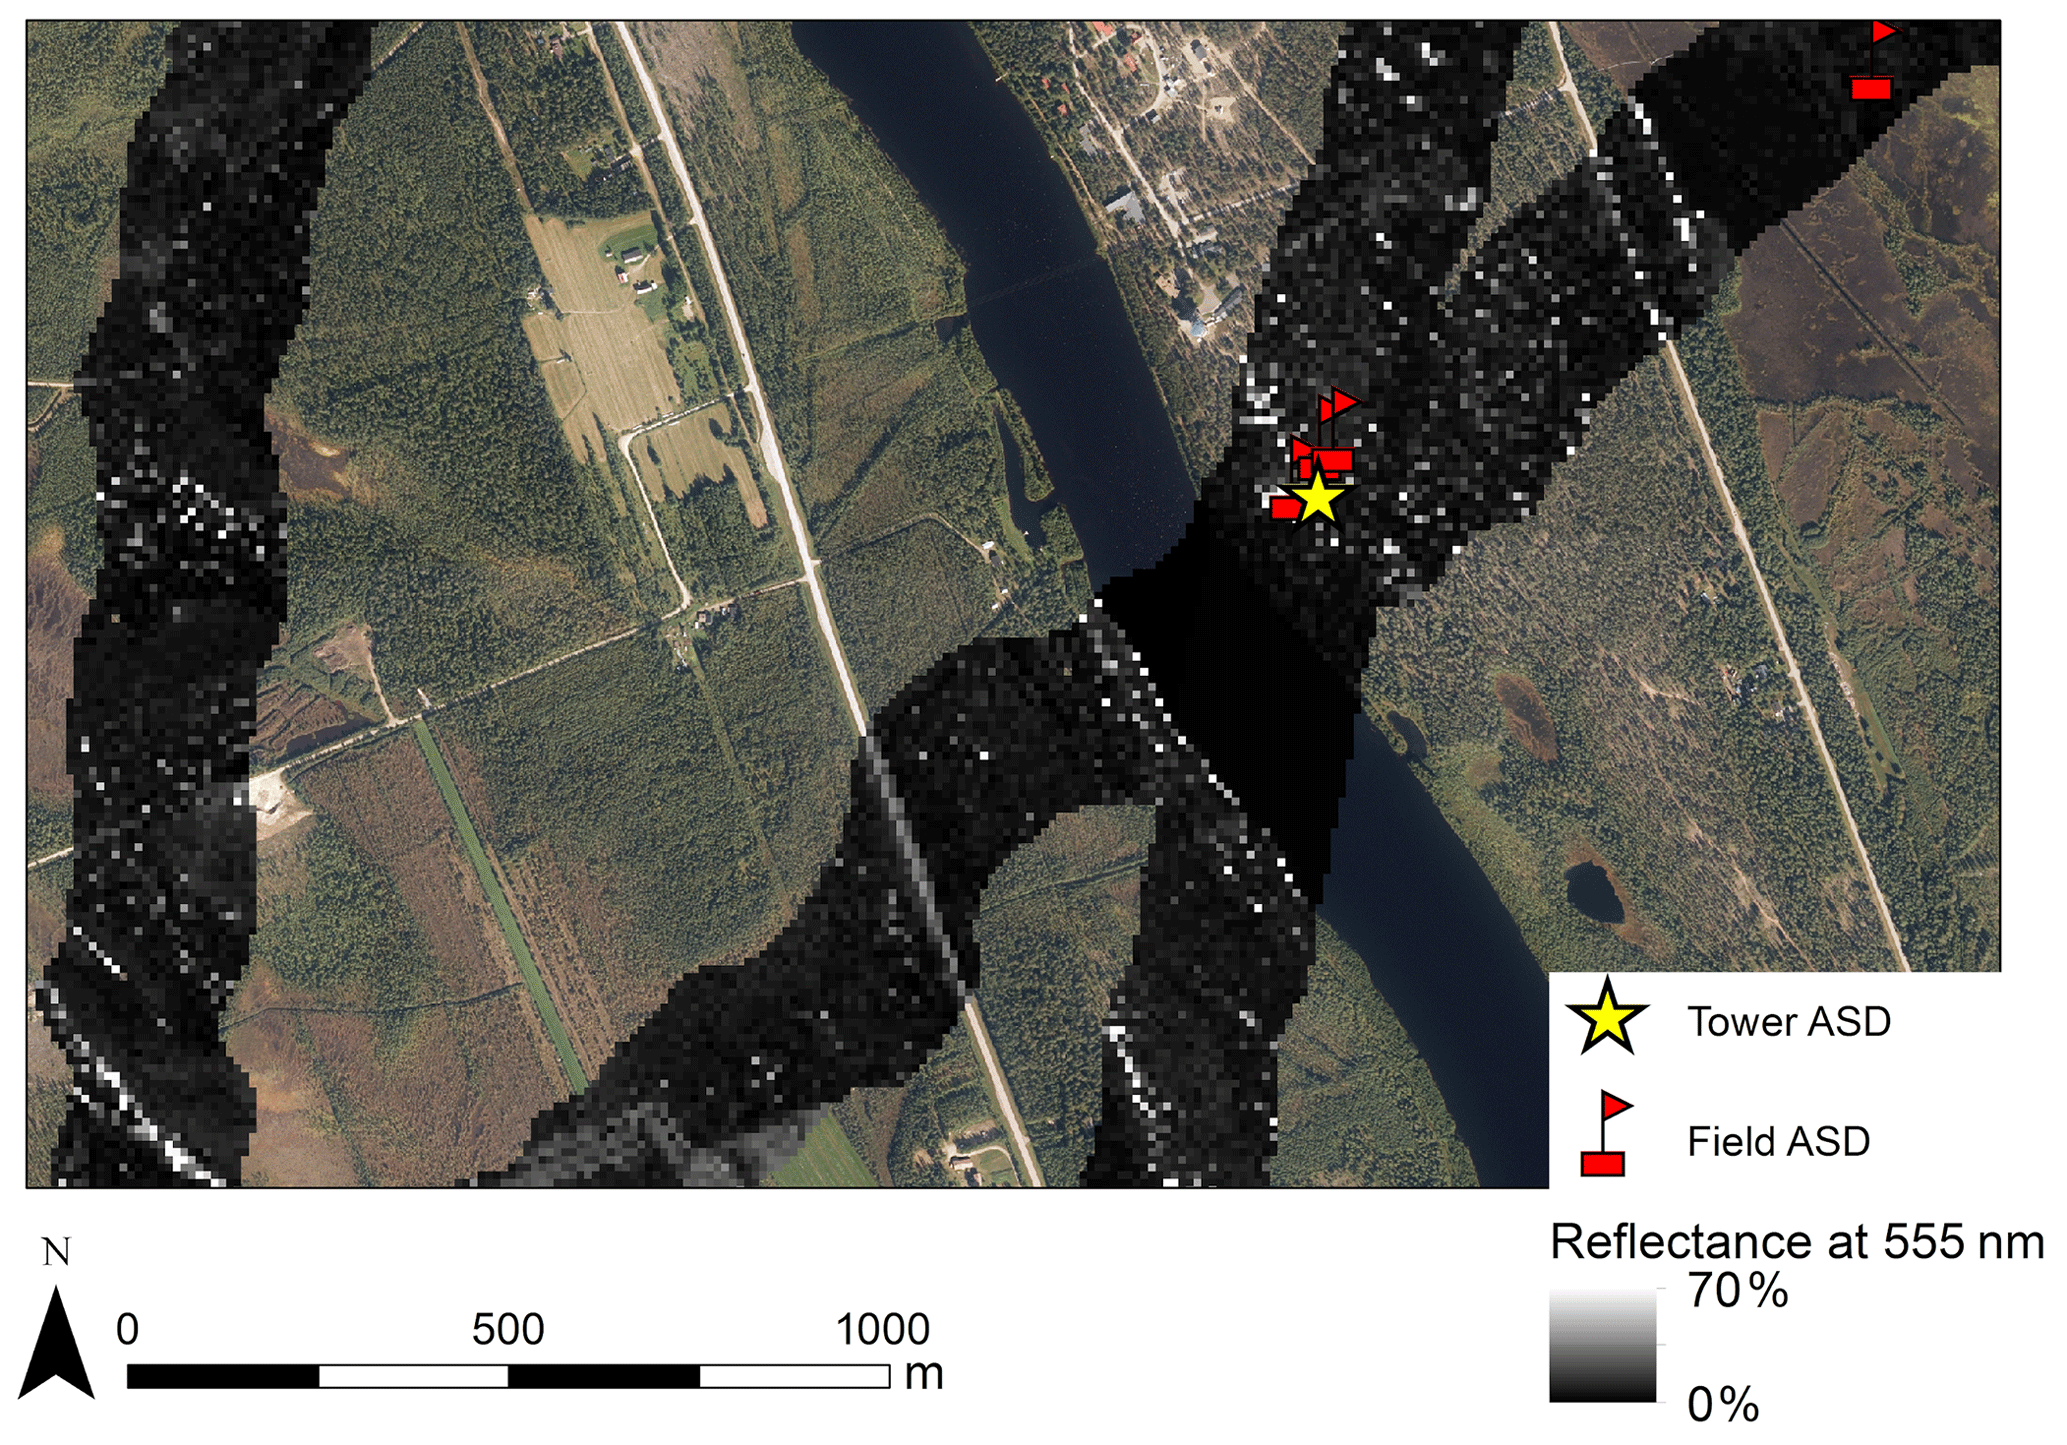
Figure 12Airborne spectrometer reflectance at band 555 nm on 5 May 2011 at 10 m resolution. An orthophoto from summer time conditions is shown in the background (© National Land Survey of Finland, December 2018).
3.5 Reference measurements
With each case of measured spectra of snow and open ground targets described above, reference in situ measurements and observations of weather conditions, location characteristics and snow properties were conducted to help to interpret the changes seen in the measured spectra (Table 2). The portable field measurements and the accompanied in situ data serve as reference information also for the airborne measurements (overlapping in time). The prevailing weather conditions were logged while making the reference observations. These included measurement of air temperature at 2 m height and observation of cloud cover in octas. For the mast measurements, cloud cover (in octas, Vaisala CT25K laser ceilometer), air temperature at 2 m (10 min average) and wind speed in gust at 22 m (10 min maximum) from an automatic weather station were accompanied with the measured spectra. Since the measurement automatization in 2012, the Δ values, describing the illumination change between the target and the reference measurement, were also added as reference data for the measured spectra. The mast measurement area was photographed with a wide-angle digital camera after each spectral measurement for target characteristics description. Although no other specific reference data were acquired for the mast observations, the extensive collection of automatic and manual in situ observations from the IOA site is available, including weekly snow pit measurements collected along the Sodankylä manual snow survey programme (Leppänen et al., 2016). As the field measurements were also conducted in different terrain, some information was collected about the surroundings, namely land cover type and snow patchiness. The snow properties logged in the reference data were snow temperature from different depths, layering of snow, geometric snow grain size, type and specific surface area (SSA), observed and measured snow water content, snow density and impurities/organic litter in snow. The methods and parameters varied somewhat between the laboratory and field reference data. The reference data for laboratory and field measurements are summarized in Table 3.
4.1 Error and uncertainty
The target scene reflectance inside the satellite footprint, recorded by a remote sensing instrument, is a combination of spectral information of several endmembers which complicates the data interpretation. Thus knowledge of the spectral reflectance characteristics of the target endmember (e.g. snow) as well as the combined effect of several contributing endmembers (e.g. forest and open ground) is needed. Data of the same quantity at several scales allows for the accumulation of understanding from reflective properties of an individual tree branch or snow type to scene reflective properties observed at a mast scale to a scale of an optical satellite footprint of several hundred meters. As the sources of error and uncertainty are variable, data at multiple scales also benefit the recognition and quantification of inaccuracies in the remotely sensed information.
The spectroscopy measurements are affected by manifold factors leading to error and uncertainty in the observations and therefore complicating the understanding of the effects of the measured target on the propagation of electromagnetic radiation. These factors stem partly from the instrument characteristics and partly from prevailing conditions. Spectral and radiometric calibration and stability characterization are required to address the effects of the instrumental uncertainties. The optimal sampling procedure appropriate for the considered application should be chosen and the common measurement protocols and standards followed. The imperfections in the reflectance calibration need to be recognized, and the effect of uncontrolled factors, such as changing illumination conditions, should be minimized and documented (Hueni et al., 2017). The measurements of reflectance properties of snow and snow-free ground targets in different spatial scales have enabled the estimation of the systematic error involved in satellite algorithms for snow retrieval (Salminen et al., 2018). In order to use the subordinate scale, the relevant error sources need to be identified and preferably quantitatively estimated. Here the sources of measurement error and uncertainty of the described datasets are discussed.
In the laboratory conditions the measurements are highly controllable. The external error sources can therefore be minimized. In such conditions the precision of the measurements can be estimated based on the repeated measurements of a reference Spectralon panel. The integrated precision is determined by (Hannula and Pulliainen, 2019)
where S is the precision of the calibration with light zenith angle θ, and LsN is the standard deviation of the Spectralon radiance acquisitions (n=10–30) at wavelength λ for individual reference panel measurements 1−N. The precision of the laboratory measurements was lowest in the detector edges (1000 and 1800 nm) and at the both ends of the spectral range. Excluding these areas, the precision varied roughly between and W m−2 sr−1 nm−1 for 470–830 and 1200–1790 nm and between and W m−2 sr−1 nm−1 for the last detector (1800–2300 nm) due to lower signal-to-noise ratio. The precision values describe the integrated inaccuracy due to instrument instability (in all measurements the instrument was left to warm up for 30 min at minimum) and lamp irradiance variability (±0.1 %). In addition, there may be other known and unknown systematic and random sources of error such as possible stray light from any reflecting surface and inaccuracies in the desired measurement geometry. During the portable field observations, real-time reflectance spectra were collected (no separate Spectralon radiances were saved), whereas the mast-borne and airborne observations represent only one measurement acquisition. Thus, similar estimates of the measurement precision for field, mast-borne or airborne conditions were not possible to define. Earlier studies have shown that the uncertainty characterizations made in laboratory conditions can remarkably differ from those derived in the field (Anderson et al., 2011).
Correct calibration is essential to obtain high-quality reflectance data. As such, the uncertainty at all scales of the data record presented here is related to the uncertainty in the calibration. In the laboratory, this is mostly related to the imperfect Lambertian characteristics of the Spectralon panel. Sandmeier et al. (1998) and Rollin et al. (2000) have shown that Spectralon panels have anisotropic reflectance characteristics depending on view and illumination geometry. This causes some systematic (±) uncertainty in the absolute reflectance values in this data record. In the airborne, mast-borne and portable field data the uncertainty and error in the calibration is added by the possibility of the panel degradation. The degradation level of the reference panel can be estimated by calibration tests against a laboratory standard repeated in time (see Sect. 2.2). For successful calibration, it is also important that the panel is absolutely horizontally aligned. In portable field observations, a tripod with a bubble level was used to reduce the error from panel alignment which, according to earlier demonstrations (Hueni et al., 2017), should lead to a deviation of less than 1∘ from the horizontal alignment.
The measurements in field conditions, including the mast-platform and airborne measurements, are more susceptible to changes in the external conditions. The field measurements are affected by the naturally varying illumination, atmospheric composition, and measurement geometry but also by the possible reflective or obstructive objects in the measurement surroundings. In field measurements the observed target (directional) radiation may change without any changes in the target properties if the distribution of irradiation over the hemisphere is changed (Kriebel, 1976). This is due to the anisotropic reflective properties of natural surfaces. Under clear-sky conditions, changes in the incident irradiance are governed by the changes in Sun zenith angle and the optical depth of the atmosphere (Goetz, 2012; Kriebel, 1976). To minimize these effects the frequency of Spectralon measurements should be adjusted according to the stability of the illumination (see Sect. 2.2) and measured near or at the same location as the target (Goetz, 2012; Mac Arthur and Robinson, 2015). In ideal case the measurements are executed around the local noon if the purpose is not to study the effect of changing illumination conditions, as in the mast-borne measurements. Accordingly, any nearby objects, including the observer, will affect the spectral measurements by blocking part of the diffuse irradiance and on the other hand by reflecting the downwelling (direct and diffuse irradiance) and upwelling (reflected from ground) radiance towards the target (Kimes et al., 1983). If the location of these objects remains the same in relation to the target and the Spectralon, no error is produced, but this is rarely the case in the field. This speaks in favour of fixed installations, such as mast-platform, where at least the measurement setup itself remains unchanged (Hueni et al., 2017). In the portable field measurements, the tripod with the extended arm obscured a part of the diffuse skylight illuminating the target. This effect has not been quantified or corrected in our measurements. The airborne measurements are affected by the adjacency effect in the heterogeneous areas where top of atmosphere (TOA) radiance is decreased over bright pixels and increased over dark pixels (Otterman and Fraser, 1979). This can be reduced by calibrating the TOA radiances using surface radiances from the same target as was done for the AISA radiances in March 2010. The effect of the external factors may become mixed with the reflectance variability caused by the target properties, such as snow characteristics, and thus make conduction of field measurements complex. In field measurements, the uncorrected irradiance levels and other external sources of error together with the BRDF (bidirectional reflectance distribution function) characteristics of the target may compensate for each other, resulting in less variable reflectance (Sandmeier et al., 1998). These interactions are target specific and are typically hard to predict (Sandmeier et al., 1998). Thus, the reflectance observed in laboratory conditions can be more reliably interpreted to be originating from the target's properties.
The measurement scale needs to be taken into account when interpreting the results as the chosen sensor-to-target distance combined with spatial heterogeneity of the target may yield very different outcomes (Milton et al., 2009). This was demonstrated in Fig. 6 where a shift of the pine and spruce sample boxes under the measurement head was followed by a clear change in the target reflectance. Accordingly, a change in Sun azimuth angle over an asymmetric surface (such as forest canopy) without change in the target properties will yield a different reflectance value (Kriebel, 1976). Thus, the representativeness of the dataset has to be judged with respect to the temporal and spatial sampling and the aim of the study. Instrument characteristics may introduce uncertainty. Photodiode detectors utilized in spectroradiometers have temperature-dependent sensitivities (Hueni and Bialek, 2017; Starks et al., 1995). In the mast-borne and in the portable field measurements the spectroradiometer was placed inside an insulated box for protection and to decrease the variability of the ambient temperature. The spectroradiometer utilized in laboratory and portable field measurements has been regularly calibrated by the manufacturer. The mast-borne spectroradiometer has been calibrated on a less regular basis, but the changes of the instrument responsivity have been monitored by yearly laboratory tests to reveal any changes in the instrument behaviour. Some instrument characteristics are hard to determine in detail. ASD spectroradiometer FOVs have shown to differ from the nominal FOV reported by the manufacturer, and the sensor responsivity has shown to be nonuniform within the FOV (Mac Arthur et al., 2012). This complicates the understanding of the relationship between the observation and the target in heterogeneous areas (Hueni et al., 2017). These examples illustrate the complexity of the factors affecting the (field) spectroscopy measurements and highlight the need for comprehensive metadata of the measurement sites to assist the data interpretation.
4.2 Reflectance of same targets measured by different platforms
Comparison of observations collected by different platforms is not always straightforward. Figure 13 presents surface reflectance spectra observed at different scales for snow-covered lake ice (a) and forest measurement area of the mast-borne platform during dry snow conditions (b). For Fig. 13b the mean of pine branch reflectance measurements, measured in a laboratory, is also shown. The motivation behind the comparison of measurements collected at different scales is to understand how the band reflectance value measured for a coarse-resolution remote sensing image pixel is composed for different types of heterogenous landscapes. The same motivation behind these studies may give rise to problems in future data analysis. For a homogeneous area with direct and stable illumination conditions, comparing measurements observed from a height of 800 m and 45 cm and with a spatial resolution of 10 m and 20 cm may give information, for example, from the success of the atmospheric correction. In Fig. 13a there are some differences in the snow reflectance observed at different scales, but the airborne values still fit within the standard deviation observed on the ground in the portable field measurements. When more heterogeneous surfaces, such as the forested area in Fig. 13b, are compared, even small differences in the view angles (nadir for airborne AISA and 11∘ for mast-borne observations) yield differences, which, although giving information about the effects of these differences, also complicate the comparison as it is more difficult to distinguish the effect of one case from another. From the different view angles in Fig. 13b it follows that the forest cover for the same area observed by the airborne platform is 40 %, whereas it is 48 % when observed by the mast-borne platform. The proportional areas of shadowed surfaces and whether the sensor is mostly seeing pine branches or both tree branches and tree trunks are also affected by the view angle. Pointwise field measurements and temporally restricted laboratory observations can be, however, successfully used to characterize the behaviour of larger-scale measurements via modelling (Niemi et al., 2012). Many studies have researched the spatial representativeness of observations collected at different scales for both homogeneous and heterogeneous surface types (e.g. Román et al., 2009; Wang et al., 2014).
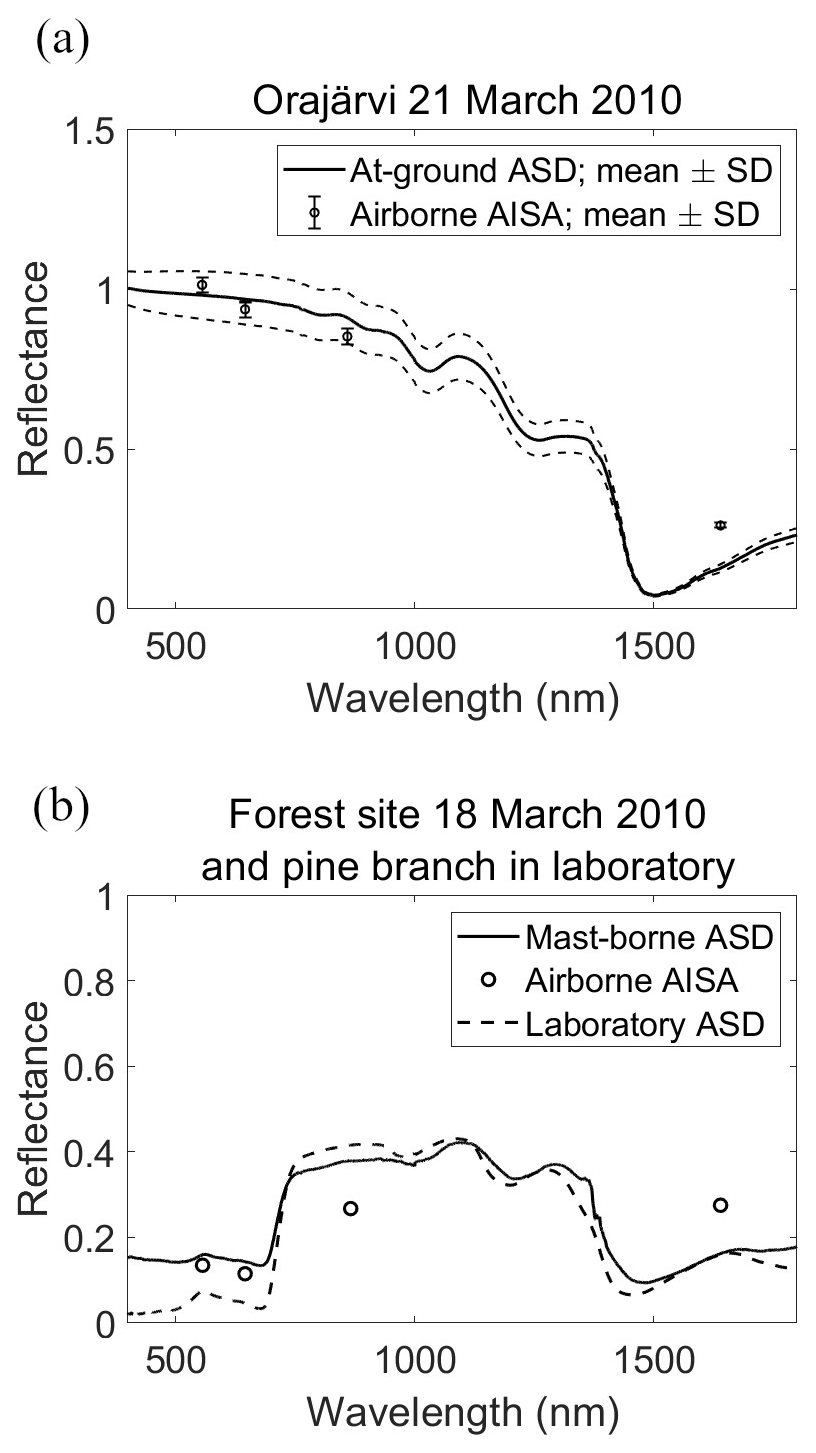
Figure 13(a) Snow reflectance on lake Orajärvi measured by airborne (AISA) and portable field platforms. (b) Reflectance of the forest measurement area observed by the mast-borne (spectra) and airborne (four bands) platforms during dry snow conditions and mean of pine branch measurements observed in a laboratory.
4.3 Examples of data usage
In the laboratory experiments the aim was to characterize the variation of the spectral reflectivity of pine and spruce and different snow types (i.e. spectral endmembers) with controlled illumination, a characteristic which cannot be reached in field conditions. Since the pine and spruce sample reflectances at this scale can significantly change depending on the orientation of the target in relation to the measurement head, a number of observations with varying orientations were taken to describe the average variance. Both laboratory and field observations can describe only part of the spatial and temporal variability in the targets' spectral reflectance as only a specific number of measurements at some specific times can be measured. With continuous mast measurements a time series of reflectance spectra of the same target area can be constructed offering data to study the changes in the spectra of a specific land cover type in varying illumination and atmospheric conditions and with seasonally varying target characteristics. In comparison, the airborne data provide the variability between several boreal land cover types. Scaling upward with mast- and airborne data records provides one more link between the remotely sensed and pointwise field observations. The presented data record can be considered representative as it is measured with various temporal and spatial resolutions and has the specific advantage of being coincident in time and from the same locale.
The data record has been utilized in several feasibility studies of satellite snow-covered-area mapping, with most of them focusing on forested areas. The changes in portable field spectra due to snow properties were studied by Salminen et al. (2009) and Niemi et al. (2012). They showed that snow wetness had strong effect on the forward scattering due to the increase in the effective grain size in the optical region (Wiscombe and Warren, 1980). This produced high variability in the reflectance spectrum (Niemi et al., 2012). Wet snow transmits light more efficiently, and therefore, during the spring melting conditions, snow depth starts to play a more significant role in altering the reflectance. The mean snow reflectance can drop from 1.00 to 0.7, when a threshold of 20 cm snow depth is crossed (Salminen et al., 2009).
Salminen et al. (2009) used their own pointwise portable field spectroradiometer measurements to statistically characterize the variability of boreal ground reflectance and mast-borne time series to study the comparability of pointwise and scene reflectance measurements aiming at optimal band selection and assessment of accuracy when applying the SCAmod method, an algorithm for FSC detection. They concluded that ground reflectance variability can induce errors up to 10 %–12 % in SCAmod estimations and suggested the use of wavelengths 400–480 nm for SCAmod (and other similar) methods for the best detection of snow. The work was continued by Niemi et al. (2012), who utilized the mast-borne observations of a forest and forest opening to investigate the boreal forest scene reflectance behaviour by means of NDSI (normalized difference snow index), NDVI (normalized difference vegetation index) and MODIS bands during the springs of 2010 and 2011. In the forest opening the band indices were well functioning, but at the forest scene they were strongly affected by the illumination geometry. The study of the spectral index behaviour was continued by investigating the linkage between the scene reflectance and the forest canopy characteristics (coverage, tree height) by concurrent use of field, mast-borne, and airborne spectral measurements and LIDAR data (Heinilä et al., 2014, 2019b). Airborne reflectances from snow-covered surfaces were shown to be highly dependent on forest characteristics. In Pulliainen et al. (2014) the mast-borne measurements from 2010 and 2013 and the airborne data record from 2010 were once again utilized to test a zeroth-order radiative transfer approach for snow monitoring from optical remote sensing data. By means of these data records, the spatial and temporal variability of boreal forest reflectance could be investigated and the model validated at several different scales.
In forthcoming research the mast-borne data record will be further utilized to analyse the representativeness of the mast measurements for the larger boreal forest area in FMI-ARC surroundings and to assess the feasibility of the latest optical satellite data provided at higher, 10–30 m spatial resolution. Spectral data at multiple scales offer a possibility to assess the effect of atmospheric correction applied in remote sensing data processing. Meteorological observations as well as manually and automatically measured snow properties from FMI-ARC have also been used to drive and evaluate snow models (Essery et al., 2016; Ménard et al., 2019). Driving models benefits from (hemispherical) albedo measurements, but also reflectance quantities presented here may be of interest for the snow modelling community. Although the collection and analysis of the spectral data record has been driven by the aim to improve optical snow mapping methods, multiple other possibilities for data usage exist. The mast-borne data can serve as a direct validation or cross-reference information for unmanned aerial vehicle (UAV)-borne spectral measurements, and the spectral range (Table 1) is valid for phenology or vegetation spring green-up studies.
The data record is made available through a community in the Zenodo repository service (https://www.zenodo.org/communities/boreal_reflectances, Hannula et al., 2019). Each dataset of a distinct scale has its own unique digital object identifier (DOI) – laboratory: https://doi.org/10.5281/zenodo.3580078 (Hannula and Heinilä, 2018a); field: https://doi.org/10.5281/zenodo.3580825 (Heinilä et al., 2019a); see also https://ckan.ymparisto.fi/dataset/spectrometer-measurements-of-snow-and-bare-ground-targets-and-simultaneous-measurements-of-snow (last access: May 2019); mast-borne: https://doi.org/10.5281/zenodo.3580096 (Hannula and Heinilä, 2018b); and airborne: https://doi.org/10.5281/zenodo.3580451 (Heinilä, 2019a) and https://doi.org/10.5281/zenodo.3580419 (Heinilä, 2019b). Two DOI numbers for the AISA datasets were created due to differing data processing methods in 2010 and 2011. The ASD spectra as well as the accompanied reference measurements are organized in ASCII files with the metadata information attached in the file header (laboratory, mast-borne and airborne) or as a separate metadata file (portable field). The airborne AISA reflectances are provided as geolocated GeoTIFF files. Digital images for the mast-borne measurement scenes are organized in yearly folders and packed into a zip file. For some spectra the digital images are missing due to technical problems. In 2010–2011, when the mast-borne measurements were still collected manually, the time gap between the measurement and the digital image varies. However, images temporally far apart are sometimes included in the dataset as they still give some information about the measurement target for the user. The image file names have an associated time tag and an indication of the measurement target in the format YYYY-MM-DD_HHMMSS_forest/open. For further information, contact details are provided along with each dataset. The laboratory, portable field and airborne datasets have undergone quality check to include only the good-quality spectra or band reflectances. However, the users are encouraged to consider the sources of error and uncertainty discussed in Sect. 4.1. Only a very robust quality check, leaving out the most erroneous measurements, has been conducted on the mast-borne dataset. Any further filtering is left for the user as best fits the application. Users are also encouraged to give feedback on any issues with the datasets.
In order to establish new and improved optical snow mapping methods for boreal forested areas, detailed surveys of satellite scene reflectance contributors are required, as the relatively large satellite footprint may contain both fractional snow and forest cover. The spectral reflectance data record described here contains spectral observations of the main components (i.e. spectral endmembers) of a boreal landscape during spring: snow (dry, wet, shadowed), forest ground (moss, lichen) and forest canopy (spruce and pine, branches) corresponding to the atmospherically corrected estimate of surface reflectance from satellite data. The data record contains comparable observations at laboratory, field, mast-borne and airborne scales partially overlapping in time. In addition, the collection includes reference data collected in situ, along with spectral observations.
The main experimental site for data collection in Sodankylä, northern Finland, and the collection and measurement systems for each scale of data record were described in detail and data examples were given. The possible sources of error and uncertainty were discussed and estimated. So far, the data record has been used for various scientific studies, most of them focusing on the improvement of satellite snow cover detection in forested areas. However, the data record at various scales offers numerous other possibilities for data usage such as cross-reference information for UAV-borne spectral measurements or phenology and vegetation spring green-up studies.
HRH was responsible for the planning, coordination and conduction of the snow laboratory measurements; post-processed the mast-borne data for the period 2012–2018; wrote most of Sects. 3.1, 3.3 and 4–6; and was responsible for the overall writing work of the study as well as the submission process. KH was responsible for the coordination and execution of the pine/spruce branch laboratory experiments, post-processed the mast-borne data for the period 2010–2011 and took part in the collection of portable field spectral measurements. She post-processed the airborne data and wrote most of Sect. 3.4. KB took part in the collection of the portable field spectral measurements and post-processed the data, wrote most of Sect. 3.2, and generated the original idea of the article. OPM took part in the collection of the portable field spectral measurements and the writing work of the study. MS wrote most of Sects. 1 and 2. JP was behind the measurement idea of most of the datasets described and acted as the scientific supervisor of the paper.
The authors declare that they have no conflict of interest.
The data record has undergone some preliminary quality check but any further quality control is left for the user as best fits the purpose.
This work has been supported by the Väisälä foundation, Envibase (Ministry of Finance, Finland), SPECIM (Spectral Imaging Ltd.), and the Airborne Imaging Spectroscopy Application and Research on Earth Sciences (AISARES) graduate school of the University of Helsinki.
This research has been supported by the Maj and Tor Nessling Foundation (grant no. 201500276, 201600013 and 201700417), the European Commission Life+ programme (grant no. ENV/FIN/000133), and the Academy of Finland (grant no. CARB-ARC/285630).
This paper was edited by Jens Klump and reviewed by two anonymous referees.
ACIA: Arctic Climate Impact Assessment, ACIA Overview report, Cambridge University Press, 1020 pp., 2005.
AMAP: Snow, Water, Ice and Permafrost in the Arctic (SWIPA), Arctic Monitoring and Assessment Programme (AMAP), Oslo, Norway. xiv + 269 pp., available at: https://www.amap.no/documents/doc/snow-water-ice-and-permafrost-in-the-arctic-swipa-2017/1610 (last access: December 2019), 2017.
Anderson, K., Dungan, J. L., and MacArthur, A.: On the reproducibility of field-measured reflectance factors in the context of vegetation studies, Remote Sens. Environ., 115, 1893–1905, 2011.
Aoki, T., Aoki, T., Fukabori, M., Hachikubo, A., Tachibana, Y., and Nishio, F.: Effects of snow physical parameters on spectral albedo and bidirectional reflectance of snow surface, J. Geophys. Res., 105, 10219–10236, 2000.
Bänninger, D., Bourgeois, C. S., Matzl, M., and Schneebeli, M.: Reflectance Modeling for Real Snow Structures Using a Beam Tracing Model, Sensors, 8, 3482–3496, 2008.
Böttcher, K., Aurela, M., Kervinen, M., Markkanen, T., Mattila, O.-P., Kolari, P., Metsämäki, S., Aalto, T., Arslan, A. N., and Pulliainen, J.: MODIS time-series-derived indicators for the beginning of the growing season in boreal coniferous forest – A comparison with CO2 flux measurements and phenological observations in Finland, Remote Sens. Environ., 140, 625–638, 2014.
Brown, R. D. and Mote, P. W.: The response of Northern Hemisphere snow cover to a changing climate, J. Climate, 22, 2124–2144, 2009.
Brown, R. D. and Robinson, D. A.: Northern Hemisphere spring snow cover variability and change over 1922–2010 including an assessment of uncertainty, The Cryosphere, 5, 219–229, https://doi.org/10.5194/tc-5-219-2011, 2011.
Callaghan, T. V., Johansson, M., Brown, R. D., Groisman, P. Y., Labba, N., Radionov, V., Bradley, R. S., Blangy, S., Bulygina, O. N., Christensen, T. R., Colman, J. E., Essery, R. L. H., Forbes, B. C., Forchhammer, M. C., Golubev, V. N., Honrath, R. E., Juday, G. P., Meshcherskaya, A. V., Phoenix, G. K., Pomeroy, J., Rautio, A., Robinson, D. A., Schmidt, N. M., Serreze, M. C., Shevchenko, V. P., Shiklomanov, A. I., Shmakin, A. B., Sköld, P., Sturm, M., Woo, M.-K., and Wood, E. F.: Multiple Effects of Changes in Arctic Snow Cover, Ambio, 40, 32–45, 2011.
Choi, G., Robinson, D. A., and Kang, S.: Changing Northern Hemisphere snow seasons, J. Climate, 23, 5305–5310, 2010.
Colbeck, S. C., Akitaya, E., Armstrong, R. L., Gubler, H., Lafeuille, J., Lied, K., McClung, D. M., and Morris, E. M.: The International Classification for Seasonal Snow on the Ground, International Commission on Snow and Ice (IAHS), World Data Center A for Glaciology, University of Colorado, Boulder, CO, USA, 1990.
Derksen, C. and Brown, R.: Spring snow cover extent reductions in the 2008–2012 period exceeding climate model predictions. Geophys. Res. Lett., 39, L19504, https://doi.org/10.1029/2012GL053387, 2012.
Dietz, A. J., Kuenzer, C., Gessner, U., and Dech, S.: Remote sensing of snow – a review of available methods, Int. J. Remote Sens., 33, 4094–4134, 2012.
Dor, E. B., Ong, C., and Lau, I. C.: Reflectance measurements of soils in the laboratory: Standards and protocols, Geoderma, 245, 112–124, 2015.
Dozier, J., Green, R. O., Nolin, A. W., and Painter, T. H.: Interpretation of snow properties from imaging spectrometry, Remote Sens. Environ., 113, 25–27, 2009.
Essery, R., Kontu, A., Lemmetyinen, J., Dumont, M., and Ménard, C. B.: A 7-year dataset for driving and evaluating snow models at an Arctic site (Sodankylä, Finland), Geosci. Instrum. Method. Data Syst., 5, 219–227, https://doi.org/10.5194/gi-5-219-2016, 2016.
Fierz, C., Armstrong, R. L., Durand, Y., Etchevers, P., Greene, E., McClung, D. M., Nishimura, K., Satyawali, P. K., and Sokratov, S. A.: The International Classification for Seasonal Snow on the Ground, IHP-VII Technical Documents in Hydrology No. 83, IACS Contribution No. 1, UNESCO-IHP, Paris, 2009.
Frei, A., Tedesco, M., Lee, S., Foster, J., Hall, D. K., Kelly, R., and Robinson, D. A.: A review of global satellite-derived snow products, Adv. Space Res., 50, 1007–1029, 2012.
Gallet, J.-C., Domine, F., Zender, C. S., and Picard, G.: Measurement of the specific surface area of snow using infrared reflectance in an integrating sphere at 1310 and 1550 nm, The Cryosphere, 3, 167–182, https://doi.org/10.5194/tc-3-167-2009, 2009.
Goetz, A. F.: Making accurate field spectral reflectance measurements, ASD Inc., Boulder, CO, USA, 2012.
Hall, D. K. and Riggs, G. A.: Accuracy assessment of the MODIS snow products, Hydrol. Process., 21, 1534–1547, 2007.
Hannula, H.-R. and Heinilä, K.: Laboratory spectral reflectance measurements of pine/spruce twigs and snow, Zenodo, https://doi.org/10.5281/zenodo.3580078, 2018a.
Hannula, H.-R. and Heinilä, K.: Mast-borne spectral reflectance measurements of boreal landscape during spring, Zenodo, https://doi.org/10.5281/zenodo.3580096, 2018b.
Hannula, H.-R. and Pulliainen, J.: Spectral reflectance behaviour of different boreal snow types, J. Glaciol., 65, 926–939, 2019.
Hannula, H.-R., Heinilä, K., Böttcher, K., Mattila, O.-P., Salminen, M., and Pulliainen, J.: Laboratory, field, mast-borne and airborne spectral reflectance measurements of boreal landscape during spring, Zenodo, available at: https://www.zenodo.org/communities/boreal_reflectances/?page=1&size=20, last access: December 2019.
Heinilä, K.: Airborne spectrometer measurements from boreal snow-covered landscape, Zenodo, https://doi.org/10.5281/zenodo.3580451, 2019a.
Heinilä, K.: Airborne spectrometer measurements from boreal and tundra site during spring snow melt, Zenodo, https://doi.org/10.5281/zenodo.3580419, 2019b.
Heinilä, K., Salminen M., Pulliainen J., Cohen J., Metsämäki S., and Pellikka P.: The effect of boreal forest canopy to reflectance of snow covered terrain based on airborne imaging spectrometer observations, Int. J. Appl. Earth Obs., 27, 31–41, 2014.
Heinilä, K., Böttcher, K., and Mattila, O.-P.: Spectrometer measurements of snow and bare ground targets and simultaneous measurements of snow conditions, Zenodo, https://doi.org/10.5281/zenodo.3580825, 2019a.
Heinilä, K., Salminen, M., Metsämäki, S., Pellikka, P., Koponen, S., and Pulliainen, J.: Reflectance variation in boreal landscape during the snow melting period using airborne imaging spectroscopy, Int. J. Appl. Earth Obs., 76, 66–76, 2019b.
Hori, M., Sugiura, K., Kobayashi, K., Aoki, T., Tanikawa, T., Kuchiki, K., Niwano, M., and Enomoto, H.: A 38-year (1978–2015) Northern Hemisphere daily snow cover extent product derived using consistent objective criteria from satellite-borne optical sensors, Remote Sens. Environ., 191, 402–418, 2017.
Horton, S. and Jamieson, B.: Spectral measurements of surface hoar crystals, J. Glaciol., 63, 477–486, 2017.
Hueni, A. and Bialek, A.: Cause, effect, and correction of field spectroradiometer interchannel radiometric steps, IEEE J. Sel. Top. Appl., 10, 1542–1551, 2017.
Hueni, A., Damm, A., Kneubuehler, M., Schläpfer, D., and Schaepman, M. E.: Field and airborne spectroscopy cross validation – some considerations, IEEE J. Sel Top. Appl., 10, 1117–1135, 2017.
Kangas, M., Rontu, L., Fortelius, C., Aurela, M., and Poikonen, A.: Weather model verification using Sodankylä mast measurements, Geosci. Instrum. Method. Data Syst., 5, 75–84, https://doi.org/10.5194/gi-5-75-2016, 2016.
Kimes, D. S., Kirchner, J. A., and Newcomb, W. W.: Spectral radiance errors in remote sensing ground studies due to nearby objects, Appl. Optics, 22, 8–10, 1983.
Klein, A. G., Hall, D. K., and Riggs, G. A.: Improving snow-cover mapping in forests through the use of a canopy reflectance model, Hydrol. Process., 12, 1723–1744, 1998.
Kokaly, R. F., Clark, R. N., Swayze, G. A., Livo, K. E., Hoefen, T. M., Pearson, N. C., Wise, R. A., Benzel, W. M., Lowers, H. A., Driscoll, R. L., and Klein, A. J.: USGS Spectral Library Version 7: U.S. Geological Survey Data Series 1035, 61 pp., https://doi.org/10.3133/ds1035, 2017.
Kriebel, K. T.: On the variability of the reflected radiation field due to differing distributions of the irradiation, Remote Sens. Environ., 4, 257–264, 1976.
Leppänen, L., Kontu, A., Hannula, H.-R., Sjöblom, H., and Pulliainen, J.: Sodankylä manual snow survey program, Geosci. Instrum. Method. Data Syst., 5, 163–179, https://doi.org/10.5194/gi-5-163-2016, 2016.
Mac Arthur, A. and Robinson, I.: A critique of field spectroscopy and the challenges and opportunities it presents for remote sensing for agriculture, ecosystems, and hydrology, in: Proc. SPIE 9637, Remote Sensing for Agriculture, Ecosystems, and Hydrology XVII, Toulouse, France, 1–11, 14 October 2015.
Mac Arthur A., MacLellan, C. J., and Malthus, T.: The fields of view and directional response functions of two field spectroradiometers, IEEE T. Geosci. Remote., 50, 3892–3907, 2012.
Ménard, C. B., Essery, R., Barr, A., Bartlett, P., Derry, J., Dumont, M., Fierz, C., Kim, H., Kontu, A., Lejeune, Y., Marks, D., Niwano, M., Raleigh, M., Wang, L., and Wever, N.: Meteorological and evaluation datasets for snow modelling at 10 reference sites: description of in situ and bias-corrected reanalysis data, Earth Syst. Sci. Data, 11, 865–880, https://doi.org/10.5194/essd-11-865-2019, 2019.
Metsämäki, S., Anttila, S., Huttunen, J., and Vepsäläinen, J.: A feasible method for fractional snow cover mapping in boreal zone based on a reflectance model, Remote Sens. Environ., 95, 77–95, 2005.
Metsämäki, S., Mattila, O.-P., Pulliainen, J., Niemi, K., Luojus, K., and Böttcher, K.: An optical reflectance model-based method for fractional snow cover mapping applicable to continental scale, Remote Sens. Environ., 123, 508–521, 2012.
Metsämäki, S., Pulliainen, J., Salminen, M., Luojus, K., Wiesmann, A., Solberg, R., Böttcher, K., Hiltunen, M., and Ripper, E.: Introduction to GlobSnow Snow Extent products with considerations for accuracy assessment, Remote Sens. Environ. 156, 96–108, 2015.
Milton, E., Schaepman, M., Anderson, K., Kneubühler, M., and Fox, N.: Progress in field spectroscopy, Remote Sens. Environ., 113, S92–S109, 2009.
Niemi, K., Metsämäki, S., Pulliainen, J., Suokanerva, H., Böttcher, K., Leppäranta, M., and Pellikka, P.: The behaviour of mast-borne spectra in a snow-covered boreal forest, Remote Sens. Environ., 124, 551–563, 2012.
Nolin, A. W.: Recent advances in remote sensing of seasonal snow, J. Glaciol., 56, 1141–1150, 2010.
Olson, D. M. and Dinerstein, E.: The Global 200: Priority ecoregions for global conservation, Ann. Missouri Bot. Gard., 89, 199–224, 2002.
Otterman, J. and Fraser, R.: Adjacency effects on imaging by surface reflection and atmospheric scattering: cross radiance to zenith, Appl. Optics, 18, 2852–60, 1979.
Painter, T. H., Seidel, F., Bryant, A., Skiles, S. M., and Rittger, K.: Imaging spectroscopy of albedo and radiative forcing by light-absorbing impurities in mountain snow, J. Geophys. Res-Atmos., 118, 9511–9523, 2013.
Pan, Y., Birdsey, R. A., Fang, J., Houghton, R., Kauppi, P. E., Kurz, W. A., Phillips, O. L., Shvidenko, A., Lewis, S. L., Canadell, J. G., Ciais, P., Jackson, R. B., Pacala, S. W., McGuire, A. D., Piao, S., Rautiainen, A., Sitch, S., and Hayes, D.: A large and persistent carbon sink in the world's forests, Science, 333, 988–993, 2011.
Peltoniemi, J. I., Kaasalainen, S., Näränen, J., Rautiainen, M., Stenberg, P., Smolander, H., Smolander, S., and Voipio, P.: BRDF measurement of understory vegetation in pine forests: dwarf shrubs, lichen, and moss, Remote Sens. Environ., 94, 343–354, 2005.
Pfitzner, K., Bartolo, R., Carr, G., Esparon, A., and Bollhöfer, A.: Standards for reflectance spectral measurement of temporal vegetation plots, Supervising Scientist Report 195, Supervising Scientist, Darwin NT, 2011.
Pirazzini, R., Räisänen, P., Vihma, T., Johansson, M., and Tastula, E.-M.: Measurements and modelling of snow particle size and shortwave infrared albedo over a melting Antarctic ice sheet, The Cryosphere, 9, 2357–2381, https://doi.org/10.5194/tc-9-2357-2015, 2015.
Pirinen, P., Simola, H., Aalto, J., Kaukoranta, J.-P., Karlsson, P., and Ruuhela, R.: Climatological statistics of Finland 1981–2010, Finnish Meteorological Institute reports, 2012.
Pulliainen, J., Salminen, M., Heinilä, K., Cohen J., and Hannula H.-R.: Semi-empirical modelling of the scene reflectance of snow-covered boreal forest, Remote Sens. Environ., 155, 303–311, 2014.
Pulliainen, J., Aurela, M., Laurila, T., Aalto, T., Takala, M., Salminen, M., Kulmala, M., Barr, A., Heimann, M., Lindroth, A., Laaksonen, A., Derksen, C., Mäkelä, A., Markkanen, T., Lemmetyinen, J., Susiluoto, J., Dengel, S., Mammarella, I., Tuovinen, J.-P., and Vesala, T.: Early snowmelt significantly enhances boreal springtime carbon uptake, P. Natl. Acad. Sci. USA, 114, 11081–11086, https://doi.org/10.1073/pnas.1707889114, 2017.
Rasaiah, B. A., Jones, S. D., Bellman, C., and Malthus, T. J.: Critical metadata for spectroscopy field campaign, Remote Sens. Environ., 6, 3662–3680, 2014.
Rasaiah, B. A., Jones, S. D., Bellman, C., Malthus, T. J., and Hueni, A.: Assessing Field Spectroscopy Metadata Quality, Remote Sens., 7, 4499–4526, 2015.
Rollin, E., Milton, E., and Emery, D.: Reference panel anisotropy and diffuse radiation – some implications for field spectroscopy, Int. J. Remote Sens., 21, 2799–2810, 2000.
Román, M. O., Schaaf, C. B., Woodcock, C. E., Strahler, A. H., Yang, X., Braswell, R. H., Curtis, P. S., Davis, K. J., Dragoni, D., Goulden, M. L., Gu, L., Hollinger, D. Y., Kolb, T. E., Meyers, T. P., Munger, J. W., Privette, J. L., Richardson, A. D., Wilson, T. B., and Wofsy, S. C.: Spatial scaling of reflectance and surface albedo over a mixed-use, temperate forest landscape during snow-covered periods, Remote Sens. Environ., 113, 2476–2498, 2009.
Salminen, M.: Remote sensing of snow: Factors influencing seasonal snow mapping in boreal forest region. Doctoral dissertation, University of Helsinki, Faculty of Science, Department of Geosciences and Geography & Finnish Meteorological Institute Contributions No. 139, 126 pp., 2017.
Salminen, M., Pulliainen, J., Metsämäki, S., Kontu, A., and Suokanerva, H.: The behaviour of snow and snow-free surface reflectance in boreal forests: Implications to the performance of snow covered area monitoring, Remote Sens. Environ., 113, 907–918, 2009.
Salminen, M., Pulliainen, J., Metsämäki, S., Ikonen, J., Heinilä, K., and Luojus, K.: Determination of uncertainty characteristics for the satellite data-based estimation of fractional snow cover, Remote Sens. Environ., 212, 103–113, 2018.
Sandmeier, St., Müller, Ch., Hosgood, B., and Andreoli, G.: Sensitivity analysis and quality assessment of laboratory BRDF data, Remote Sens. Environ., 64, 176–91, 1998.
Schaepman-Strub, G., Schaepman, M. E., Painter, T. H., Dangel, S., and Martonchik, J. V.: Reflectance quantities in optical remote sensing – definitions and case studies, Remote Sens. Environ., 103, 27–42, 2006.
Sihvola, A. and Tiuri, M.: Snow Fork for Field Determination of the Density and Wetness Profiles of a Snow Pack, IEEE T. Geosci. Remote, GE-24, 717–721, 1986.
Springsteen, A.: Standards for the measurement of diffuse reflectance – an overview of available materials and measurement laboratories, Anal. Chim. Acta, 380, 379–390, 1999.
Starks, P. J., Walter-Shea, E. A., Schiebe, F. R., and Markham, B. L.: Temperature Sensitivity Characterization of a Silicon Diode Array Spectrometer, Remote Sens. Environ., 51, 385–389, 1995.
Sukuvaara, T., Pulliainen, J., Kyrö, E., Suokanerva, H., Heikkinen, P., and Suomalainen, J.: Reflectance spectroradiometer measurement system in 30 meter mast for validating satellite images, Proceedings of the IEEE 2007 International Geoscience and Remote Sensing Symposium (IGARSS), Sensing And Understanding Our Planet, Barcelona Spain, 1524–1528, 23–27 July 2007.
Tanikawa, T., Hori, M., Aoki, T., Hachikubo, A., Kuchiki, K., Niwano, M., Matoba, S., Yamaguchi, S., and Stamnes, K.: In-situ measurement of polarization properties of snow surface under the Brewster geometry in Hokkaido, Japan and northwest Greenland ice sheet, J. Geophys. Res.-Atmos., 119, 13946–13964, 2014.
Virtanen, R., Oksanen, L., Oksanen, T., Cohen, J., Forbes, B. C., Johansen, B., Käyhkö, J., Olofsson, J., Pulliainen, J., and Tømmervik, H.: Where do the treeless tundra areas of northern highlands fit in the global biome system: toward an ecologically natural subdivision of the tundra biome, Ecol. Evol., 6, 143–158, 2016.
Wang, Z., Schaaf, C. B., Strahler, A. H., Chopping, M. J., Román, M. O., Shuai, Y., Woodcock, C. E., Hollinger, D. Y., and Fitzjarrald, D. R.: Evaluation of MODIS albedo product (MCD43A) over grassland, agriculture and forest surface types during dormant and snow-covered periods, Remote Sens. Environ., 140, 60–77, 2014.
Wiscombe, W. J. and Warren, S. G.: A Model for the Spectral Albedo of Snow. I: Pure Snow, J. Atmos. Sci., 37, 2712–2733, 1980.